SlideShare a Scribd company logo
1 of 19
Download to read offline
SEP 09   ‘98   04:36PM   CONSOL R&D LIBRQRY                                                  P .2/20


         EVALUATION           OF AIR HEATER PERFORMANCE AND THE
                              ACCURACY OF THE RESULT
                 Joseph T. Maskew, Duane C. McCoy, (CONSOL Inc., R&D),
                Burton L. Marker (NYSEG), and James U. Watts (DOE, FETC)

With the increasedemphasison the efficiency of fossil-fuel-fired, steamgenerationfacilities, the
performance of ancillary equipment is becoming increasinglyimportant. The air heater is a
souteeof lost thermal efficiency in two ways -- air leakageinto flue gas side andpoor heat
recovery. Moreover, air inlcak makesit difftcult to determinethe exiting flue gas temperature
and the performance of the air heater. This paper addresses issue of properly evaluating the
                                                            the
air heater performance and the accuracyof the final result. The appendix discusses  the
proceduresused to determinethe individual measurements the uncertainty of these
                                                            and
measurements.

Background
As part of the I-J.S. Department of Energy’s (DOE) Clean Coal Technology IV Demonstration
Progrsm, New York State Electric & GasCorporation (NI’SEG) selectedthe Milliken Station for
installation of innovative SO?and NO, control technologiesand efficiency improvements. These
improvements will allow utilities to comply with the CleanAir Act Amendmentsof 1990. The
air heaterson Unit 2 were replacedto improve unit efficiency as part of the demonstration
program. The original air heater was a regenerativeLjungstrom unit; the replacementair heater
was a low pressuredrop, high eff%cirncyheatpipe. CONSOL R&D evaluatedthe performance
of the air heater and estimatedthe uncertainty in the evaluation.

The American Society of Mechanical Engineers(ASME) provides a standardmethod of
computing the performance of air heaters. This is performancetest code (PTC) ASME PTC 4.3.’
This method was specified as the standardof acceptable  performanceby warranteesof the new
a.irheaters. While the AShfE code is often specifiedin equipmentwarrantees,it appearsto be
rarely applied. Instead,performanceindicators such asthe measuredeffectivenessof the air- and
gas-sidesand the X-ratio are compareddirectly againstdesign values. Such comparisonsare
poor substitutesfor the ASME PTC which correctsfor part of the differencesbetween test and
design conditions independentlyof the vendor’s designalgorithms. The algorithms, normally
provided by the vendor asperformancecurvesand/or correlationsthat predict the outlet
temperaturebasedon inlet conditions, cannotbe applied directly in the ASME code. The ASME
code predicts the temperaturecorrectedto the designvalue while the performancecurvespredict
the expectedtemperatureat operating conditions. This paperprovides a method of applying the
vendor’s performance curves to evaluatethe performancecorrectedto design asper ASTM
PTC 4.3.

 An air heater is shown schematicallyin Figure I. Note that the ASh4F PTC 4.3 nomenclatureis
 used in Figure 1 and throughout this paper. In the air heater,energy in the flue gas is recovered
 by the incoming combustion air. While normally severalair streamsarc present(primary and
 secondary),in this paper we examineonly one sectionof the air heater.
SEP 09      ‘98      04:37PM     CONSOL R&D LIBRARY
                                                                                              P .a20


         s----L--,
             FloeGa Enkdng              I


      Figure 1 Air Heater Schematic
ASME PTC 4.3 calculates a “totally correctedflue gas outlet temperature”(TCFGOT), rc,$nrord,
shown below (ASME Supplement’ as Equation 7.12):
                           f GlSSTotd       = fG15cU + tG156G + ki15&Y + lG1566 -3’tG15        (1)


 t G,56A=   Flue gas temperature leaving the air heater corrected for deviation from
             design entering air temperature, OF,
 lo,sJo = Flue gas temperature leaving the ah heater corrected for deviation from design
            entering flue gas temperature, ’ F,
f015M7( Flue gas temperature leaving the air heatercorrected for deviation from design
          =
            X - ratio, ’ F,
  f G,5SE Flue gas temperature leaving the air heater corrected for deviation from design
          =
            entering gas ff ow, ’ F, and
     tGi5 = Measured flue gas temperature leaving the air heater, “F.

The PTC provides equationsfor the first two of the temperaturecorrectjons,rGIJdA tc,,6G,but
                                                                                    and
not for the other two, rca WR rc,Jh. Theselatter temperaturecorrectionsare unique to a
                                and
specific air heater. If these temperaturecorrectionsarenot provided by the equipment
manufacturer as algorithms (or plots), they can be estimatedby the procedurepresentedin this
paper. The procedure usesdesignperformancecurvesand/or algorithmsnormally provided by
the vendor to evaluatethe temperaturecorrectionsrequiredby Equation 1. The TCFGOT is then
compared to the design flue gastemperature. The computedvalue of the TCFGOT should be
less than or equal to the design flue gas temperature,if the air heateris performing properly.


The TCFGOT
The two temperaturecorrection factors provided by the PTC sre tGIs and tns rl0 These are
                                                                      d,,
defined in terms of design values and of measured results of a standardtest of an air heater. For
the deviation from the design entering air temperature,rclJM,this is:
                                                'ABD'   G14 - rGIS) + rG14+G15   - rR8)
                               ~Gl56A       =
                                                                   - 1.4s)
SEP 09    ‘98   04:37PM     CONSOL R&D LIBRRRY
                                                                                                    P. 4/a


    rAsD= Design air temperatureentering the air heater, ’ F,
     ro,4 = Measured flue gastemperatureentering the air heater, “F, and

        t AB= Measured air temperatureentering the air heater, “F.

Similarly, for the deviation from the design entering flue gas temperature,the temperature
correotion is:
                                         *c14ll   &S   - ‘48)   + ‘18 +G14    - h)
                          tGlsSG    =
                                                        (to14   - tA8)

where
    tG,4n= Design flue gastemperature
                                    enteringthe air beater,‘F.


            X-Ratio Correction                                   Flue Gas Flow Correction


                                                                         Design
                           ~Ossign X-Ratio                            Flue Gas Flaws


           /

                Measured X-Ratio                                  Measured Entering Flue Gas Flow

Figure 2 X-Ratio Correction                               Figure 3 Flue GasFlow Correction


The other two temperaturecorrectionsmust be derived from vendor designperformancecurves
or provided by the vendor in analytical form. In the caseof the NYSEG heat pipe air heater, the
vendor supplied a set of performancealgorithms to be applied “th performancefigures similar
to Figures 2 and 3, shown above. Thesepredicted the performancetemperature;that is, the
expectedexit flue gastemperaturesfor the actual operating conditions. The algorithm was of the
form:


where
SEP 09    ‘98     04:38PM   CONSOL R&D LIBRARY
                                                                                               P. 5/20


          9 = Correlation ooefftcient, and
     fG,.Jx = Correction factors for deviations from design flue gas flow and from design
               X- ratio, respectively.

For easeof analysis and of estimating the uncertainty, theseplots were convertedinto
mathematical expressionsof the form:
                                           fg=~,+h.&                                            (5)
for the flue gas flow, and for the X-ratio:
                                      f, *a2 +&.X+cS2.X2                                        (6)
where
    ~,,~,,a,,&6s         = Correlationcoefficients,
                      Fo = Flue gas flow rate, and
                       X = X-ratio for the air side.
The forms of these equationsagreewith the shapes the curvesin Figures 2 and 3. A least
                                                     of
squarescorrelation or some other curvy fitting technique can be usedto evaluatethe correlation
constants. In the caseof the Milliken study, the correlation equationsagreedwith results from
the plots within the ability to read the plots.

Since the X-ratio is defined aathe weight times heat capacityratio of the air over that of the flue
gas, the X-ratio can be approximatedas the ratio of the temperaturechangesfor the two fluids:
                                                 WA9 CpA
                                           x=
                                                 %I4   “pG
                                                                                                (7)


where
          cpA= Heat capacityof air, Btu I lb-” F,
          cpG= Heat capacityof flue gas, But / lb-* F,
         fg5 = Averageflue gasoutlettemperature
                                              corrected no-leak conditions, OF,
                                                      to
         w,,s = Weight of air exiting the air heater, lb / h, and
         wG]4   = Weight Offlue gasenteringthe air heater,lb/h.

The no-leak flue gas temperature,rz,, is calculatedfrom the measuredflue gas temperatureby:
P.WZB
sEP 09     ‘98   04:38PM    CONSOL R&D LIBRRRY


                                  tNL
                                   Cl5    = rG15 +                     - Lb)                      (8)


 where
         A, = Weight percent air leakageinto the flue gas, and
         t lunb Tempetatureof the air leaking into the flue gas.
              =

 In most air heaters,the majority of the air in the flue gasis leakagefrom the higher pressure, air-
 side of the air heater. The ASME defines’ the position ofthe air leak as occurring after the flue
 gas exits the ai~ heater,but before rc,, is measured. Thus, there can he no correction to beat
 transfer within the air heater for air leakage. In thesecases,
                                                      t omb = fA8                                 (9)
 andfAa be substituted for z,,,,,~ the following equations. However, this derivation will be
       can                       in
 general. Substituting Equation 8 into Equation 7 yields:

                                         tG14 - '015 - ".[q.(tG,5
                                                       1oo cpo         - '-)I
                                    [                                                            (10)
                             x=
                                                       OA9 - [,!8)
 Note the ASME definition for the X-ratio is baaedon zero leak. If the vendor baseshis X-ratio
 correction curve on an X-ratio with a design leak, this plot should be correctedto zero leak
 before generating Equation 6.

 For application of Equation 1, two additional, independenttemperaturecorrectionsare required.
 Thesecan be obtained from the vendor’s air heaterperformanceequation,Equation 4, and the
 associatedplots -- Figures 2 and 3. Equations similar to Equation 4 can be usedto estimatethe
 effect of one parameterindependentof the other parameters the equationto obtain a
                                                            of
 temperaturecorrection for that parameteralone. This is achievedby evaluatingEquation 4 for
 the change in one parameterwhile holding the othersconstant. FOT the deviation from the design
 X-ratio, this procedureproducesthe following equation for the temperaturecorrection, tCISMR:


                                          A.4(k15
                                              CPA II
                 ~G~~~~=~~~~+~~~G~SD-~G~~D~[~-~~~~D~~X]-~A~D~~~~~O~~X


                                          - I[- 1 -L6)
                                         + cpc
                                         [100                                                    (11)
 where
     t o,sn = Design flue gastemperatureleaving air heater, and
        fpD = De&go flue gasflow correction factor.
 For the deviation from design flow, the temperaturecorrection,to,, 6nis:

                 rGlS,=tGl5+~~fG,5~-tGl4D~~-9~fG~fXD]-r~80~9'fg~~~[~                             (12)
SEP 09   ‘98   04:38PM   CONSOL R&D LIBRRRY
                                                                                             Pa 7120


where
    fm = Design X - ratio correction factot.
Equations 1I and 12 apply the performanceequationsand/or curvesprovided by the vendor to
evaluate the effect of the changem X-ratio and flue gas flow on the measuredtemperature. The
changesfrom the design TCFGOT, the terms within the double lines (I), are applied to the
measuredflue gas outlet temperatureto provide the temperaturecorrections.

ASME PTC 4.3 specified the air heatertemperaturecorrectionsat design leak. For the NYSEG
unit, the design leak was zero. This is reflected in quation 10 where the X-ratio is correctedto
the design leak of zero before being applied to the calculation of the temperaturecorrection. The
leak correction term,

                                                                                            (13)

is re-+red since (1) the performanceequation and factor plots were basedon a zero leak design,
and (2) ASME PTC 4.3 specifiescomparingthe TCFGOT at the design conditions, which in this
caseis zero leak. Therefore, the TCFGOT must be on the samebasis as the design. The first
four terms of Equation 1 “add” in threeleak terms. The measuredflue gastemperatureleaving
the air heater, lcls, subtractsout three leak terms asthis measuredvalue containsleak. Thus, the
inclusion of a leak correction term in Equation 11 evaluatesthe TCFGOT by Equation 1, i,,,,,
at zero leak, the design condition, as specifiedby the ASME PTC 4.3.

Substituting

                                                                                             (14)


into Equation 11 and then expandingEquation 1 by substituting Equations2,3,11, and 12, along
with the air heaterperformance correlations(Equations5 and 6), resultsin the following revised
equation:
SEP 09   ‘98   04:39PM    CONSOL R&D LIBRFIRY                                                  P . E/20


 Inspection of this equation revealsthat calculation of the TCFGOT requiresonly four measured
,and 2 determined values: inlet and outlet air temperatures,  inlet and outlet flue gastemperatures,
 entering flue gas flow and the air leak. All of the other parametersare constants. The calculated
 value oftbe TCXGT from an air heaterperformancetest must be equal to or less than the
 design value for optimal air heaterperformance.

Uncertainty    Analysis
The uncertainty in the calculation of the TCFGGT by Equation 15 was estimatedin support of a
study of air heaterperformance conductedat the Milliken Station ofNew York StateElectric &
Gas Corporation (IWSEG) in 1995 and 1996. Details of the air heaterperformanceand of the
uncertainty analysis can be found in the referencedreports.23 The uncertainty in the result of a
calculation can normally be estimateddirectly by partial differentiation of Equation 15 with
respectto each parameter, To accuratelyevaluatethe uncertaintywith an explicit equation, the
equation must not be significantly nonlinear. In the caseof Equation 15, the air leak introduces a
significant non-linearity which invalidates this approach. Thus, a mathematicalapproximation
was required to evaluateme uncertainty in the TCFGOT.

Errors in measurementsare of two types: bias errors and random errors. Biasesare associated
with the measuring equipment or procedureand cannot be minimized by repeatmeasurements.
However, the TCFGOT temperaturecorrectionsconsist of differencesand ratios. This tends to
compensatefor bias errors. Random errors arereducedby repeatmeasurements.The following
derivation assumesonly one test and thus represents maximum estimatederror.
                                                    the

 The bias and random errors are propagatedseparatelyusing Taylor seriesexpansionsfor highly
 nonlinear equations:
P .9/20
SEP 09   ‘98   04:39PM   CONSOL R&D LIBRRRY


                                 Sbnv =                                                             (16)


  where
         -Af = Incremental changein the function f with respectto xi,
         &i

         - Af = Incremental changein the function f with respectto x j,
          &ni
           crX,= Error in parameteri,
           oXj = Error in parameterj, and
            f = Function shown above asEquation 15.

   This numerical approachof estimatingthe uncertaintyin the TCFGOT is similar to the one that
   Carl James4   uses for estimating the uncertainty in the d&gn of a cross-flow heat exchanger. Of
   interest is the fact that the uncertainty in the design of a heat exchangerestimatedby Jamesis
   much larger than the uncertainty in the estimateof the performance. For a numerical approach,
   Equation 16 must approximate the surfaceofthe function as a linear segmentparallel to the true
   functional relationship. With independentparameters,        only the i=j terms of Equation 16 are non-
   zero, simplifying the Taylor seriesexpansion. However, if the terms are correlatable,that is, not
   independent,then the sum of the crossproducts in Equation 16 is not zero and theseterms must
   be included in the estimate. This is discussedfurther in the appendix.

   This expansion is used to evaluatethe bias and random error contributions separately. The bias
   and random errors are summedseparatelyto form the bias error statistic and the random error
   statistic, and then combined to estimatethe total uncertainty by:

                                          u=p+(r.s)‘]~                                               (17)

   where
       U = Uncertainty interval,
         B = Overall bias error statistic,
         S = Overall random error statistic, and
         t = Appropriate Student’s t value. (For 95 % significance,       t   = 2.0 for a
              reasonable sample size.)

   The parametervalues used for the estimation of the uncertainty of the TCFGOT and the bias and
   random erroreassociatedwith them are shown below in Table I. The bias and random errors
   were estimatedby separateerror propagationcalculationsfor standard,multipoint sampling
   arrays in the inlet and outlet ducts of the air heater. Thesemultipoint sampleswere used to
P . lW20
SEP 09    '98   04:4BPM   CONSOL R&D LIBRARY


  evaluate averagetemperaturesand compositionsin the ducts. The appendixpresentsa brief
  discussionof this with a more detailed discussionavailable in the project reports5 As discussed
  in the Appendix, examination of the derivation of thesesampleerrorssuggeststhat for standard,
  multipoint traversesof utility-scale equipment,the bias and random errorsshown in Table II for
  these averagetemperaturesand compositionsare typical.


                                                  Table K

                 Value of Parameters and Their Associated Bias and Random Errors

                 Parameter             Unit          Value     Bias Error     Random Error
         Air Temperature                “F            100         1.00              0.15
         @ Inlet and Ambient
         Air Temperature                OF           644          6.44              0.74
         @ outlet
         Flue Gas Temperature           “F           680          6.81              0.81
         @ Inlet
         Flue Gas Temperature           ‘F           285          2.85              0.35
         @ Outlet
         Flue Gas Flow               1,000 lb/h       157         9.82              0.72
         Air Leak                     percent          6          0.05              0.77

  Theseparametersare propagatedusing Equation 16. The bias and random errors arepropagated
  separatelyand summedto form the B and S componentsof Equation 17. Equation 17 is then
  usedto estimatethe overall uncertainty interval.

  The following example shows the evaluation of one of the incrementalchangeterms required by
  Equation 16. To evaluatethe bias error associated
                                                  with the air temperatureat the inlet:

    1.      The TCFGOT is calculatedat the basetemperature,100 OF,plus three times the bias
            error.
    2.      Then the TCFGOT is calculated at 100 “F minus three times the bias error.
    3.      Designating these two values of the TCFGOT asf, andfp, respectively,the contribution
            to the bias error of the TCFGGT for the inlet air temperatureis evaluatedby the
            following:
!iEP 09   ‘98    04:40PM   CONSOL R&D LIBRQRY                                                     P. ii/20


                                       q=fa     -f,
                                            6.0,
                                         =31231-313.17                                           (18)
                                                      6.1
                                         = LO143

All other parametersare held constantat the values shown in Table I during this calculation.
Equation 15 is used to calculate the TCFGCT. Since the parametersh and4 were evaluatedat
three times the bias error, o,, greater and three times the bias error lower than the actual value of
the temperatureof the inlet air, the total delta is six times a,. That is, the difference between f.
sndfp is divided by six times the bias error.

To be an accurateestimateof the error, the function equation& must be relatively hear over
the range of the error. That is, iff”is the value of TCFGOT at an inlet air temperatureof 100 ‘F,
then if,

                                       f, -fO sfO -fp
                               (31291-312.74)=(312.74-313.17)
                                          0.436 = 0.422

then the assumptionof linearity and, in turn, the validity of the estimateis conflrmed.

This calculation is repeatedfor the other parameters listed in Table I and the products summed as
shown in Equation 15 to produce the resulting bias and random errors shown in Table II, This is
the estimate of the uncertainty from Equation 17 in the determinationof the “totally corrected
flue gas outlet temperature,” or TCFGOT, for an air heater. The estimateof the error in the
determination of the totally correctedflue gastemperatureis +4.75 *F for the specific conditions
shown in Table I. As a percentage,-2%, this uncertainty can be applied to evaluation of other
air heatn3.

                                                Table II

                                    Estimate of the Uncertainty of
                             the Totally Corrected Flue Gas Temperature

                 Parameter     JI&-     Bias                Random          _Uncertaintv
                TCFGOT            “F            4.57          0.66             zk4.75

Conclusions
The ASME PTC 4.3 provides a standardizedmethod for evaluatingthe performanceof utility air
heaters. It provides a mathematically cotr&Ct
                                            meansof evaluatingthe performancewhich aids in
P. 12/20
SEP 09   ‘98   04:40PM   CONSOL R&D LIBRRRY


  minimixing disputes between suppliersand purchasers     when guarantee   performauceevaluations
  are conducted. In operating plants, it is generally impossibleto establishdesign conditions to
  verify performance. To overcomethis, the PTC specifiesthat the measuredflue gas outlet
  temperaturemust be correctedfor differencesfrom design inlet air temperature,design inlet flue
  gas temperature,design X-ratio, and designflue gasrate. Oncethesecorrections are determined,
  the “‘totally corrected flue gasoutlet temperature”can be calculatedand comparedwith the
  design outlet temperature. Calculation of the first two temperaturecorrectionsis explicitly
  defined by the ASME code. The determinationof the temperaturecorrectionsfor differences
  from design X-ratio and design flue gas flow are left to the supplier or purchaserto determine.
  Normally the manufacturer will supply the purchaserwith designperformancecurves or
  equations,but not with those to calculatethe temperaturecorrectionsspecified by the PTC. This
  paper provides a method for evaluating the remaining two temperaturecorrectionsusing the
  performance curves. Should the manufactureralsoprovide proceduresfor calculating the
  specified PTC temperaturecorrections,the results can be checkedusing the proposedprocedure.
  This was done for the Mill&en air heaterperformancetesting with good agreementfound
  between the two methods.

  As part of the Mill&en air heatertest program, the uncertainty in the ASME PTC 4.3 equation
  for calculating the TCFGOT was determined. Becauseof the non-linearity of the final equation,
  numerical approximationswete usedto determinethe differentials neededfor the propagation
  procedure. For the examplepresented,the estimateduncertainty is 4.75 “F for the TCFGOT at a
  95% confidence level. This showsthat the uncertaintyin the codeprocedureis relatively small,
  about 2% of the design outlet temperatureas expressed degreesFahrenheit.
                                                         in

  References
  I.    Air Heaters-Supplement to Performance Test Codefor SteamGenerating Units,
        Pl-C 4.1; ASME/ANSI PTC 4.3 - 1974;Reaffirmed 1991,The American Society of
        Mechanical Engineers,New York, 1968.

  2.       McCoy, D. C.; Bilonick, R. A.; “Milliken Station Heat Pipe Air Heater Performance
           Uncertainty Analysis”, Report preparedby CONSOL Inc., R&D for New York State
           Electric & Gas Corporation, Binghamton, New York, June 1995.

  3.       Maskew, J. T.; ‘Milliken Station Heat Pipe Air Heater PerformanceUncertainty Analysis
           of Totallv Corrected Gas TemneratureLeavine the Air Heater”, Report preparedby
           CONSOL Inc., R&D for New York StateElectric & GasCorporation, Binghsmton, New
           York, April 1996.
  4.       James,C. A.; Taylor, R. F.; Hedge, B. K.; ‘The Application of Uncertainty Analysis to
           Cross-Flow Heat ExchangerPerformancePredictions”;Heut Transfer Engineering; 16,
           4; pp 50-61; 1995.
  5.       McCoy, D. C.; ‘Heat Pipe Performance-- Final Report”; Final report preparedby
           CONSOL Inc., R&D for New York StateElectric & GasCorporation, Binghamton, New
           York, August 1998.
SEP 09    ‘98   04:41P,,   CCNSOL R&D CIBRFlRY


                                                 APPENDXX

         Estimation of Uncertainty in the Individual Parameters Required for the Evaluation
              of the ASMlE PTC 4.3 “Totally Corrected Flue Gas Outlet Temperature”

   The uncertainty analysesdiscussedin this paper are for the American Society ofMechanical
   Engineering (ASME) proceduresfor testing the performanceof air heatersand, specifically, for
   the equation to predict the “totally correctedflue gasoutlet temperature”(TCFGOT). The
   estimatesof bias errors and random errors for the individual parameters were derived for the
   equipment and methodology used in obtaining the datarequired for a test program. This test
   program focused on evaluating the performanceof an air heaterrecently installed in the Milliken
   Station of New York StateEleotric & Gas. The methods followed in deriving the estimatesof
   the uncertainty of the individual parametersarepublished by ASME.’ Comprehensive
   discussion of all of the calculationsis published e1sewhere.l

   Milliken Station Unit 2 is a 150 MW, pulverized coal-fired boiler with twin, parallel air heaters.
   Each air heater heats both primary and secondaryair for half of the unit in separatesectionswith
   the flue gas mixed before and after the tir heater. The uncertaintyanalysispresentedbelow
   contains the results for both the primary and secondarysidesof the air heater. The design of the
   air heater was such.that all of the air leakageoccurred at sootblowerports. Air leaked from
   outside of the air heaterinto the flue gasheating the primary air. Leakageinto the side heating
   the secondaryair was insignificant and was ignored in the following evaluation.

   Test Procedure
   The general test procedure followed in the determinationof the TCFGOT was the ASME
   PerformanceTest Code (PTC) PTC 4.1’ and PTC 4.34. Individual parametersrequired by the
   PTC 4.3 were measuredfollowing generally acceptedmethods,normally U. S. Environmental
   Protection Agency (EPA) methods. For gas velocity, EPA Method 2’ was used along with EPA
   Method 16. The gas composition was determinedgenerally following the proceduresof EPA
   Method 3?. Since the ASME procedurebasesthe flue gas and air flow rates on the coal feedrate
   andgasproperties, rather than on the measuredgasand air velocities, the derivation of the errors
   of the individual parametersis complex. However, using the coal feedrate,from calibrated
   feeders,and gas compositions as a basecreatesa commonbond betweenthe air and flue gas
   flows. This createsa consistentbasis for the calculations.

   Background
   Error propagation is calculatedby Taylor Seriesexpansionof the resultant function. In general,
   if r =f(xa x2,. ., x, . . ., xJ, then the error statistics,S,,,, for either the bias error or the random
   error is calculated by


   where
P .14/20
SEP 09   ‘98   04:42PM    CONSOL R&D LIBRFIRY


         af -al = Partial derivatives of j with respectto Y, (or xi), and
         ax,’ c%cj
           cr,,, oxj = Error with respectto xi (or xj).
  when the parametersare independent,only the i=j terms are significant. For many of the
  parametersexamined in this work, the parameters      were a independentand all of the terms in
  Equation Al were evaluated. Note that using a single thermocoupleto measureall of the
  temperaturesin the traverseof a plane in a duct createsa dependency     betweenthese
  measurements. The bias error associated     with tbe thermocoupleis the samefor all points. Thus,
  it is dependent. To illustrate the calculation complexity for the estimateof the errors of the
  individual paran~eters, step-by-stepcalculation of the estimateof the uncertainty for a weight
                          a
  averagetemperatureof a gas is shown below. The averageis basedon a traverseof an inlet (or
  outlet) duct. For the details of the estimation of the uncertaintiesof other parameters,refer to the
  final Milliken project report8 Only the errors and uncertainty for theseother evaluations are
  presentedhere.

  Temperature Traverse Uncertainty Calculation
  The weight averagetemperatureof a gas flowing in a duct is basedon a flow weighted average
  of the temperaturesobtained from a standardtraverseof the duct. That is,

                                                     t              AiwT,


                                           T=%   =       j=l                                     (a
                                                          i          A,wi

                                                              ill


  where
      Ai = Cross sectional areafor point i, ft2,
        i = Traversepoint number,
      q = Temperahuemeasuredat point i, ’ R,
      vi = Velocity in areaAi determinedat point i, fps, and
      pi = Fluid density in areaA;, lb / f?.

  The fluid velocity is determinedby a Pitot tube measurement.The gas is assumedto behave
  ideally and the velocity is constant over the entire cross-sectional A,. The velocity is
                                                                     area
  calculated by:


                                        = .1 2
                                            Mi.T,
                                       vi cl: 1
                                            P,,.Mi
                                            85.49
                                                                            I

                                                                                                 (A31
P .15/20
SW    09   ‘98    04:42PM         CONSOL R&D LIBRRRY


           CP, - Pitot     tube    flow   coeffkzicnL    dimensionless,
           0,    - Vclacity       head in area i, inches W. C.,
            P,, = Static      pressure    in area i, inches Hg. absolute,        and
           M, = GAS mole weight             in CWS i. Ib / lb - mol.


     Similarly, the gas density is calculated:
                                                             0.04578. Mi .I’,;
                                                    Pi   =                                         (A41
                                                                    T,


     Substituting the formulas for vi (Equation A3) andp, (Equation A4) into Equation A2 and
     simplifying yields:


     Equation A5 is partially differentiated with respectto A, CP, dP,, M,, PI,, and T,, and the
     resulting partial summed asindicated in Equation Al. Equation A5 producessix setsof partial
     differential equations. If the denominatorof Equation A5 is set equal to Sum1and the numerator
     equal to Sum2 to simplify the resulting equations,thesepartial differentials are:

                                           ,.(~‘~.~i)‘.sum2                                        (A6)
                   Gg c~.(~..M,.P,i.7;)t.suml-cP.
                   -=
                    34               SumI’


                                   ~.(~.~,.~i.T)f.Suml-A,                              , Sum2
                                                                                                   @‘I
                    dr,,=


                                                                 xsuml-c<.A,.          sum2
                       e,                                                                          (A@
                       -=
                       aw                                          2.Suml’
P   x/20
               t&,:&W,   CONSOL R&D LIBRARY
SEP 09   ‘98


                          C4. A;.               ~Suml-Ce.4,                  .Sum2
                  -=Lg
                  a
                  a&f;                            2~SurnP


                                                ,&ml-Cf.A,,                                        (AlO)
                 ae, =                           2.sum12


   Theseindividual differentials aremultiplied and summedas shown by Equation Al. The bias
   errors and random errors, a,, for this calculation are listed in Table A-I. Table A-I also lists the
   source of the bias and random errors for eachof the parameters.As previously mentioned, many
   of the crossproduct terms must be included in the bias calculationssince the sameequipment
   was usedto measurea parameter. The inclusion of crossproducts,i@ terms, addssignificantly
   to the number of terms that must be evaluated. If there were no crossproduct terms, a duct
   traverseof 12 samplepoints in Equation A5 would require 72 terms. With the crossproducts,
   this increasesto 864 terms. In the caseof the bias error, the crossproduct telms accountfor
   essentially all of the error in determining the averagetemperature. Since the bias errors are not
   reducedby taking multiple measurements, bias errors accountfor most of the uncertainty in
                                                 the
   the final averagetemperatureas shown in Table A-II. In the caseof the secondaxy inlet,
                                                                                        air
   which has only four traversepoints, the bias error is 90% of the uncertainty in the dctetination
   of the averagetemperature.

   Table A-II summarizesthe uncertainty estimatesfor the Milliken air heater for the averageai*
   and gas temperatures. The bias error is responsiblefor the majority of the uncertainty evenwith
   only a four-point traverse. Repetitive measurements to reducethe random error.
                                                       tend

   Table A-III shows the efTorsfor the other parametersrequired to evaluatethe TCFGOT. The
   uncertainty is shown as a percent of the final calculatedvalue. All uncertainty estimatesare at
   the 95% confidence limit.
P. 17/20
SEi= 09 ‘98    04:43PM   CONSOL R&D LIBRARY


                                               Table A-I

                          Summary of Bias Errors and Precision Indices for
                                    Uncertainty Calculations

                                                RandomError
        Palsmeter            Bias Error       lOne Stand.Dev.)          CommentsI Basis
     llmension
      Width                 0.5” (0.042”)       0.5” (0.042”)    Assumed
      Length                0.5” (0.042”)       0.5” (0.042”)    Assumed

     Yemperature             l%of”F              % % of OF       Bias - Typical for Type K
                              Reading             Reading        Thermocouples,
                                                                 Random - ASME PTC 1


      Barometric             0.04” Hg             0.04” Hg       Calibration of Aneroid
                                                                 BarometerScale
      Static                 0.05” WC            0.05” WC        Water Manometer Scale
      Vel. Head, AP         2 % of Avg.         0.00005” WC      ShortridgeAir Data
                              Reading                            Multimeter, Model ADM-870
                                                                 Bias - Instrument Design Spec.
                                                                 Random - % Design Spec.

     ‘itot Factor, CP           0.01                 0.0         Calibration Accuracy

     :oal Analysis
      Moisture               3.9 % rel.       LO.20 O.O12*MQ Bias - AssumedSameas Ash
                                                   +
                                                 (2 * 1.414) Random -ASTM Repeatability
        C                    3.9 % rel.            Q.&Q          Bias - AssumedSameas Ash
                                                 (2 * 1.414)     Random - ASTM Repeatability
        I-l                  3.9 % rel.            (Q&J        Bias -Assumed Sameas Ash
                                                 (2 * 1.414)   Random - ASTM Repeatability
        N                    3.9 % rel.            10.11)      Bias -Assumed Sameas Ash
                                                 (2 * 1.414)   Random - ASTM Repeatability
        S                    1.9 % rel.       (0.06 + O.O3S*S Biss - From Washability Data
                                                 (2 * 1.414)   Random - ASTIM Repeatability
       Ash                   3.9 % rel.       10.07+ 0.02*&h  Bias -From Washability Data
                                                 (2 * 1.414)   Random - ASTM Repeatability
P. m/20
SEP 09 ‘98    04:43PM   CONSOL R&D LIBRFlRY


                                              Table A-I

                         Summary of Bias Errors and Precision Indices for
                                   Uncertainty Calculations

                                                Random Error
       Parameter            Bias Error        (One Stand.Dew.1          Comments/ Basis
    Coal Analysis (Cont.)
     CinAsh                  25 % rel.            10 %rel.       Bias - Experiencewith Milliken
                                                                 Unit 2 Loss On Ignition Data
                                                                 Random - Assumed

    Coal Rate                5 % rel.            0.25 %rel       Bias - Assumed
                                                                 Random - Typical, PTC 4.1

    Gas Analysis
      02                    0.05 % abs.         0.05 % abs.      Bias - Calibration Gas Spec
                                                                 Random - Low 0, Instrument
                                                                 Design Spec.
      CO                     20   mm              10Ppm          Same
     co,                    0.1 % abs.            3 % rel.       OrsatMeter
                                                                 Bias - Burette ScaleDivision
                                                                 Random -Experience, PTC 4.1

    Air Moisture             10 % rel.           20 % rel.       Bias - Error of 1 “F in Reading
                                                                 Wet Bulb Temperature(WBT)
                                                                 Random - Error of 2 “F in
                                                                 Reading WBT

    Molecular Wt.
     Flue Gas                  0.05                 0.07         CombinedUncertainty of
                                                                 Analysis for Ash and Flue Gas
     Air                      0.025                 0.05         Combined Uncertainty for
                                                                 Humidity
SEP 09 ‘98   04:43PM    CONSOL R&D LIBRQRY                                                 P. 19/2!2


                                             Table A-II

                       Uncertainty Estimates for Average Duct Temperatures
                                 Based upon Multi-Point Traverses

                                No. of
                               Traverse         Bias Error,      Random
        Location                Points             %“F         Jrror. %“F     Uncertaintv. %“F
   Primary Air Inlet               12               1.00           0.15             1.05
   Primary Air Outlet              20               1.00           0.11             1.03

   SecondaryAir Inlet               4               1.00           0.25             1.11
   SecondaryAir Outlet             24               1.00           0.11             1.03

   Flue Gas Inlet                  20               1.oo           0.12             1.03
   Flue Gas Outlet                 24               1.oo           0.14             1.04


                                             Table A-III

                            Uncertainty Estimates for Other Parameters
                                  Required to Evaluate TCFGOT
       Location                         Bias Error. %      RandomError. o/n    Uncertaintv. %
   Primary Air Flow, Inlet                   3.31                  2.93              6.72
   Primary Air Flow, Outlet                  2.61                  2.08              4.92

   SecondaryAir Flow,                        5.02                  0.68              5.20
   Inlet/Outlet

   Flue Gas Flow, Inlet                      6.28                  0.75              6.46
   Flue Gas Flow, Outlet                     6.25                  0.46              6.32

   Flow Split Between Air Beaters            0.43                  0.49              0.94

   Air Leak @ 6.87% Leak                     0.85                 12.60             25.21

  Conclusions
  Two conclusions can be reachedafter examining theseresults. The estimatesofthe uncertainties
  shown in Table A-II and A-III are valid for all air heaters,when a valid duct traversecari be
SEP 09 ‘98   04:44PM   CONSOL R&D LIBRARY
                                                                                           P .20/20


 performed. The uncertainty for a duct traversewith as few as4 points is still dominated by the
 bias errors. Secondly, since the dornimtnt errorsin the raw data are expressed percentages,the
                                                                                as
 results shown in Tables A-II and A-HI, and in the main body of this paper, are independentof the
 absolute values of the parameters. Thus, they apply to any air heater.

 Appendix Referencea
 1.    Measurement Uncertain@Part 1. Instrumentsand Apparatus, ANSJJASME
       PTC 19.1-1985, The American Society ofMechanical Engincera,New York, 1986.

 2.     McCoy, D. C. and Bilonick, R. A.; ‘Milliken Station Heat Pipe Air Heater Performance
        Uncertainty Analysis”; Report preparedby CONSOL Inc., R&D for New York State
        Electric & Gas Corporation, Binghamton, New York, June 1995.

 3.     Steam Generating Units, AShEJANSI PTC 4.1 - 1974; Reaffumed 1991,The American
        Society of Mechanical Engineers,New York, 1970.
 4.     Air Heaters, Supplementto Performance Test Codefor SteamGenerating Units,
        PTC 4.1, ASM&A.NSI PTC 4.3 - 1974; Reaffirmed 1991, The American Society of
        Mechanical Engineers,New York, 1968.

 5.     ERA Method 2, Determination of Stack Gas Velocityand VolumetricFlow Rate (Tjqe S
        Pitot Tube), U. S. Environmental Protection Agency, Code of FederalRegulations 40,
        Washington, D. C., 1996.

 6.     EPA Method 1, Sampleand Velociy Traverses& Stationary Sources,U. S.
        Environmental Protection Agency, Code of FederalRegulations40, Washington, D. C.,
        1996.

 7.     EPA Method 3, GasAnalysisfor CO, 0, ExcessAir, and Dry Molecular Weight, W. S.
        Environmental Protection Agency, Code of FederalRegulations 40, Washington, D. C.,
        1996.

 8.     McCoy, D. C.; ‘Xeat Pipe Performance-Final Report”, Final report preparedby
        CONSOL Inc., R&D for New York StateElectric & GasCorporation, Binghmton, New
        York, August 1998.

More Related Content

What's hot

CFD modelling of a once through steam generator for optimization of flow dist...
CFD modelling of a once through steam generator for optimization of flow dist...CFD modelling of a once through steam generator for optimization of flow dist...
CFD modelling of a once through steam generator for optimization of flow dist...Jan Rusås
 
Fire model for sizing high consequence areas associated with natural gas pipe...
Fire model for sizing high consequence areas associated with natural gas pipe...Fire model for sizing high consequence areas associated with natural gas pipe...
Fire model for sizing high consequence areas associated with natural gas pipe...Thapa Prakash (TA-1)
 
Q921 re1 lec11 v1
Q921 re1 lec11 v1Q921 re1 lec11 v1
Q921 re1 lec11 v1AFATous
 
Gt2008 51300-final-paper
Gt2008 51300-final-paperGt2008 51300-final-paper
Gt2008 51300-final-paperssusercf6d0e
 
Boiler design-calculation 3
Boiler design-calculation 3Boiler design-calculation 3
Boiler design-calculation 3Ebra21
 
Manual tables all new
Manual tables all newManual tables all new
Manual tables all newAwais Ali
 
2 ijcmp jan-2018-3-computing fluid dynamics on
2 ijcmp jan-2018-3-computing fluid dynamics on2 ijcmp jan-2018-3-computing fluid dynamics on
2 ijcmp jan-2018-3-computing fluid dynamics onAI Publications
 
The understanding of gas geochemical model to reduce the exploration uncertainty
The understanding of gas geochemical model to reduce the exploration uncertaintyThe understanding of gas geochemical model to reduce the exploration uncertainty
The understanding of gas geochemical model to reduce the exploration uncertaintyRizal Abiyudo
 
Validation of Results of Analytical Calculation of Steady State Heat Transfer...
Validation of Results of Analytical Calculation of Steady State Heat Transfer...Validation of Results of Analytical Calculation of Steady State Heat Transfer...
Validation of Results of Analytical Calculation of Steady State Heat Transfer...IRJET Journal
 
Design Proposal for a Bio-Methanol Synthesis Plant: Individual Unit Contribut...
Design Proposal for a Bio-Methanol Synthesis Plant: Individual Unit Contribut...Design Proposal for a Bio-Methanol Synthesis Plant: Individual Unit Contribut...
Design Proposal for a Bio-Methanol Synthesis Plant: Individual Unit Contribut...AnastasiaPerysinakis
 
R&amp;ac lecture 25
R&amp;ac lecture 25R&amp;ac lecture 25
R&amp;ac lecture 25sayed fathy
 
Rayegan thermo i-cengel-chapter 4-p2
Rayegan thermo i-cengel-chapter 4-p2Rayegan thermo i-cengel-chapter 4-p2
Rayegan thermo i-cengel-chapter 4-p2Larry Howard
 
4.4.heat exchanger
4.4.heat exchanger4.4.heat exchanger
4.4.heat exchangercmyan
 
Performance prediction of a thermal system using Artificial Neural Networks
Performance prediction of a thermal system using Artificial Neural NetworksPerformance prediction of a thermal system using Artificial Neural Networks
Performance prediction of a thermal system using Artificial Neural NetworksIJERD Editor
 
Productivity index
Productivity indexProductivity index
Productivity indexNabeelshykh
 

What's hot (18)

CFD modelling of a once through steam generator for optimization of flow dist...
CFD modelling of a once through steam generator for optimization of flow dist...CFD modelling of a once through steam generator for optimization of flow dist...
CFD modelling of a once through steam generator for optimization of flow dist...
 
Fire model for sizing high consequence areas associated with natural gas pipe...
Fire model for sizing high consequence areas associated with natural gas pipe...Fire model for sizing high consequence areas associated with natural gas pipe...
Fire model for sizing high consequence areas associated with natural gas pipe...
 
Q921 re1 lec11 v1
Q921 re1 lec11 v1Q921 re1 lec11 v1
Q921 re1 lec11 v1
 
Gt2008 51300-final-paper
Gt2008 51300-final-paperGt2008 51300-final-paper
Gt2008 51300-final-paper
 
Boiler design-calculation 3
Boiler design-calculation 3Boiler design-calculation 3
Boiler design-calculation 3
 
Manual tables all new
Manual tables all newManual tables all new
Manual tables all new
 
2 ijcmp jan-2018-3-computing fluid dynamics on
2 ijcmp jan-2018-3-computing fluid dynamics on2 ijcmp jan-2018-3-computing fluid dynamics on
2 ijcmp jan-2018-3-computing fluid dynamics on
 
Modelling Heat Losses in a Tar Sand Formation during Thermal Recovery Proces...
Modelling Heat Losses in a Tar Sand Formation during Thermal  Recovery Proces...Modelling Heat Losses in a Tar Sand Formation during Thermal  Recovery Proces...
Modelling Heat Losses in a Tar Sand Formation during Thermal Recovery Proces...
 
The understanding of gas geochemical model to reduce the exploration uncertainty
The understanding of gas geochemical model to reduce the exploration uncertaintyThe understanding of gas geochemical model to reduce the exploration uncertainty
The understanding of gas geochemical model to reduce the exploration uncertainty
 
Validation of Results of Analytical Calculation of Steady State Heat Transfer...
Validation of Results of Analytical Calculation of Steady State Heat Transfer...Validation of Results of Analytical Calculation of Steady State Heat Transfer...
Validation of Results of Analytical Calculation of Steady State Heat Transfer...
 
Shelltube
ShelltubeShelltube
Shelltube
 
Design Proposal for a Bio-Methanol Synthesis Plant: Individual Unit Contribut...
Design Proposal for a Bio-Methanol Synthesis Plant: Individual Unit Contribut...Design Proposal for a Bio-Methanol Synthesis Plant: Individual Unit Contribut...
Design Proposal for a Bio-Methanol Synthesis Plant: Individual Unit Contribut...
 
R&amp;ac lecture 25
R&amp;ac lecture 25R&amp;ac lecture 25
R&amp;ac lecture 25
 
Rayegan thermo i-cengel-chapter 4-p2
Rayegan thermo i-cengel-chapter 4-p2Rayegan thermo i-cengel-chapter 4-p2
Rayegan thermo i-cengel-chapter 4-p2
 
|
||
|
 
4.4.heat exchanger
4.4.heat exchanger4.4.heat exchanger
4.4.heat exchanger
 
Performance prediction of a thermal system using Artificial Neural Networks
Performance prediction of a thermal system using Artificial Neural NetworksPerformance prediction of a thermal system using Artificial Neural Networks
Performance prediction of a thermal system using Artificial Neural Networks
 
Productivity index
Productivity indexProductivity index
Productivity index
 

Similar to Evaluate Air Heater Performance and Accuracy

Artículo evaluation of air heater performance and acurracy of the results
Artículo   evaluation of air heater performance and acurracy of the resultsArtículo   evaluation of air heater performance and acurracy of the results
Artículo evaluation of air heater performance and acurracy of the resultsCaro Cuadras
 
Optimization of Air Preheater for compactness of shell by evaluating performa...
Optimization of Air Preheater for compactness of shell by evaluating performa...Optimization of Air Preheater for compactness of shell by evaluating performa...
Optimization of Air Preheater for compactness of shell by evaluating performa...Nemish Kanwar
 
Downdraft biomass gasification: experimental investigation and aspen plus sim...
Downdraft biomass gasification: experimental investigation and aspen plus sim...Downdraft biomass gasification: experimental investigation and aspen plus sim...
Downdraft biomass gasification: experimental investigation and aspen plus sim...Antonio Geraldo de Paula Oliveira
 
2007 tinga jegtp (2)
2007 tinga jegtp (2)2007 tinga jegtp (2)
2007 tinga jegtp (2)muhammad azam
 
EVALUATING MATHEMATICAL HEAT TRANSFER EFFECTIVENESS EQUATIONS USING CFD TECHN...
EVALUATING MATHEMATICAL HEAT TRANSFER EFFECTIVENESS EQUATIONS USING CFD TECHN...EVALUATING MATHEMATICAL HEAT TRANSFER EFFECTIVENESS EQUATIONS USING CFD TECHN...
EVALUATING MATHEMATICAL HEAT TRANSFER EFFECTIVENESS EQUATIONS USING CFD TECHN...AEIJjournal2
 
At231 engineering thermodynamics uq - may june 2007.
At231 engineering thermodynamics   uq -  may june 2007.At231 engineering thermodynamics   uq -  may june 2007.
At231 engineering thermodynamics uq - may june 2007.BIBIN CHIDAMBARANATHAN
 
Effect of Compression Ratio on Performance of Combined Cycle Gas Turbine
Effect of Compression Ratio on Performance of Combined Cycle Gas TurbineEffect of Compression Ratio on Performance of Combined Cycle Gas Turbine
Effect of Compression Ratio on Performance of Combined Cycle Gas Turbineijsrd.com
 
IRJET- CFD Analysis and Optimization of Heat Transfer Basket Element Profiles...
IRJET- CFD Analysis and Optimization of Heat Transfer Basket Element Profiles...IRJET- CFD Analysis and Optimization of Heat Transfer Basket Element Profiles...
IRJET- CFD Analysis and Optimization of Heat Transfer Basket Element Profiles...IRJET Journal
 
JIMEC Thermal modeling and Simulation of HX Conference Paper
JIMEC Thermal modeling and Simulation of HX Conference PaperJIMEC Thermal modeling and Simulation of HX Conference Paper
JIMEC Thermal modeling and Simulation of HX Conference PaperAhmed Sohail Izhar
 
Thermodynamic Analysis of a Cascade Refrigeration System Based On Carbon Diox...
Thermodynamic Analysis of a Cascade Refrigeration System Based On Carbon Diox...Thermodynamic Analysis of a Cascade Refrigeration System Based On Carbon Diox...
Thermodynamic Analysis of a Cascade Refrigeration System Based On Carbon Diox...IJERA Editor
 
IJSRED-V2I5P17
IJSRED-V2I5P17IJSRED-V2I5P17
IJSRED-V2I5P17IJSRED
 
ME6301 ENGINEERING THERMODYNAMICS ANNA UNIVERSITY QUESTION PAPER may june 2007.
ME6301 ENGINEERING THERMODYNAMICS ANNA UNIVERSITY QUESTION PAPER may june 2007.ME6301 ENGINEERING THERMODYNAMICS ANNA UNIVERSITY QUESTION PAPER may june 2007.
ME6301 ENGINEERING THERMODYNAMICS ANNA UNIVERSITY QUESTION PAPER may june 2007.BIBIN CHIDAMBARANATHAN
 
Java gas turbine simulator engine component mathematica models by john a. reed
Java gas turbine simulator   engine component mathematica models by john a. reedJava gas turbine simulator   engine component mathematica models by john a. reed
Java gas turbine simulator engine component mathematica models by john a. reedJulio Banks
 
Design and analysis of plate heat exchanger with co2 and r134a as working f
Design and analysis of plate heat exchanger with co2 and r134a as working fDesign and analysis of plate heat exchanger with co2 and r134a as working f
Design and analysis of plate heat exchanger with co2 and r134a as working fIAEME Publication
 
A simplified thermal model for the three way catalytic converter (1)
A simplified thermal model for the three way catalytic converter (1)A simplified thermal model for the three way catalytic converter (1)
A simplified thermal model for the three way catalytic converter (1)Varun Pandey
 

Similar to Evaluate Air Heater Performance and Accuracy (20)

Artículo evaluation of air heater performance and acurracy of the results
Artículo   evaluation of air heater performance and acurracy of the resultsArtículo   evaluation of air heater performance and acurracy of the results
Artículo evaluation of air heater performance and acurracy of the results
 
Optimization of Air Preheater for compactness of shell by evaluating performa...
Optimization of Air Preheater for compactness of shell by evaluating performa...Optimization of Air Preheater for compactness of shell by evaluating performa...
Optimization of Air Preheater for compactness of shell by evaluating performa...
 
Downdraft biomass gasification: experimental investigation and aspen plus sim...
Downdraft biomass gasification: experimental investigation and aspen plus sim...Downdraft biomass gasification: experimental investigation and aspen plus sim...
Downdraft biomass gasification: experimental investigation and aspen plus sim...
 
2007 tinga jegtp (2)
2007 tinga jegtp (2)2007 tinga jegtp (2)
2007 tinga jegtp (2)
 
EVALUATING MATHEMATICAL HEAT TRANSFER EFFECTIVENESS EQUATIONS USING CFD TECHN...
EVALUATING MATHEMATICAL HEAT TRANSFER EFFECTIVENESS EQUATIONS USING CFD TECHN...EVALUATING MATHEMATICAL HEAT TRANSFER EFFECTIVENESS EQUATIONS USING CFD TECHN...
EVALUATING MATHEMATICAL HEAT TRANSFER EFFECTIVENESS EQUATIONS USING CFD TECHN...
 
EVALUATING MATHEMATICAL HEAT TRANSFER EFFECTIVENESS EQUATIONS USING CFD TECHN...
EVALUATING MATHEMATICAL HEAT TRANSFER EFFECTIVENESS EQUATIONS USING CFD TECHN...EVALUATING MATHEMATICAL HEAT TRANSFER EFFECTIVENESS EQUATIONS USING CFD TECHN...
EVALUATING MATHEMATICAL HEAT TRANSFER EFFECTIVENESS EQUATIONS USING CFD TECHN...
 
At231 engineering thermodynamics uq - may june 2007.
At231 engineering thermodynamics   uq -  may june 2007.At231 engineering thermodynamics   uq -  may june 2007.
At231 engineering thermodynamics uq - may june 2007.
 
Cu4201638643
Cu4201638643Cu4201638643
Cu4201638643
 
Effect of Compression Ratio on Performance of Combined Cycle Gas Turbine
Effect of Compression Ratio on Performance of Combined Cycle Gas TurbineEffect of Compression Ratio on Performance of Combined Cycle Gas Turbine
Effect of Compression Ratio on Performance of Combined Cycle Gas Turbine
 
HHO driven CCPP
HHO driven CCPPHHO driven CCPP
HHO driven CCPP
 
IRJET- CFD Analysis and Optimization of Heat Transfer Basket Element Profiles...
IRJET- CFD Analysis and Optimization of Heat Transfer Basket Element Profiles...IRJET- CFD Analysis and Optimization of Heat Transfer Basket Element Profiles...
IRJET- CFD Analysis and Optimization of Heat Transfer Basket Element Profiles...
 
JIMEC Thermal modeling and Simulation of HX Conference Paper
JIMEC Thermal modeling and Simulation of HX Conference PaperJIMEC Thermal modeling and Simulation of HX Conference Paper
JIMEC Thermal modeling and Simulation of HX Conference Paper
 
Thermodynamic Analysis of a Cascade Refrigeration System Based On Carbon Diox...
Thermodynamic Analysis of a Cascade Refrigeration System Based On Carbon Diox...Thermodynamic Analysis of a Cascade Refrigeration System Based On Carbon Diox...
Thermodynamic Analysis of a Cascade Refrigeration System Based On Carbon Diox...
 
IJSRED-V2I5P17
IJSRED-V2I5P17IJSRED-V2I5P17
IJSRED-V2I5P17
 
ME6301 ENGINEERING THERMODYNAMICS ANNA UNIVERSITY QUESTION PAPER may june 2007.
ME6301 ENGINEERING THERMODYNAMICS ANNA UNIVERSITY QUESTION PAPER may june 2007.ME6301 ENGINEERING THERMODYNAMICS ANNA UNIVERSITY QUESTION PAPER may june 2007.
ME6301 ENGINEERING THERMODYNAMICS ANNA UNIVERSITY QUESTION PAPER may june 2007.
 
30120130406006
3012013040600630120130406006
30120130406006
 
Java gas turbine simulator engine component mathematica models by john a. reed
Java gas turbine simulator   engine component mathematica models by john a. reedJava gas turbine simulator   engine component mathematica models by john a. reed
Java gas turbine simulator engine component mathematica models by john a. reed
 
O13040297104
O13040297104O13040297104
O13040297104
 
Design and analysis of plate heat exchanger with co2 and r134a as working f
Design and analysis of plate heat exchanger with co2 and r134a as working fDesign and analysis of plate heat exchanger with co2 and r134a as working f
Design and analysis of plate heat exchanger with co2 and r134a as working f
 
A simplified thermal model for the three way catalytic converter (1)
A simplified thermal model for the three way catalytic converter (1)A simplified thermal model for the three way catalytic converter (1)
A simplified thermal model for the three way catalytic converter (1)
 

Recently uploaded

Z Score,T Score, Percential Rank and Box Plot Graph
Z Score,T Score, Percential Rank and Box Plot GraphZ Score,T Score, Percential Rank and Box Plot Graph
Z Score,T Score, Percential Rank and Box Plot GraphThiyagu K
 
Russian Call Girls in Andheri Airport Mumbai WhatsApp 9167673311 💞 Full Nigh...
Russian Call Girls in Andheri Airport Mumbai WhatsApp  9167673311 💞 Full Nigh...Russian Call Girls in Andheri Airport Mumbai WhatsApp  9167673311 💞 Full Nigh...
Russian Call Girls in Andheri Airport Mumbai WhatsApp 9167673311 💞 Full Nigh...Pooja Nehwal
 
1029 - Danh muc Sach Giao Khoa 10 . pdf
1029 -  Danh muc Sach Giao Khoa 10 . pdf1029 -  Danh muc Sach Giao Khoa 10 . pdf
1029 - Danh muc Sach Giao Khoa 10 . pdfQucHHunhnh
 
Advanced Views - Calendar View in Odoo 17
Advanced Views - Calendar View in Odoo 17Advanced Views - Calendar View in Odoo 17
Advanced Views - Calendar View in Odoo 17Celine George
 
Kisan Call Centre - To harness potential of ICT in Agriculture by answer farm...
Kisan Call Centre - To harness potential of ICT in Agriculture by answer farm...Kisan Call Centre - To harness potential of ICT in Agriculture by answer farm...
Kisan Call Centre - To harness potential of ICT in Agriculture by answer farm...Krashi Coaching
 
Call Girls in Dwarka Mor Delhi Contact Us 9654467111
Call Girls in Dwarka Mor Delhi Contact Us 9654467111Call Girls in Dwarka Mor Delhi Contact Us 9654467111
Call Girls in Dwarka Mor Delhi Contact Us 9654467111Sapana Sha
 
Q4-W6-Restating Informational Text Grade 3
Q4-W6-Restating Informational Text Grade 3Q4-W6-Restating Informational Text Grade 3
Q4-W6-Restating Informational Text Grade 3JemimahLaneBuaron
 
Grant Readiness 101 TechSoup and Remy Consulting
Grant Readiness 101 TechSoup and Remy ConsultingGrant Readiness 101 TechSoup and Remy Consulting
Grant Readiness 101 TechSoup and Remy ConsultingTechSoup
 
A Critique of the Proposed National Education Policy Reform
A Critique of the Proposed National Education Policy ReformA Critique of the Proposed National Education Policy Reform
A Critique of the Proposed National Education Policy ReformChameera Dedduwage
 
Measures of Dispersion and Variability: Range, QD, AD and SD
Measures of Dispersion and Variability: Range, QD, AD and SDMeasures of Dispersion and Variability: Range, QD, AD and SD
Measures of Dispersion and Variability: Range, QD, AD and SDThiyagu K
 
Software Engineering Methodologies (overview)
Software Engineering Methodologies (overview)Software Engineering Methodologies (overview)
Software Engineering Methodologies (overview)eniolaolutunde
 
CARE OF CHILD IN INCUBATOR..........pptx
CARE OF CHILD IN INCUBATOR..........pptxCARE OF CHILD IN INCUBATOR..........pptx
CARE OF CHILD IN INCUBATOR..........pptxGaneshChakor2
 
Nutritional Needs Presentation - HLTH 104
Nutritional Needs Presentation - HLTH 104Nutritional Needs Presentation - HLTH 104
Nutritional Needs Presentation - HLTH 104misteraugie
 
The byproduct of sericulture in different industries.pptx
The byproduct of sericulture in different industries.pptxThe byproduct of sericulture in different industries.pptx
The byproduct of sericulture in different industries.pptxShobhayan Kirtania
 
Sports & Fitness Value Added Course FY..
Sports & Fitness Value Added Course FY..Sports & Fitness Value Added Course FY..
Sports & Fitness Value Added Course FY..Disha Kariya
 
The Most Excellent Way | 1 Corinthians 13
The Most Excellent Way | 1 Corinthians 13The Most Excellent Way | 1 Corinthians 13
The Most Excellent Way | 1 Corinthians 13Steve Thomason
 
BAG TECHNIQUE Bag technique-a tool making use of public health bag through wh...
BAG TECHNIQUE Bag technique-a tool making use of public health bag through wh...BAG TECHNIQUE Bag technique-a tool making use of public health bag through wh...
BAG TECHNIQUE Bag technique-a tool making use of public health bag through wh...Sapna Thakur
 
Measures of Central Tendency: Mean, Median and Mode
Measures of Central Tendency: Mean, Median and ModeMeasures of Central Tendency: Mean, Median and Mode
Measures of Central Tendency: Mean, Median and ModeThiyagu K
 
Beyond the EU: DORA and NIS 2 Directive's Global Impact
Beyond the EU: DORA and NIS 2 Directive's Global ImpactBeyond the EU: DORA and NIS 2 Directive's Global Impact
Beyond the EU: DORA and NIS 2 Directive's Global ImpactPECB
 

Recently uploaded (20)

Z Score,T Score, Percential Rank and Box Plot Graph
Z Score,T Score, Percential Rank and Box Plot GraphZ Score,T Score, Percential Rank and Box Plot Graph
Z Score,T Score, Percential Rank and Box Plot Graph
 
Russian Call Girls in Andheri Airport Mumbai WhatsApp 9167673311 💞 Full Nigh...
Russian Call Girls in Andheri Airport Mumbai WhatsApp  9167673311 💞 Full Nigh...Russian Call Girls in Andheri Airport Mumbai WhatsApp  9167673311 💞 Full Nigh...
Russian Call Girls in Andheri Airport Mumbai WhatsApp 9167673311 💞 Full Nigh...
 
1029 - Danh muc Sach Giao Khoa 10 . pdf
1029 -  Danh muc Sach Giao Khoa 10 . pdf1029 -  Danh muc Sach Giao Khoa 10 . pdf
1029 - Danh muc Sach Giao Khoa 10 . pdf
 
Advanced Views - Calendar View in Odoo 17
Advanced Views - Calendar View in Odoo 17Advanced Views - Calendar View in Odoo 17
Advanced Views - Calendar View in Odoo 17
 
Kisan Call Centre - To harness potential of ICT in Agriculture by answer farm...
Kisan Call Centre - To harness potential of ICT in Agriculture by answer farm...Kisan Call Centre - To harness potential of ICT in Agriculture by answer farm...
Kisan Call Centre - To harness potential of ICT in Agriculture by answer farm...
 
Mattingly "AI & Prompt Design: Structured Data, Assistants, & RAG"
Mattingly "AI & Prompt Design: Structured Data, Assistants, & RAG"Mattingly "AI & Prompt Design: Structured Data, Assistants, & RAG"
Mattingly "AI & Prompt Design: Structured Data, Assistants, & RAG"
 
Call Girls in Dwarka Mor Delhi Contact Us 9654467111
Call Girls in Dwarka Mor Delhi Contact Us 9654467111Call Girls in Dwarka Mor Delhi Contact Us 9654467111
Call Girls in Dwarka Mor Delhi Contact Us 9654467111
 
Q4-W6-Restating Informational Text Grade 3
Q4-W6-Restating Informational Text Grade 3Q4-W6-Restating Informational Text Grade 3
Q4-W6-Restating Informational Text Grade 3
 
Grant Readiness 101 TechSoup and Remy Consulting
Grant Readiness 101 TechSoup and Remy ConsultingGrant Readiness 101 TechSoup and Remy Consulting
Grant Readiness 101 TechSoup and Remy Consulting
 
A Critique of the Proposed National Education Policy Reform
A Critique of the Proposed National Education Policy ReformA Critique of the Proposed National Education Policy Reform
A Critique of the Proposed National Education Policy Reform
 
Measures of Dispersion and Variability: Range, QD, AD and SD
Measures of Dispersion and Variability: Range, QD, AD and SDMeasures of Dispersion and Variability: Range, QD, AD and SD
Measures of Dispersion and Variability: Range, QD, AD and SD
 
Software Engineering Methodologies (overview)
Software Engineering Methodologies (overview)Software Engineering Methodologies (overview)
Software Engineering Methodologies (overview)
 
CARE OF CHILD IN INCUBATOR..........pptx
CARE OF CHILD IN INCUBATOR..........pptxCARE OF CHILD IN INCUBATOR..........pptx
CARE OF CHILD IN INCUBATOR..........pptx
 
Nutritional Needs Presentation - HLTH 104
Nutritional Needs Presentation - HLTH 104Nutritional Needs Presentation - HLTH 104
Nutritional Needs Presentation - HLTH 104
 
The byproduct of sericulture in different industries.pptx
The byproduct of sericulture in different industries.pptxThe byproduct of sericulture in different industries.pptx
The byproduct of sericulture in different industries.pptx
 
Sports & Fitness Value Added Course FY..
Sports & Fitness Value Added Course FY..Sports & Fitness Value Added Course FY..
Sports & Fitness Value Added Course FY..
 
The Most Excellent Way | 1 Corinthians 13
The Most Excellent Way | 1 Corinthians 13The Most Excellent Way | 1 Corinthians 13
The Most Excellent Way | 1 Corinthians 13
 
BAG TECHNIQUE Bag technique-a tool making use of public health bag through wh...
BAG TECHNIQUE Bag technique-a tool making use of public health bag through wh...BAG TECHNIQUE Bag technique-a tool making use of public health bag through wh...
BAG TECHNIQUE Bag technique-a tool making use of public health bag through wh...
 
Measures of Central Tendency: Mean, Median and Mode
Measures of Central Tendency: Mean, Median and ModeMeasures of Central Tendency: Mean, Median and Mode
Measures of Central Tendency: Mean, Median and Mode
 
Beyond the EU: DORA and NIS 2 Directive's Global Impact
Beyond the EU: DORA and NIS 2 Directive's Global ImpactBeyond the EU: DORA and NIS 2 Directive's Global Impact
Beyond the EU: DORA and NIS 2 Directive's Global Impact
 

Evaluate Air Heater Performance and Accuracy

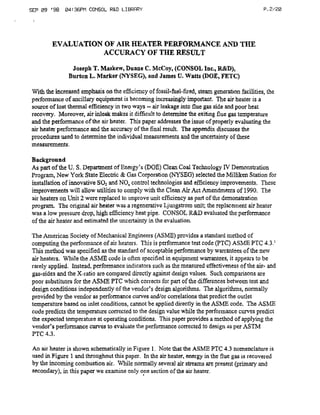
  • 1. SEP 09 ‘98 04:36PM CONSOL R&D LIBRQRY P .2/20 EVALUATION OF AIR HEATER PERFORMANCE AND THE ACCURACY OF THE RESULT Joseph T. Maskew, Duane C. McCoy, (CONSOL Inc., R&D), Burton L. Marker (NYSEG), and James U. Watts (DOE, FETC) With the increasedemphasison the efficiency of fossil-fuel-fired, steamgenerationfacilities, the performance of ancillary equipment is becoming increasinglyimportant. The air heater is a souteeof lost thermal efficiency in two ways -- air leakageinto flue gas side andpoor heat recovery. Moreover, air inlcak makesit difftcult to determinethe exiting flue gas temperature and the performance of the air heater. This paper addresses issue of properly evaluating the the air heater performance and the accuracyof the final result. The appendix discusses the proceduresused to determinethe individual measurements the uncertainty of these and measurements. Background As part of the I-J.S. Department of Energy’s (DOE) Clean Coal Technology IV Demonstration Progrsm, New York State Electric & GasCorporation (NI’SEG) selectedthe Milliken Station for installation of innovative SO?and NO, control technologiesand efficiency improvements. These improvements will allow utilities to comply with the CleanAir Act Amendmentsof 1990. The air heaterson Unit 2 were replacedto improve unit efficiency as part of the demonstration program. The original air heater was a regenerativeLjungstrom unit; the replacementair heater was a low pressuredrop, high eff%cirncyheatpipe. CONSOL R&D evaluatedthe performance of the air heater and estimatedthe uncertainty in the evaluation. The American Society of Mechanical Engineers(ASME) provides a standardmethod of computing the performance of air heaters. This is performancetest code (PTC) ASME PTC 4.3.’ This method was specified as the standardof acceptable performanceby warranteesof the new a.irheaters. While the AShfE code is often specifiedin equipmentwarrantees,it appearsto be rarely applied. Instead,performanceindicators such asthe measuredeffectivenessof the air- and gas-sidesand the X-ratio are compareddirectly againstdesign values. Such comparisonsare poor substitutesfor the ASME PTC which correctsfor part of the differencesbetween test and design conditions independentlyof the vendor’s designalgorithms. The algorithms, normally provided by the vendor asperformancecurvesand/or correlationsthat predict the outlet temperaturebasedon inlet conditions, cannotbe applied directly in the ASME code. The ASME code predicts the temperaturecorrectedto the designvalue while the performancecurvespredict the expectedtemperatureat operating conditions. This paperprovides a method of applying the vendor’s performance curves to evaluatethe performancecorrectedto design asper ASTM PTC 4.3. An air heater is shown schematicallyin Figure I. Note that the ASh4F PTC 4.3 nomenclatureis used in Figure 1 and throughout this paper. In the air heater,energy in the flue gas is recovered by the incoming combustion air. While normally severalair streamsarc present(primary and secondary),in this paper we examineonly one sectionof the air heater.
  • 2. SEP 09 ‘98 04:37PM CONSOL R&D LIBRARY P .a20 s----L--, FloeGa Enkdng I Figure 1 Air Heater Schematic ASME PTC 4.3 calculates a “totally correctedflue gas outlet temperature”(TCFGOT), rc,$nrord, shown below (ASME Supplement’ as Equation 7.12): f GlSSTotd = fG15cU + tG156G + ki15&Y + lG1566 -3’tG15 (1) t G,56A= Flue gas temperature leaving the air heater corrected for deviation from design entering air temperature, OF, lo,sJo = Flue gas temperature leaving the ah heater corrected for deviation from design entering flue gas temperature, ’ F, f015M7( Flue gas temperature leaving the air heatercorrected for deviation from design = X - ratio, ’ F, f G,5SE Flue gas temperature leaving the air heater corrected for deviation from design = entering gas ff ow, ’ F, and tGi5 = Measured flue gas temperature leaving the air heater, “F. The PTC provides equationsfor the first two of the temperaturecorrectjons,rGIJdA tc,,6G,but and not for the other two, rca WR rc,Jh. Theselatter temperaturecorrectionsare unique to a and specific air heater. If these temperaturecorrectionsarenot provided by the equipment manufacturer as algorithms (or plots), they can be estimatedby the procedurepresentedin this paper. The procedure usesdesignperformancecurvesand/or algorithmsnormally provided by the vendor to evaluatethe temperaturecorrectionsrequiredby Equation 1. The TCFGOT is then compared to the design flue gastemperature. The computedvalue of the TCFGOT should be less than or equal to the design flue gas temperature,if the air heateris performing properly. The TCFGOT The two temperaturecorrection factors provided by the PTC sre tGIs and tns rl0 These are d,, defined in terms of design values and of measured results of a standardtest of an air heater. For the deviation from the design entering air temperature,rclJM,this is: 'ABD' G14 - rGIS) + rG14+G15 - rR8) ~Gl56A = - 1.4s)
  • 3. SEP 09 ‘98 04:37PM CONSOL R&D LIBRRRY P. 4/a rAsD= Design air temperatureentering the air heater, ’ F, ro,4 = Measured flue gastemperatureentering the air heater, “F, and t AB= Measured air temperatureentering the air heater, “F. Similarly, for the deviation from the design entering flue gas temperature,the temperature correotion is: *c14ll &S - ‘48) + ‘18 +G14 - h) tGlsSG = (to14 - tA8) where tG,4n= Design flue gastemperature enteringthe air beater,‘F. X-Ratio Correction Flue Gas Flow Correction Design ~Ossign X-Ratio Flue Gas Flaws / Measured X-Ratio Measured Entering Flue Gas Flow Figure 2 X-Ratio Correction Figure 3 Flue GasFlow Correction The other two temperaturecorrectionsmust be derived from vendor designperformancecurves or provided by the vendor in analytical form. In the caseof the NYSEG heat pipe air heater, the vendor supplied a set of performancealgorithms to be applied “th performancefigures similar to Figures 2 and 3, shown above. Thesepredicted the performancetemperature;that is, the expectedexit flue gastemperaturesfor the actual operating conditions. The algorithm was of the form: where
  • 4. SEP 09 ‘98 04:38PM CONSOL R&D LIBRARY P. 5/20 9 = Correlation ooefftcient, and fG,.Jx = Correction factors for deviations from design flue gas flow and from design X- ratio, respectively. For easeof analysis and of estimating the uncertainty, theseplots were convertedinto mathematical expressionsof the form: fg=~,+h.& (5) for the flue gas flow, and for the X-ratio: f, *a2 +&.X+cS2.X2 (6) where ~,,~,,a,,&6s = Correlationcoefficients, Fo = Flue gas flow rate, and X = X-ratio for the air side. The forms of these equationsagreewith the shapes the curvesin Figures 2 and 3. A least of squarescorrelation or some other curvy fitting technique can be usedto evaluatethe correlation constants. In the caseof the Milliken study, the correlation equationsagreedwith results from the plots within the ability to read the plots. Since the X-ratio is defined aathe weight times heat capacityratio of the air over that of the flue gas, the X-ratio can be approximatedas the ratio of the temperaturechangesfor the two fluids: WA9 CpA x= %I4 “pG (7) where cpA= Heat capacityof air, Btu I lb-” F, cpG= Heat capacityof flue gas, But / lb-* F, fg5 = Averageflue gasoutlettemperature corrected no-leak conditions, OF, to w,,s = Weight of air exiting the air heater, lb / h, and wG]4 = Weight Offlue gasenteringthe air heater,lb/h. The no-leak flue gas temperature,rz,, is calculatedfrom the measuredflue gas temperatureby:
  • 5. P.WZB sEP 09 ‘98 04:38PM CONSOL R&D LIBRRRY tNL Cl5 = rG15 + - Lb) (8) where A, = Weight percent air leakageinto the flue gas, and t lunb Tempetatureof the air leaking into the flue gas. = In most air heaters,the majority of the air in the flue gasis leakagefrom the higher pressure, air- side of the air heater. The ASME defines’ the position ofthe air leak as occurring after the flue gas exits the ai~ heater,but before rc,, is measured. Thus, there can he no correction to beat transfer within the air heater for air leakage. In thesecases, t omb = fA8 (9) andfAa be substituted for z,,,,,~ the following equations. However, this derivation will be can in general. Substituting Equation 8 into Equation 7 yields: tG14 - '015 - ".[q.(tG,5 1oo cpo - '-)I [ (10) x= OA9 - [,!8) Note the ASME definition for the X-ratio is baaedon zero leak. If the vendor baseshis X-ratio correction curve on an X-ratio with a design leak, this plot should be correctedto zero leak before generating Equation 6. For application of Equation 1, two additional, independenttemperaturecorrectionsare required. Thesecan be obtained from the vendor’s air heaterperformanceequation,Equation 4, and the associatedplots -- Figures 2 and 3. Equations similar to Equation 4 can be usedto estimatethe effect of one parameterindependentof the other parameters the equationto obtain a of temperaturecorrection for that parameteralone. This is achievedby evaluatingEquation 4 for the change in one parameterwhile holding the othersconstant. FOT the deviation from the design X-ratio, this procedureproducesthe following equation for the temperaturecorrection, tCISMR: A.4(k15 CPA II ~G~~~~=~~~~+~~~G~SD-~G~~D~[~-~~~~D~~X]-~A~D~~~~~O~~X - I[- 1 -L6) + cpc [100 (11) where t o,sn = Design flue gastemperatureleaving air heater, and fpD = De&go flue gasflow correction factor. For the deviation from design flow, the temperaturecorrection,to,, 6nis: rGlS,=tGl5+~~fG,5~-tGl4D~~-9~fG~fXD]-r~80~9'fg~~~[~ (12)
  • 6. SEP 09 ‘98 04:38PM CONSOL R&D LIBRRRY Pa 7120 where fm = Design X - ratio correction factot. Equations 1I and 12 apply the performanceequationsand/or curvesprovided by the vendor to evaluate the effect of the changem X-ratio and flue gas flow on the measuredtemperature. The changesfrom the design TCFGOT, the terms within the double lines (I), are applied to the measuredflue gas outlet temperatureto provide the temperaturecorrections. ASME PTC 4.3 specified the air heatertemperaturecorrectionsat design leak. For the NYSEG unit, the design leak was zero. This is reflected in quation 10 where the X-ratio is correctedto the design leak of zero before being applied to the calculation of the temperaturecorrection. The leak correction term, (13) is re-+red since (1) the performanceequation and factor plots were basedon a zero leak design, and (2) ASME PTC 4.3 specifiescomparingthe TCFGOT at the design conditions, which in this caseis zero leak. Therefore, the TCFGOT must be on the samebasis as the design. The first four terms of Equation 1 “add” in threeleak terms. The measuredflue gastemperatureleaving the air heater, lcls, subtractsout three leak terms asthis measuredvalue containsleak. Thus, the inclusion of a leak correction term in Equation 11 evaluatesthe TCFGOT by Equation 1, i,,,,, at zero leak, the design condition, as specifiedby the ASME PTC 4.3. Substituting (14) into Equation 11 and then expandingEquation 1 by substituting Equations2,3,11, and 12, along with the air heaterperformance correlations(Equations5 and 6), resultsin the following revised equation:
  • 7. SEP 09 ‘98 04:39PM CONSOL R&D LIBRFIRY P . E/20 Inspection of this equation revealsthat calculation of the TCFGOT requiresonly four measured ,and 2 determined values: inlet and outlet air temperatures, inlet and outlet flue gastemperatures, entering flue gas flow and the air leak. All of the other parametersare constants. The calculated value oftbe TCXGT from an air heaterperformancetest must be equal to or less than the design value for optimal air heaterperformance. Uncertainty Analysis The uncertainty in the calculation of the TCFGGT by Equation 15 was estimatedin support of a study of air heaterperformance conductedat the Milliken Station ofNew York StateElectric & Gas Corporation (IWSEG) in 1995 and 1996. Details of the air heaterperformanceand of the uncertainty analysis can be found in the referencedreports.23 The uncertainty in the result of a calculation can normally be estimateddirectly by partial differentiation of Equation 15 with respectto each parameter, To accuratelyevaluatethe uncertaintywith an explicit equation, the equation must not be significantly nonlinear. In the caseof Equation 15, the air leak introduces a significant non-linearity which invalidates this approach. Thus, a mathematicalapproximation was required to evaluateme uncertainty in the TCFGOT. Errors in measurementsare of two types: bias errors and random errors. Biasesare associated with the measuring equipment or procedureand cannot be minimized by repeatmeasurements. However, the TCFGOT temperaturecorrectionsconsist of differencesand ratios. This tends to compensatefor bias errors. Random errors arereducedby repeatmeasurements.The following derivation assumesonly one test and thus represents maximum estimatederror. the The bias and random errors are propagatedseparatelyusing Taylor seriesexpansionsfor highly nonlinear equations:
  • 8. P .9/20 SEP 09 ‘98 04:39PM CONSOL R&D LIBRRRY Sbnv = (16) where -Af = Incremental changein the function f with respectto xi, &i - Af = Incremental changein the function f with respectto x j, &ni crX,= Error in parameteri, oXj = Error in parameterj, and f = Function shown above asEquation 15. This numerical approachof estimatingthe uncertaintyin the TCFGOT is similar to the one that Carl James4 uses for estimating the uncertainty in the d&gn of a cross-flow heat exchanger. Of interest is the fact that the uncertainty in the design of a heat exchangerestimatedby Jamesis much larger than the uncertainty in the estimateof the performance. For a numerical approach, Equation 16 must approximate the surfaceofthe function as a linear segmentparallel to the true functional relationship. With independentparameters, only the i=j terms of Equation 16 are non- zero, simplifying the Taylor seriesexpansion. However, if the terms are correlatable,that is, not independent,then the sum of the crossproducts in Equation 16 is not zero and theseterms must be included in the estimate. This is discussedfurther in the appendix. This expansion is used to evaluatethe bias and random error contributions separately. The bias and random errors are summedseparatelyto form the bias error statistic and the random error statistic, and then combined to estimatethe total uncertainty by: u=p+(r.s)‘]~ (17) where U = Uncertainty interval, B = Overall bias error statistic, S = Overall random error statistic, and t = Appropriate Student’s t value. (For 95 % significance, t = 2.0 for a reasonable sample size.) The parametervalues used for the estimation of the uncertainty of the TCFGOT and the bias and random erroreassociatedwith them are shown below in Table I. The bias and random errors were estimatedby separateerror propagationcalculationsfor standard,multipoint sampling arrays in the inlet and outlet ducts of the air heater. Thesemultipoint sampleswere used to
  • 9. P . lW20 SEP 09 '98 04:4BPM CONSOL R&D LIBRARY evaluate averagetemperaturesand compositionsin the ducts. The appendixpresentsa brief discussionof this with a more detailed discussionavailable in the project reports5 As discussed in the Appendix, examination of the derivation of thesesampleerrorssuggeststhat for standard, multipoint traversesof utility-scale equipment,the bias and random errorsshown in Table II for these averagetemperaturesand compositionsare typical. Table K Value of Parameters and Their Associated Bias and Random Errors Parameter Unit Value Bias Error Random Error Air Temperature “F 100 1.00 0.15 @ Inlet and Ambient Air Temperature OF 644 6.44 0.74 @ outlet Flue Gas Temperature “F 680 6.81 0.81 @ Inlet Flue Gas Temperature ‘F 285 2.85 0.35 @ Outlet Flue Gas Flow 1,000 lb/h 157 9.82 0.72 Air Leak percent 6 0.05 0.77 Theseparametersare propagatedusing Equation 16. The bias and random errors arepropagated separatelyand summedto form the B and S componentsof Equation 17. Equation 17 is then usedto estimatethe overall uncertainty interval. The following example shows the evaluation of one of the incrementalchangeterms required by Equation 16. To evaluatethe bias error associated with the air temperatureat the inlet: 1. The TCFGOT is calculatedat the basetemperature,100 OF,plus three times the bias error. 2. Then the TCFGOT is calculated at 100 “F minus three times the bias error. 3. Designating these two values of the TCFGOT asf, andfp, respectively,the contribution to the bias error of the TCFGGT for the inlet air temperatureis evaluatedby the following:
  • 10. !iEP 09 ‘98 04:40PM CONSOL R&D LIBRQRY P. ii/20 q=fa -f, 6.0, =31231-313.17 (18) 6.1 = LO143 All other parametersare held constantat the values shown in Table I during this calculation. Equation 15 is used to calculate the TCFGCT. Since the parametersh and4 were evaluatedat three times the bias error, o,, greater and three times the bias error lower than the actual value of the temperatureof the inlet air, the total delta is six times a,. That is, the difference between f. sndfp is divided by six times the bias error. To be an accurateestimateof the error, the function equation& must be relatively hear over the range of the error. That is, iff”is the value of TCFGOT at an inlet air temperatureof 100 ‘F, then if, f, -fO sfO -fp (31291-312.74)=(312.74-313.17) 0.436 = 0.422 then the assumptionof linearity and, in turn, the validity of the estimateis conflrmed. This calculation is repeatedfor the other parameters listed in Table I and the products summed as shown in Equation 15 to produce the resulting bias and random errors shown in Table II, This is the estimate of the uncertainty from Equation 17 in the determinationof the “totally corrected flue gas outlet temperature,” or TCFGOT, for an air heater. The estimateof the error in the determination of the totally correctedflue gastemperatureis +4.75 *F for the specific conditions shown in Table I. As a percentage,-2%, this uncertainty can be applied to evaluation of other air heatn3. Table II Estimate of the Uncertainty of the Totally Corrected Flue Gas Temperature Parameter JI&- Bias Random _Uncertaintv TCFGOT “F 4.57 0.66 zk4.75 Conclusions The ASME PTC 4.3 provides a standardizedmethod for evaluatingthe performanceof utility air heaters. It provides a mathematically cotr&Ct meansof evaluatingthe performancewhich aids in
  • 11. P. 12/20 SEP 09 ‘98 04:40PM CONSOL R&D LIBRRRY minimixing disputes between suppliersand purchasers when guarantee performauceevaluations are conducted. In operating plants, it is generally impossibleto establishdesign conditions to verify performance. To overcomethis, the PTC specifiesthat the measuredflue gas outlet temperaturemust be correctedfor differencesfrom design inlet air temperature,design inlet flue gas temperature,design X-ratio, and designflue gasrate. Oncethesecorrections are determined, the “‘totally corrected flue gasoutlet temperature”can be calculatedand comparedwith the design outlet temperature. Calculation of the first two temperaturecorrectionsis explicitly defined by the ASME code. The determinationof the temperaturecorrectionsfor differences from design X-ratio and design flue gas flow are left to the supplier or purchaserto determine. Normally the manufacturer will supply the purchaserwith designperformancecurves or equations,but not with those to calculatethe temperaturecorrectionsspecified by the PTC. This paper provides a method for evaluating the remaining two temperaturecorrectionsusing the performance curves. Should the manufactureralsoprovide proceduresfor calculating the specified PTC temperaturecorrections,the results can be checkedusing the proposedprocedure. This was done for the Mill&en air heaterperformancetesting with good agreementfound between the two methods. As part of the Mill&en air heatertest program, the uncertainty in the ASME PTC 4.3 equation for calculating the TCFGOT was determined. Becauseof the non-linearity of the final equation, numerical approximationswete usedto determinethe differentials neededfor the propagation procedure. For the examplepresented,the estimateduncertainty is 4.75 “F for the TCFGOT at a 95% confidence level. This showsthat the uncertaintyin the codeprocedureis relatively small, about 2% of the design outlet temperatureas expressed degreesFahrenheit. in References I. Air Heaters-Supplement to Performance Test Codefor SteamGenerating Units, Pl-C 4.1; ASME/ANSI PTC 4.3 - 1974;Reaffirmed 1991,The American Society of Mechanical Engineers,New York, 1968. 2. McCoy, D. C.; Bilonick, R. A.; “Milliken Station Heat Pipe Air Heater Performance Uncertainty Analysis”, Report preparedby CONSOL Inc., R&D for New York State Electric & Gas Corporation, Binghamton, New York, June 1995. 3. Maskew, J. T.; ‘Milliken Station Heat Pipe Air Heater PerformanceUncertainty Analysis of Totallv Corrected Gas TemneratureLeavine the Air Heater”, Report preparedby CONSOL Inc., R&D for New York StateElectric & GasCorporation, Binghsmton, New York, April 1996. 4. James,C. A.; Taylor, R. F.; Hedge, B. K.; ‘The Application of Uncertainty Analysis to Cross-Flow Heat ExchangerPerformancePredictions”;Heut Transfer Engineering; 16, 4; pp 50-61; 1995. 5. McCoy, D. C.; ‘Heat Pipe Performance-- Final Report”; Final report preparedby CONSOL Inc., R&D for New York StateElectric & GasCorporation, Binghamton, New York, August 1998.
  • 12. SEP 09 ‘98 04:41P,, CCNSOL R&D CIBRFlRY APPENDXX Estimation of Uncertainty in the Individual Parameters Required for the Evaluation of the ASMlE PTC 4.3 “Totally Corrected Flue Gas Outlet Temperature” The uncertainty analysesdiscussedin this paper are for the American Society ofMechanical Engineering (ASME) proceduresfor testing the performanceof air heatersand, specifically, for the equation to predict the “totally correctedflue gasoutlet temperature”(TCFGOT). The estimatesof bias errors and random errors for the individual parameters were derived for the equipment and methodology used in obtaining the datarequired for a test program. This test program focused on evaluating the performanceof an air heaterrecently installed in the Milliken Station of New York StateEleotric & Gas. The methods followed in deriving the estimatesof the uncertainty of the individual parametersarepublished by ASME.’ Comprehensive discussion of all of the calculationsis published e1sewhere.l Milliken Station Unit 2 is a 150 MW, pulverized coal-fired boiler with twin, parallel air heaters. Each air heater heats both primary and secondaryair for half of the unit in separatesectionswith the flue gas mixed before and after the tir heater. The uncertaintyanalysispresentedbelow contains the results for both the primary and secondarysidesof the air heater. The design of the air heater was such.that all of the air leakageoccurred at sootblowerports. Air leaked from outside of the air heaterinto the flue gasheating the primary air. Leakageinto the side heating the secondaryair was insignificant and was ignored in the following evaluation. Test Procedure The general test procedure followed in the determinationof the TCFGOT was the ASME PerformanceTest Code (PTC) PTC 4.1’ and PTC 4.34. Individual parametersrequired by the PTC 4.3 were measuredfollowing generally acceptedmethods,normally U. S. Environmental Protection Agency (EPA) methods. For gas velocity, EPA Method 2’ was used along with EPA Method 16. The gas composition was determinedgenerally following the proceduresof EPA Method 3?. Since the ASME procedurebasesthe flue gas and air flow rates on the coal feedrate andgasproperties, rather than on the measuredgasand air velocities, the derivation of the errors of the individual parametersis complex. However, using the coal feedrate,from calibrated feeders,and gas compositions as a basecreatesa commonbond betweenthe air and flue gas flows. This createsa consistentbasis for the calculations. Background Error propagation is calculatedby Taylor Seriesexpansionof the resultant function. In general, if r =f(xa x2,. ., x, . . ., xJ, then the error statistics,S,,,, for either the bias error or the random error is calculated by where
  • 13. P .14/20 SEP 09 ‘98 04:42PM CONSOL R&D LIBRFIRY af -al = Partial derivatives of j with respectto Y, (or xi), and ax,’ c%cj cr,,, oxj = Error with respectto xi (or xj). when the parametersare independent,only the i=j terms are significant. For many of the parametersexamined in this work, the parameters were a independentand all of the terms in Equation Al were evaluated. Note that using a single thermocoupleto measureall of the temperaturesin the traverseof a plane in a duct createsa dependency betweenthese measurements. The bias error associated with tbe thermocoupleis the samefor all points. Thus, it is dependent. To illustrate the calculation complexity for the estimateof the errors of the individual paran~eters, step-by-stepcalculation of the estimateof the uncertainty for a weight a averagetemperatureof a gas is shown below. The averageis basedon a traverseof an inlet (or outlet) duct. For the details of the estimation of the uncertaintiesof other parameters,refer to the final Milliken project report8 Only the errors and uncertainty for theseother evaluations are presentedhere. Temperature Traverse Uncertainty Calculation The weight averagetemperatureof a gas flowing in a duct is basedon a flow weighted average of the temperaturesobtained from a standardtraverseof the duct. That is, t AiwT, T=% = j=l (a i A,wi ill where Ai = Cross sectional areafor point i, ft2, i = Traversepoint number, q = Temperahuemeasuredat point i, ’ R, vi = Velocity in areaAi determinedat point i, fps, and pi = Fluid density in areaA;, lb / f?. The fluid velocity is determinedby a Pitot tube measurement.The gas is assumedto behave ideally and the velocity is constant over the entire cross-sectional A,. The velocity is area calculated by: = .1 2 Mi.T, vi cl: 1 P,,.Mi 85.49 I (A31
  • 14. P .15/20 SW 09 ‘98 04:42PM CONSOL R&D LIBRRRY CP, - Pitot tube flow coeffkzicnL dimensionless, 0, - Vclacity head in area i, inches W. C., P,, = Static pressure in area i, inches Hg. absolute, and M, = GAS mole weight in CWS i. Ib / lb - mol. Similarly, the gas density is calculated: 0.04578. Mi .I’,; Pi = (A41 T, Substituting the formulas for vi (Equation A3) andp, (Equation A4) into Equation A2 and simplifying yields: Equation A5 is partially differentiated with respectto A, CP, dP,, M,, PI,, and T,, and the resulting partial summed asindicated in Equation Al. Equation A5 producessix setsof partial differential equations. If the denominatorof Equation A5 is set equal to Sum1and the numerator equal to Sum2 to simplify the resulting equations,thesepartial differentials are: ,.(~‘~.~i)‘.sum2 (A6) Gg c~.(~..M,.P,i.7;)t.suml-cP. -= 34 SumI’ ~.(~.~,.~i.T)f.Suml-A, , Sum2 @‘I dr,,= xsuml-c<.A,. sum2 e, (A@ -= aw 2.Suml’
  • 15. P x/20 t&,:&W, CONSOL R&D LIBRARY SEP 09 ‘98 C4. A;. ~Suml-Ce.4, .Sum2 -=Lg a a&f; 2~SurnP ,&ml-Cf.A,, (AlO) ae, = 2.sum12 Theseindividual differentials aremultiplied and summedas shown by Equation Al. The bias errors and random errors, a,, for this calculation are listed in Table A-I. Table A-I also lists the source of the bias and random errors for eachof the parameters.As previously mentioned, many of the crossproduct terms must be included in the bias calculationssince the sameequipment was usedto measurea parameter. The inclusion of crossproducts,i@ terms, addssignificantly to the number of terms that must be evaluated. If there were no crossproduct terms, a duct traverseof 12 samplepoints in Equation A5 would require 72 terms. With the crossproducts, this increasesto 864 terms. In the caseof the bias error, the crossproduct telms accountfor essentially all of the error in determining the averagetemperature. Since the bias errors are not reducedby taking multiple measurements, bias errors accountfor most of the uncertainty in the the final averagetemperatureas shown in Table A-II. In the caseof the secondaxy inlet, air which has only four traversepoints, the bias error is 90% of the uncertainty in the dctetination of the averagetemperature. Table A-II summarizesthe uncertainty estimatesfor the Milliken air heater for the averageai* and gas temperatures. The bias error is responsiblefor the majority of the uncertainty evenwith only a four-point traverse. Repetitive measurements to reducethe random error. tend Table A-III shows the efTorsfor the other parametersrequired to evaluatethe TCFGOT. The uncertainty is shown as a percent of the final calculatedvalue. All uncertainty estimatesare at the 95% confidence limit.
  • 16. P. 17/20 SEi= 09 ‘98 04:43PM CONSOL R&D LIBRARY Table A-I Summary of Bias Errors and Precision Indices for Uncertainty Calculations RandomError Palsmeter Bias Error lOne Stand.Dev.) CommentsI Basis llmension Width 0.5” (0.042”) 0.5” (0.042”) Assumed Length 0.5” (0.042”) 0.5” (0.042”) Assumed Yemperature l%of”F % % of OF Bias - Typical for Type K Reading Reading Thermocouples, Random - ASME PTC 1 Barometric 0.04” Hg 0.04” Hg Calibration of Aneroid BarometerScale Static 0.05” WC 0.05” WC Water Manometer Scale Vel. Head, AP 2 % of Avg. 0.00005” WC ShortridgeAir Data Reading Multimeter, Model ADM-870 Bias - Instrument Design Spec. Random - % Design Spec. ‘itot Factor, CP 0.01 0.0 Calibration Accuracy :oal Analysis Moisture 3.9 % rel. LO.20 O.O12*MQ Bias - AssumedSameas Ash + (2 * 1.414) Random -ASTM Repeatability C 3.9 % rel. Q.&Q Bias - AssumedSameas Ash (2 * 1.414) Random - ASTM Repeatability I-l 3.9 % rel. (Q&J Bias -Assumed Sameas Ash (2 * 1.414) Random - ASTM Repeatability N 3.9 % rel. 10.11) Bias -Assumed Sameas Ash (2 * 1.414) Random - ASTM Repeatability S 1.9 % rel. (0.06 + O.O3S*S Biss - From Washability Data (2 * 1.414) Random - ASTIM Repeatability Ash 3.9 % rel. 10.07+ 0.02*&h Bias -From Washability Data (2 * 1.414) Random - ASTM Repeatability
  • 17. P. m/20 SEP 09 ‘98 04:43PM CONSOL R&D LIBRFlRY Table A-I Summary of Bias Errors and Precision Indices for Uncertainty Calculations Random Error Parameter Bias Error (One Stand.Dew.1 Comments/ Basis Coal Analysis (Cont.) CinAsh 25 % rel. 10 %rel. Bias - Experiencewith Milliken Unit 2 Loss On Ignition Data Random - Assumed Coal Rate 5 % rel. 0.25 %rel Bias - Assumed Random - Typical, PTC 4.1 Gas Analysis 02 0.05 % abs. 0.05 % abs. Bias - Calibration Gas Spec Random - Low 0, Instrument Design Spec. CO 20 mm 10Ppm Same co, 0.1 % abs. 3 % rel. OrsatMeter Bias - Burette ScaleDivision Random -Experience, PTC 4.1 Air Moisture 10 % rel. 20 % rel. Bias - Error of 1 “F in Reading Wet Bulb Temperature(WBT) Random - Error of 2 “F in Reading WBT Molecular Wt. Flue Gas 0.05 0.07 CombinedUncertainty of Analysis for Ash and Flue Gas Air 0.025 0.05 Combined Uncertainty for Humidity
  • 18. SEP 09 ‘98 04:43PM CONSOL R&D LIBRQRY P. 19/2!2 Table A-II Uncertainty Estimates for Average Duct Temperatures Based upon Multi-Point Traverses No. of Traverse Bias Error, Random Location Points %“F Jrror. %“F Uncertaintv. %“F Primary Air Inlet 12 1.00 0.15 1.05 Primary Air Outlet 20 1.00 0.11 1.03 SecondaryAir Inlet 4 1.00 0.25 1.11 SecondaryAir Outlet 24 1.00 0.11 1.03 Flue Gas Inlet 20 1.oo 0.12 1.03 Flue Gas Outlet 24 1.oo 0.14 1.04 Table A-III Uncertainty Estimates for Other Parameters Required to Evaluate TCFGOT Location Bias Error. % RandomError. o/n Uncertaintv. % Primary Air Flow, Inlet 3.31 2.93 6.72 Primary Air Flow, Outlet 2.61 2.08 4.92 SecondaryAir Flow, 5.02 0.68 5.20 Inlet/Outlet Flue Gas Flow, Inlet 6.28 0.75 6.46 Flue Gas Flow, Outlet 6.25 0.46 6.32 Flow Split Between Air Beaters 0.43 0.49 0.94 Air Leak @ 6.87% Leak 0.85 12.60 25.21 Conclusions Two conclusions can be reachedafter examining theseresults. The estimatesofthe uncertainties shown in Table A-II and A-III are valid for all air heaters,when a valid duct traversecari be
  • 19. SEP 09 ‘98 04:44PM CONSOL R&D LIBRARY P .20/20 performed. The uncertainty for a duct traversewith as few as4 points is still dominated by the bias errors. Secondly, since the dornimtnt errorsin the raw data are expressed percentages,the as results shown in Tables A-II and A-HI, and in the main body of this paper, are independentof the absolute values of the parameters. Thus, they apply to any air heater. Appendix Referencea 1. Measurement Uncertain@Part 1. Instrumentsand Apparatus, ANSJJASME PTC 19.1-1985, The American Society ofMechanical Engincera,New York, 1986. 2. McCoy, D. C. and Bilonick, R. A.; ‘Milliken Station Heat Pipe Air Heater Performance Uncertainty Analysis”; Report preparedby CONSOL Inc., R&D for New York State Electric & Gas Corporation, Binghamton, New York, June 1995. 3. Steam Generating Units, AShEJANSI PTC 4.1 - 1974; Reaffumed 1991,The American Society of Mechanical Engineers,New York, 1970. 4. Air Heaters, Supplementto Performance Test Codefor SteamGenerating Units, PTC 4.1, ASM&A.NSI PTC 4.3 - 1974; Reaffirmed 1991, The American Society of Mechanical Engineers,New York, 1968. 5. ERA Method 2, Determination of Stack Gas Velocityand VolumetricFlow Rate (Tjqe S Pitot Tube), U. S. Environmental Protection Agency, Code of FederalRegulations 40, Washington, D. C., 1996. 6. EPA Method 1, Sampleand Velociy Traverses& Stationary Sources,U. S. Environmental Protection Agency, Code of FederalRegulations40, Washington, D. C., 1996. 7. EPA Method 3, GasAnalysisfor CO, 0, ExcessAir, and Dry Molecular Weight, W. S. Environmental Protection Agency, Code of FederalRegulations 40, Washington, D. C., 1996. 8. McCoy, D. C.; ‘Xeat Pipe Performance-Final Report”, Final report preparedby CONSOL Inc., R&D for New York StateElectric & GasCorporation, Binghmton, New York, August 1998.