Downloaded 536 times

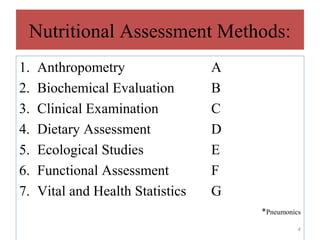
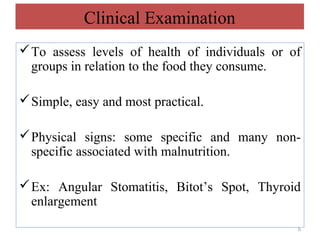
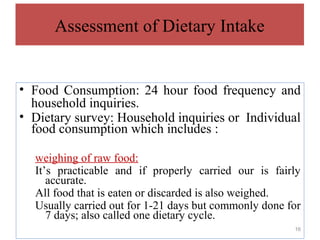
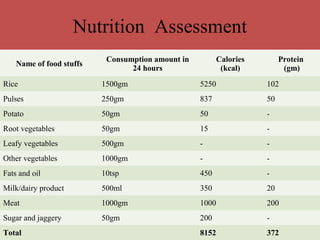


This document discusses various methods for nutritional assessment, including anthropometric, biochemical, clinical, dietary, functional, and anthropometric assessments. It provides details on each method, including what they measure and their advantages and limitations. The key methods covered are anthropometry (measuring height, weight, skin folds), biochemical tests of nutrients, clinical exams for signs of deficiencies, dietary assessments like 24-hour recalls, and functional tests of physiological processes impacted by nutrition.


