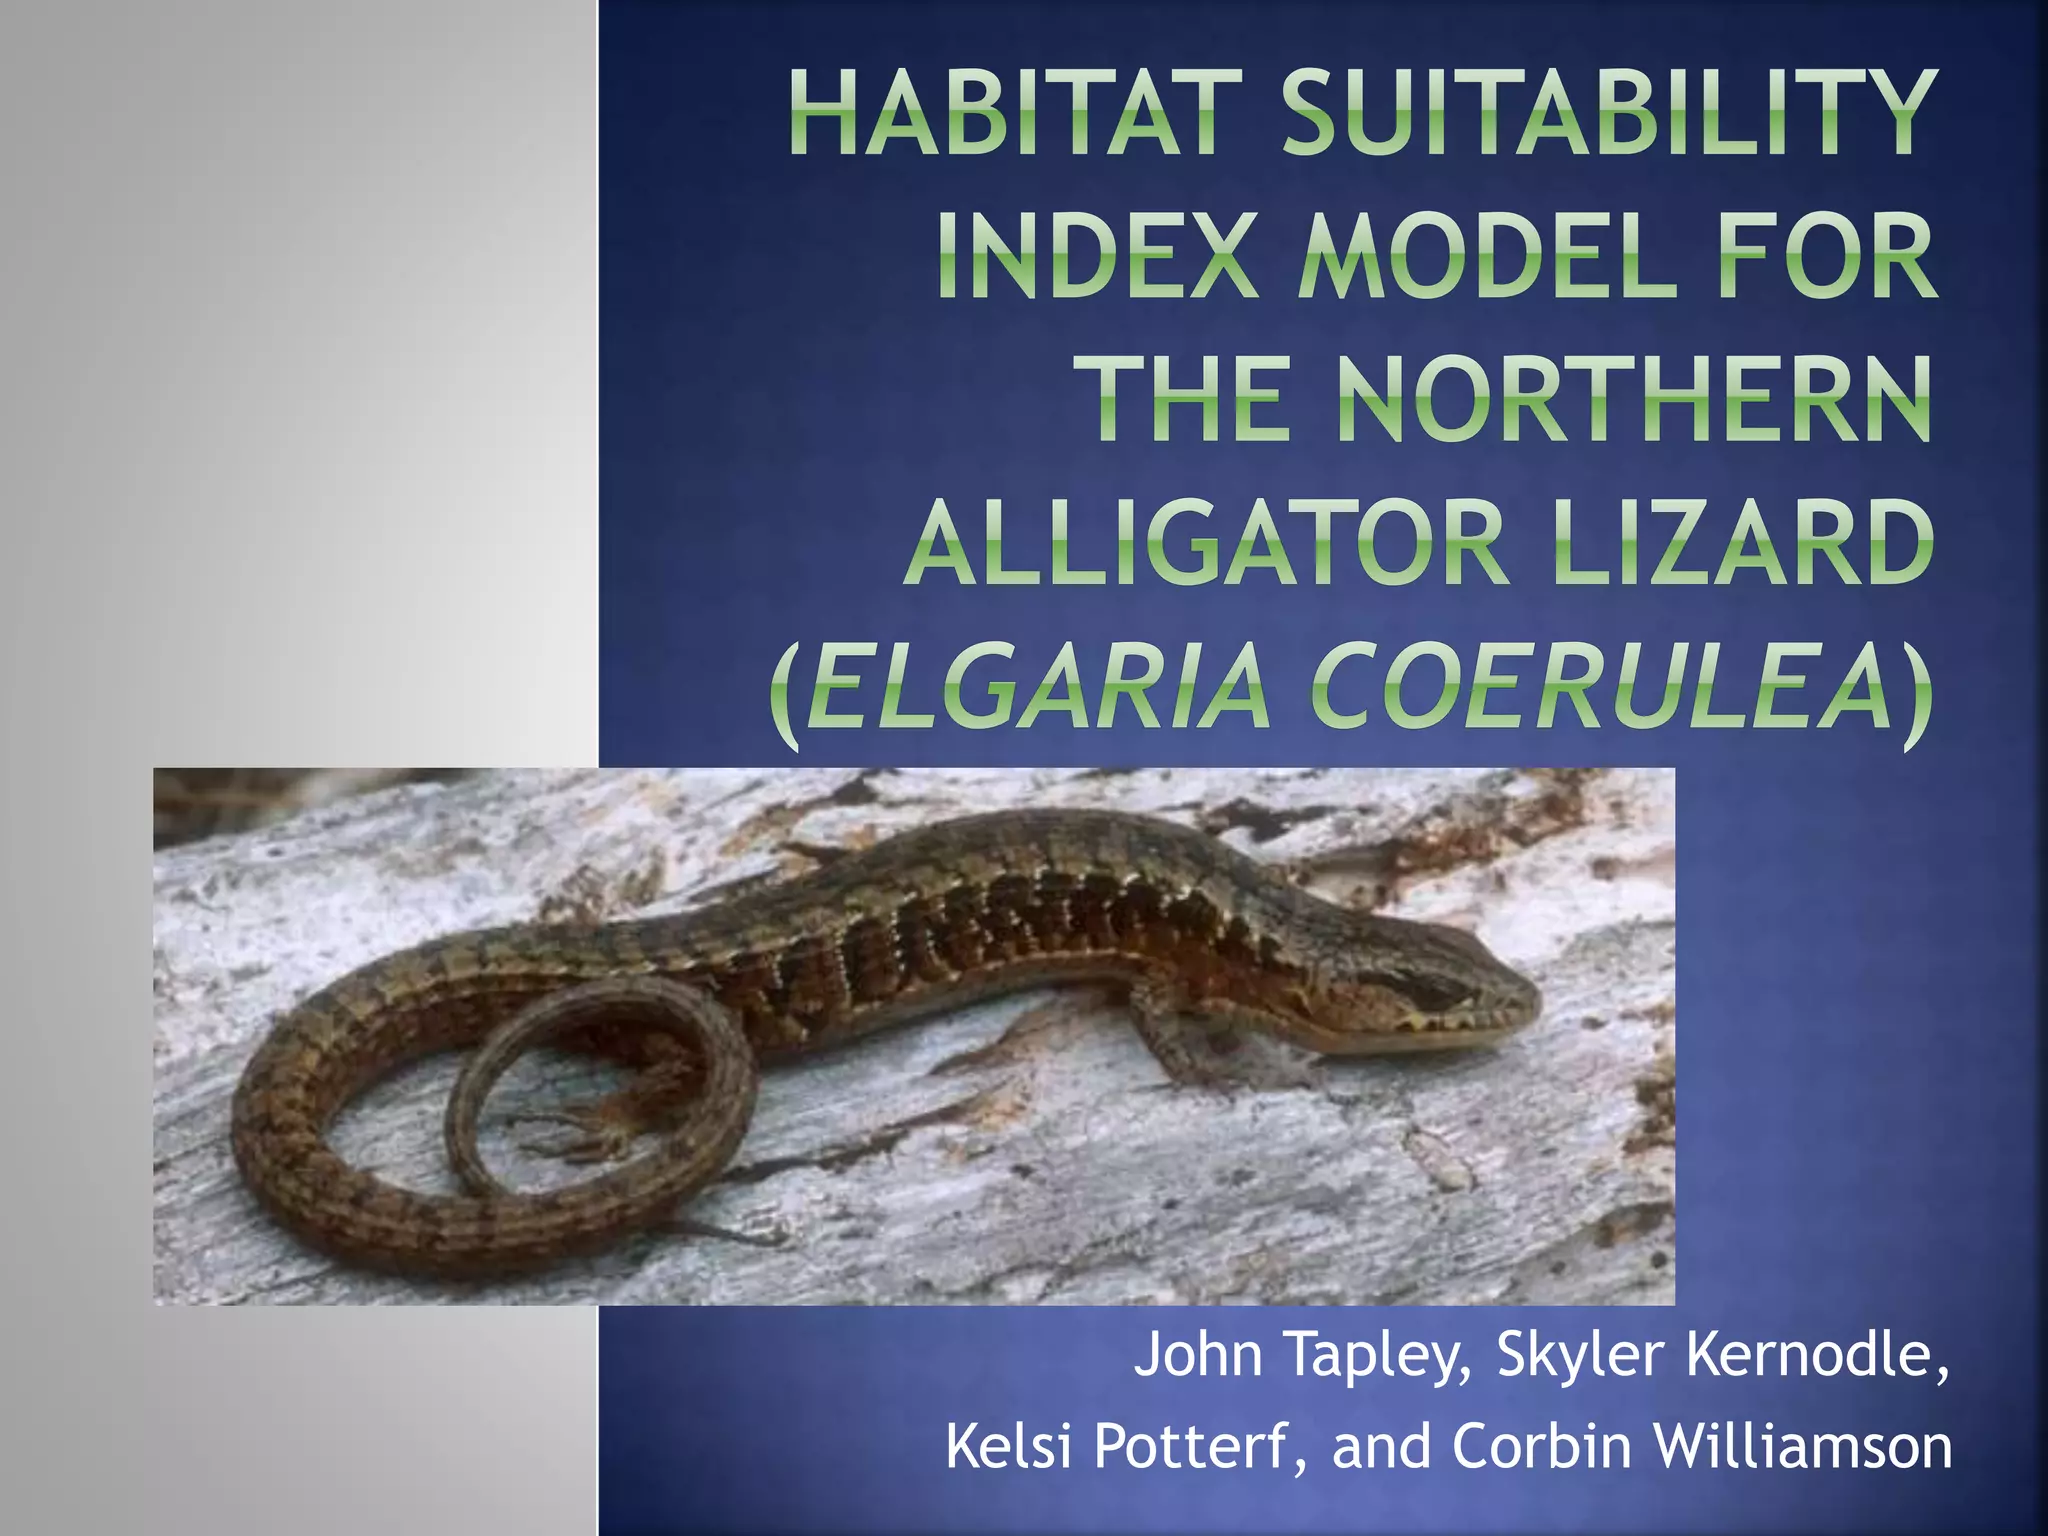
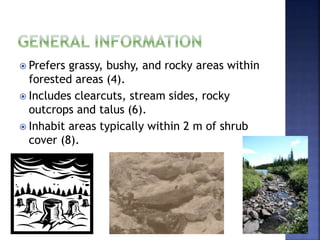
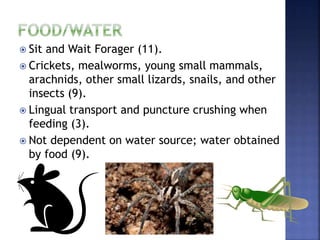
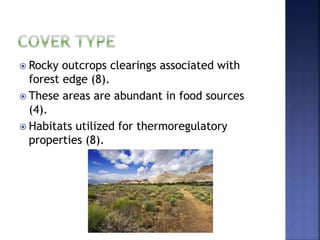
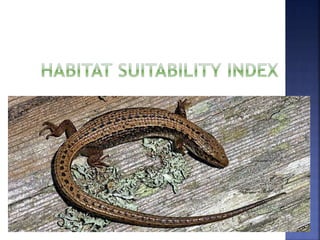
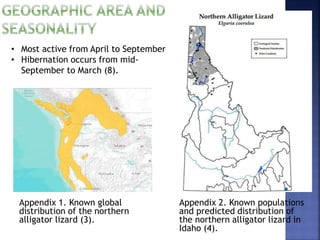
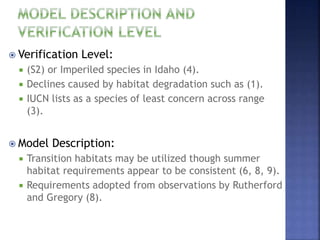
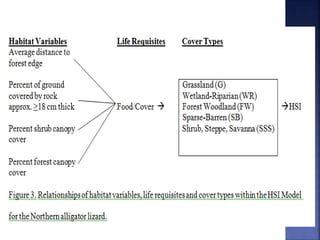
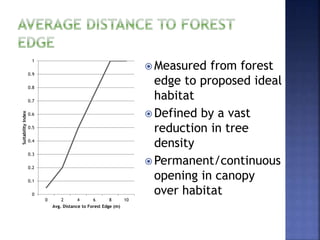
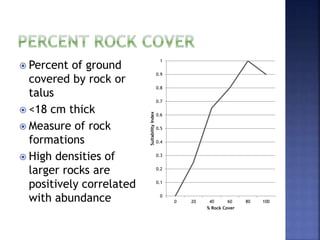
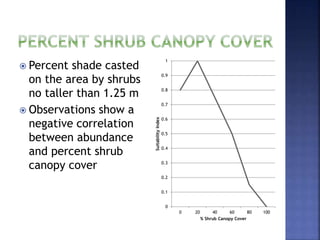
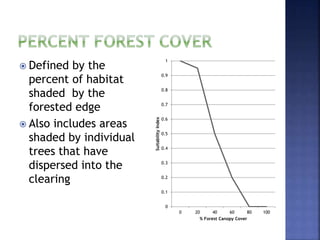
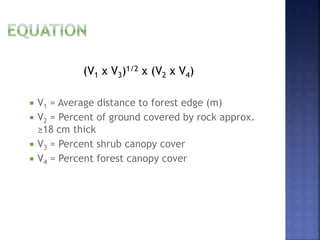
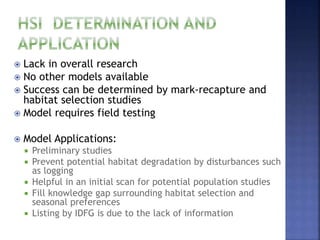
John Tapley, Skyler Kernodle,
Kelsi Potterf, and Corbin Williamson
 Habitat Use Information
 General Information
 Food/Water
 Interspersion
 Cover Type
 Habitat Suitability Index
 Geographic Area and Seasonality
 Model Description and Verification Level
 SI Graphs and Variable Definitions
 Equation
 Determination and Application
 Prefers grassy, bushy, and rocky areas within
forested areas (4).
 Includes clearcuts, stream sides, rocky
outcrops and talus (6).
 Inhabit areas typically within 2 m of shrub
cover (8).
 Sit and Wait Forager (11).
 Crickets, mealworms, young small mammals,
arachnids, other small lizards, snails, and other
insects (9).
 Lingual transport and puncture crushing when
feeding (3).
 Not dependent on water source; water obtained
by food (9).
 Low density populations (8, 11,12).
 When ideal habitats are scarce, individuals
must move across the landscape to meet
their requirements (2).
 Migration from hibernation dens to summer
habitat (9).
 Dispersal patterns of young are largely
unknown (8).
 Adults exhibit high site fidelity (8).
 Idaho populations occur on the periphery of
the species range (4).
 Rocky outcrops clearings associated with
forest edge (8).
 These areas are abundant in food sources
(4).
 Habitats utilized for thermoregulatory
properties (8).
Appendix 1. Known global
distribution of the northern
alligator lizard (3).
Appendix 2. Known populations
and predicted distribution of
the northern alligator lizard in
Idaho (4).
• Most active from April to September
• Hibernation occurs from mid-
September to March (8).
 Verification Level:
 (S2) or Imperiled species in Idaho (4).
 Declines caused by habitat degradation such as (1).
 IUCN lists as a species of least concern across range
(3).
 Model Description:
 Transition habitats may be utilized though summer
habitat requirements appear to be consistent (6, 8, 9).
 Requirements adopted from observations by Rutherford
and Gregory (8).
0
0.1
0.2
0.3
0.4
0.5
0.6
0.7
0.8
0.9
1
0 2 4 6 8 10
SuitabilityIndex
Avg. Distance to Forest Edge (m)
 Measured from forest
edge to proposed ideal
habitat
 Defined by a vast
reduction in tree
density
 Permanent/continuous
opening in canopy
over habitat
0
0.1
0.2
0.3
0.4
0.5
0.6
0.7
0.8
0.9
1
0 20 40 60 80 100
SuitabilityIndex
% Rock Cover
 Percent of ground
covered by rock or
talus
 <18 cm thick
 Measure of rock
formations
 High densities of
larger rocks are
positively correlated
with abundance
 Percent shade casted
on the area by shrubs
no taller than 1.25 m
 Observations show a
negative correlation
between abundance
and percent shrub
canopy cover
0
0.1
0.2
0.3
0.4
0.5
0.6
0.7
0.8
0.9
1
0 20 40 60 80 100
SuitabilityIndex
% Shrub Canopy Cover
 Defined by the
percent of habitat
shaded by the
forested edge
 Also includes areas
shaded by individual
trees that have
dispersed into the
clearing
0
0.1
0.2
0.3
0.4
0.5
0.6
0.7
0.8
0.9
1
0 20 40 60 80 100
SuitabilityIndex
% Forest Canopy Cover
(V1 x V3)1/2 x (V2 x V4)
 V1 = Average distance to forest edge (m)
 V2 = Percent of ground covered by rock approx.
≥18 cm thick
 V3 = Percent shrub canopy cover
 V4 = Percent forest canopy cover
 Lack in overall research
 No other models available
 Success can be determined by mark-recapture and
habitat selection studies
 Model requires field testing
 Model Applications:
 Preliminary studies
 Prevent potential habitat degradation by disturbances such
as logging
 Helpful in an initial scan for potential population studies
 Fill knowledge gap surrounding habitat selection and
seasonal preferences
 Listing by IDFG is due to the lack of information
Fitch, H. S. 1938. A systematic account of the alligator lizards (gerrhonotus)
in the western United States and lower California. American Midland
Naturalist 20:381-424. (12)
Gibbon, W., D. E. Scott, T. J. Ryan, K. A. Buhlmann, T. D. Tuberville, B. S.
Metts, J. L. Greene, T. Mills, Y. Leiden, S. Poppy, and C. T. Winne.
2000. The global decline of reptiles, déjà vu amphibians.
BioScience 50:653-666. (1)
Greene, C. M., and J. A. Stamps. 2001. Habitat selection at low population
densities. Ecology 82:2091-2100. (2)
Hammerson, G. A. 2007. Elgaria coerulea. In: IUCN 2013. IUCN Red List of
Threatened Species. Version 2013.2. <www.iucnredlist.org>.
Accessed on 19 Feb 2014. (3)
Idaho Fish and Wildlife Information System [IFWIS]. 2005. Northern alligator
lizard. Idaho Department of Fish and Wildlife. Boise, Idaho, USA.
(4)
Kernodle, S. 2013. Personal observations. University of Idaho. (5)
Lais, P. M. 1976. Gerrhonotus coeruleus. Catalogue of American Amphibians
and Reptiles 178:1-4.(6)
McBrayer, L. D. and S. M. Reilly. 2002. Prey processing in lizards: behavioral
variation in sit-and-wait and widely foraging taxa. Canadian
Journal of Zoology, 80:882-892. (7)
Rutherford, P. L., and P. T. Gregory. 2003. Habitat use and movement patterns of
northern alligator lizards (Elgaria coerulea) and western skinks (Eumeces
skiltonianus) in southeastern British Columbia. Journal of Herpetology
37:98-106. (8)
Stebbins, R. C. 2003. A Field Guide to Western Reptiles and Amphibians. Third
Edition. Houghton Mifflin Company, Boston, Massachusetts,USA. (9)
Vitt, L. J. 1973. Reproductive biology of the anguid lizard Gerrhonotus coeruleus
principis. Herpetologica 29:176-184. (10)
Vitt, L. J. and H. J. Price. 1982. Ecological and evolutionary determinants of relative
clutch mass in lizards. Herpetologica, 38:237-255. (11)
 Slide 1:
http://www.wildherps.com/species/E.coerulea.
html
 Slide 3:
http://www.jeffpippen.com/herps/nalligatorliza
rd.htm
 Slide 8:
http://www.californiaherps.com/lizards/lizardsp
ics.html
 Slide 12:
http://www.californiaherps.com/noncal/northw
est/nwlizards/images/emscincicaudaccor053.jpg
Northern Alligator Lizard HSI Model

Northern Alligator Lizard HSI Model

  • 1.
    John Tapley, SkylerKernodle, Kelsi Potterf, and Corbin Williamson
  • 2.
     Habitat UseInformation  General Information  Food/Water  Interspersion  Cover Type  Habitat Suitability Index  Geographic Area and Seasonality  Model Description and Verification Level  SI Graphs and Variable Definitions  Equation  Determination and Application
  • 4.
     Prefers grassy,bushy, and rocky areas within forested areas (4).  Includes clearcuts, stream sides, rocky outcrops and talus (6).  Inhabit areas typically within 2 m of shrub cover (8).
  • 5.
     Sit andWait Forager (11).  Crickets, mealworms, young small mammals, arachnids, other small lizards, snails, and other insects (9).  Lingual transport and puncture crushing when feeding (3).  Not dependent on water source; water obtained by food (9).
  • 6.
     Low densitypopulations (8, 11,12).  When ideal habitats are scarce, individuals must move across the landscape to meet their requirements (2).  Migration from hibernation dens to summer habitat (9).  Dispersal patterns of young are largely unknown (8).  Adults exhibit high site fidelity (8).  Idaho populations occur on the periphery of the species range (4).
  • 7.
     Rocky outcropsclearings associated with forest edge (8).  These areas are abundant in food sources (4).  Habitats utilized for thermoregulatory properties (8).
  • 9.
    Appendix 1. Knownglobal distribution of the northern alligator lizard (3). Appendix 2. Known populations and predicted distribution of the northern alligator lizard in Idaho (4). • Most active from April to September • Hibernation occurs from mid- September to March (8).
  • 10.
     Verification Level: (S2) or Imperiled species in Idaho (4).  Declines caused by habitat degradation such as (1).  IUCN lists as a species of least concern across range (3).  Model Description:  Transition habitats may be utilized though summer habitat requirements appear to be consistent (6, 8, 9).  Requirements adopted from observations by Rutherford and Gregory (8).
  • 13.
    0 0.1 0.2 0.3 0.4 0.5 0.6 0.7 0.8 0.9 1 0 2 46 8 10 SuitabilityIndex Avg. Distance to Forest Edge (m)  Measured from forest edge to proposed ideal habitat  Defined by a vast reduction in tree density  Permanent/continuous opening in canopy over habitat
  • 14.
    0 0.1 0.2 0.3 0.4 0.5 0.6 0.7 0.8 0.9 1 0 20 4060 80 100 SuitabilityIndex % Rock Cover  Percent of ground covered by rock or talus  <18 cm thick  Measure of rock formations  High densities of larger rocks are positively correlated with abundance
  • 15.
     Percent shadecasted on the area by shrubs no taller than 1.25 m  Observations show a negative correlation between abundance and percent shrub canopy cover 0 0.1 0.2 0.3 0.4 0.5 0.6 0.7 0.8 0.9 1 0 20 40 60 80 100 SuitabilityIndex % Shrub Canopy Cover
  • 16.
     Defined bythe percent of habitat shaded by the forested edge  Also includes areas shaded by individual trees that have dispersed into the clearing 0 0.1 0.2 0.3 0.4 0.5 0.6 0.7 0.8 0.9 1 0 20 40 60 80 100 SuitabilityIndex % Forest Canopy Cover
  • 17.
    (V1 x V3)1/2x (V2 x V4)  V1 = Average distance to forest edge (m)  V2 = Percent of ground covered by rock approx. ≥18 cm thick  V3 = Percent shrub canopy cover  V4 = Percent forest canopy cover
  • 18.
     Lack inoverall research  No other models available  Success can be determined by mark-recapture and habitat selection studies  Model requires field testing  Model Applications:  Preliminary studies  Prevent potential habitat degradation by disturbances such as logging  Helpful in an initial scan for potential population studies  Fill knowledge gap surrounding habitat selection and seasonal preferences  Listing by IDFG is due to the lack of information
  • 19.
    Fitch, H. S.1938. A systematic account of the alligator lizards (gerrhonotus) in the western United States and lower California. American Midland Naturalist 20:381-424. (12) Gibbon, W., D. E. Scott, T. J. Ryan, K. A. Buhlmann, T. D. Tuberville, B. S. Metts, J. L. Greene, T. Mills, Y. Leiden, S. Poppy, and C. T. Winne. 2000. The global decline of reptiles, déjà vu amphibians. BioScience 50:653-666. (1) Greene, C. M., and J. A. Stamps. 2001. Habitat selection at low population densities. Ecology 82:2091-2100. (2) Hammerson, G. A. 2007. Elgaria coerulea. In: IUCN 2013. IUCN Red List of Threatened Species. Version 2013.2. <www.iucnredlist.org>. Accessed on 19 Feb 2014. (3) Idaho Fish and Wildlife Information System [IFWIS]. 2005. Northern alligator lizard. Idaho Department of Fish and Wildlife. Boise, Idaho, USA. (4) Kernodle, S. 2013. Personal observations. University of Idaho. (5) Lais, P. M. 1976. Gerrhonotus coeruleus. Catalogue of American Amphibians and Reptiles 178:1-4.(6) McBrayer, L. D. and S. M. Reilly. 2002. Prey processing in lizards: behavioral variation in sit-and-wait and widely foraging taxa. Canadian Journal of Zoology, 80:882-892. (7)
  • 20.
    Rutherford, P. L.,and P. T. Gregory. 2003. Habitat use and movement patterns of northern alligator lizards (Elgaria coerulea) and western skinks (Eumeces skiltonianus) in southeastern British Columbia. Journal of Herpetology 37:98-106. (8) Stebbins, R. C. 2003. A Field Guide to Western Reptiles and Amphibians. Third Edition. Houghton Mifflin Company, Boston, Massachusetts,USA. (9) Vitt, L. J. 1973. Reproductive biology of the anguid lizard Gerrhonotus coeruleus principis. Herpetologica 29:176-184. (10) Vitt, L. J. and H. J. Price. 1982. Ecological and evolutionary determinants of relative clutch mass in lizards. Herpetologica, 38:237-255. (11)
  • 21.
     Slide 1: http://www.wildherps.com/species/E.coerulea. html Slide 3: http://www.jeffpippen.com/herps/nalligatorliza rd.htm  Slide 8: http://www.californiaherps.com/lizards/lizardsp ics.html  Slide 12: http://www.californiaherps.com/noncal/northw est/nwlizards/images/emscincicaudaccor053.jpg

Editor's Notes