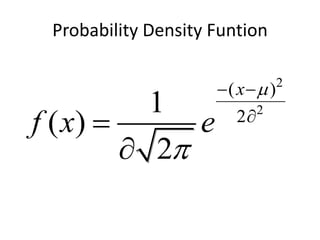
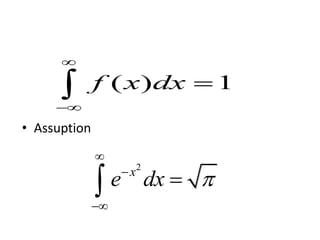
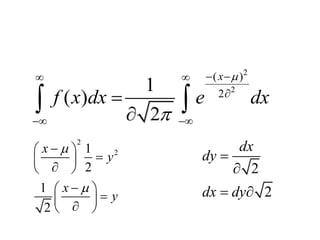
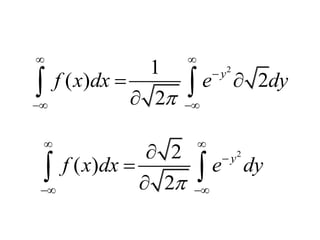
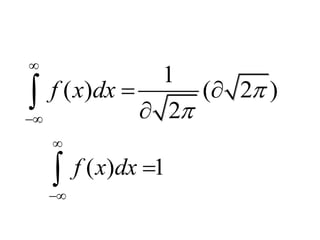
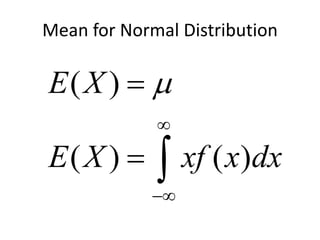
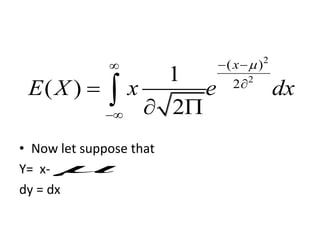
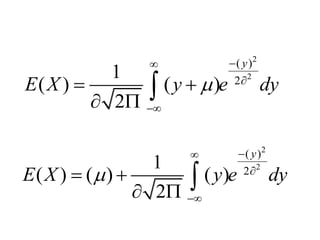
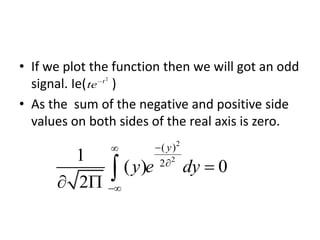
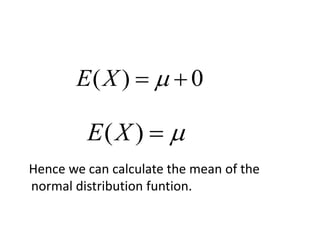
Muhammad Umer
15103122-017
Normal Distribution
1. Probability Density Funtion
2. Mean for normal distribution
function
Probability Density Funtion
2
2
( )
2
1
( )
2
x
f x e


 



• Assuption
( ) 1f x dx



2
x
e dx 




2
2
( )
2
1
( )
2
x
f x dx e dx


  

 

 
2
21
2
1
2
x
y
x
y


 
 
 
 
 
 
2
2
dx
dy
dx dy


 
21
( ) 2
2
y
f x dx e dy

 

 
 
 
22
( )
2
y
f x dx e dy

 

 



 
1
( ) ( 2 )
2
f x dx 



 

( ) 1f x dx



Mean for Normal Distribution
( )
( ) ( )
E X
E X xf x dx




 
• Now let suppose that
Y= x-
dy = dx
2
2
( )
2
1
( )
2
x
E X x e dx
 



 

2
2
( )
2
1
( ) ( )
2
y
E X y e dy



 
  
2
2
( )
2
1
( ) ( ) ( )
2
y
E X y e dy



 
  
• If we plot the function then we will got an odd
signal. Ie( )
• As the sum of the negative and positive side
values on both sides of the real axis is zero.
2
2
( )
2
1
( ) 0
2
y
y e dy




  
2
t
te
Hence we can calculate the mean of the
normal distribution funtion.
( ) 0E X  
( )E X 

Normal ditribution

  • 1.
  • 2.
    Normal Distribution 1. ProbabilityDensity Funtion 2. Mean for normal distribution function
  • 3.
    Probability Density Funtion 2 2 () 2 1 ( ) 2 x f x e       
  • 4.
    • Assuption ( )1f x dx    2 x e dx     
  • 5.
    2 2 ( ) 2 1 ( ) 2 x fx dx e dx            2 21 2 1 2 x y x y               2 2 dx dy dx dy    
  • 6.
    21 ( ) 2 2 y fx dx e dy           22 ( ) 2 y f x dx e dy           
  • 7.
    1 ( ) (2 ) 2 f x dx        ( ) 1f x dx   
  • 8.
    Mean for NormalDistribution ( ) ( ) ( ) E X E X xf x dx      
  • 9.
    • Now letsuppose that Y= x- dy = dx 2 2 ( ) 2 1 ( ) 2 x E X x e dx        
  • 10.
    2 2 ( ) 2 1 ( )( ) 2 y E X y e dy         2 2 ( ) 2 1 ( ) ( ) ( ) 2 y E X y e dy        
  • 11.
    • If weplot the function then we will got an odd signal. Ie( ) • As the sum of the negative and positive side values on both sides of the real axis is zero. 2 2 ( ) 2 1 ( ) 0 2 y y e dy        2 t te
  • 12.
    Hence we cancalculate the mean of the normal distribution funtion. ( ) 0E X   ( )E X 