Download as PDF, PPTX

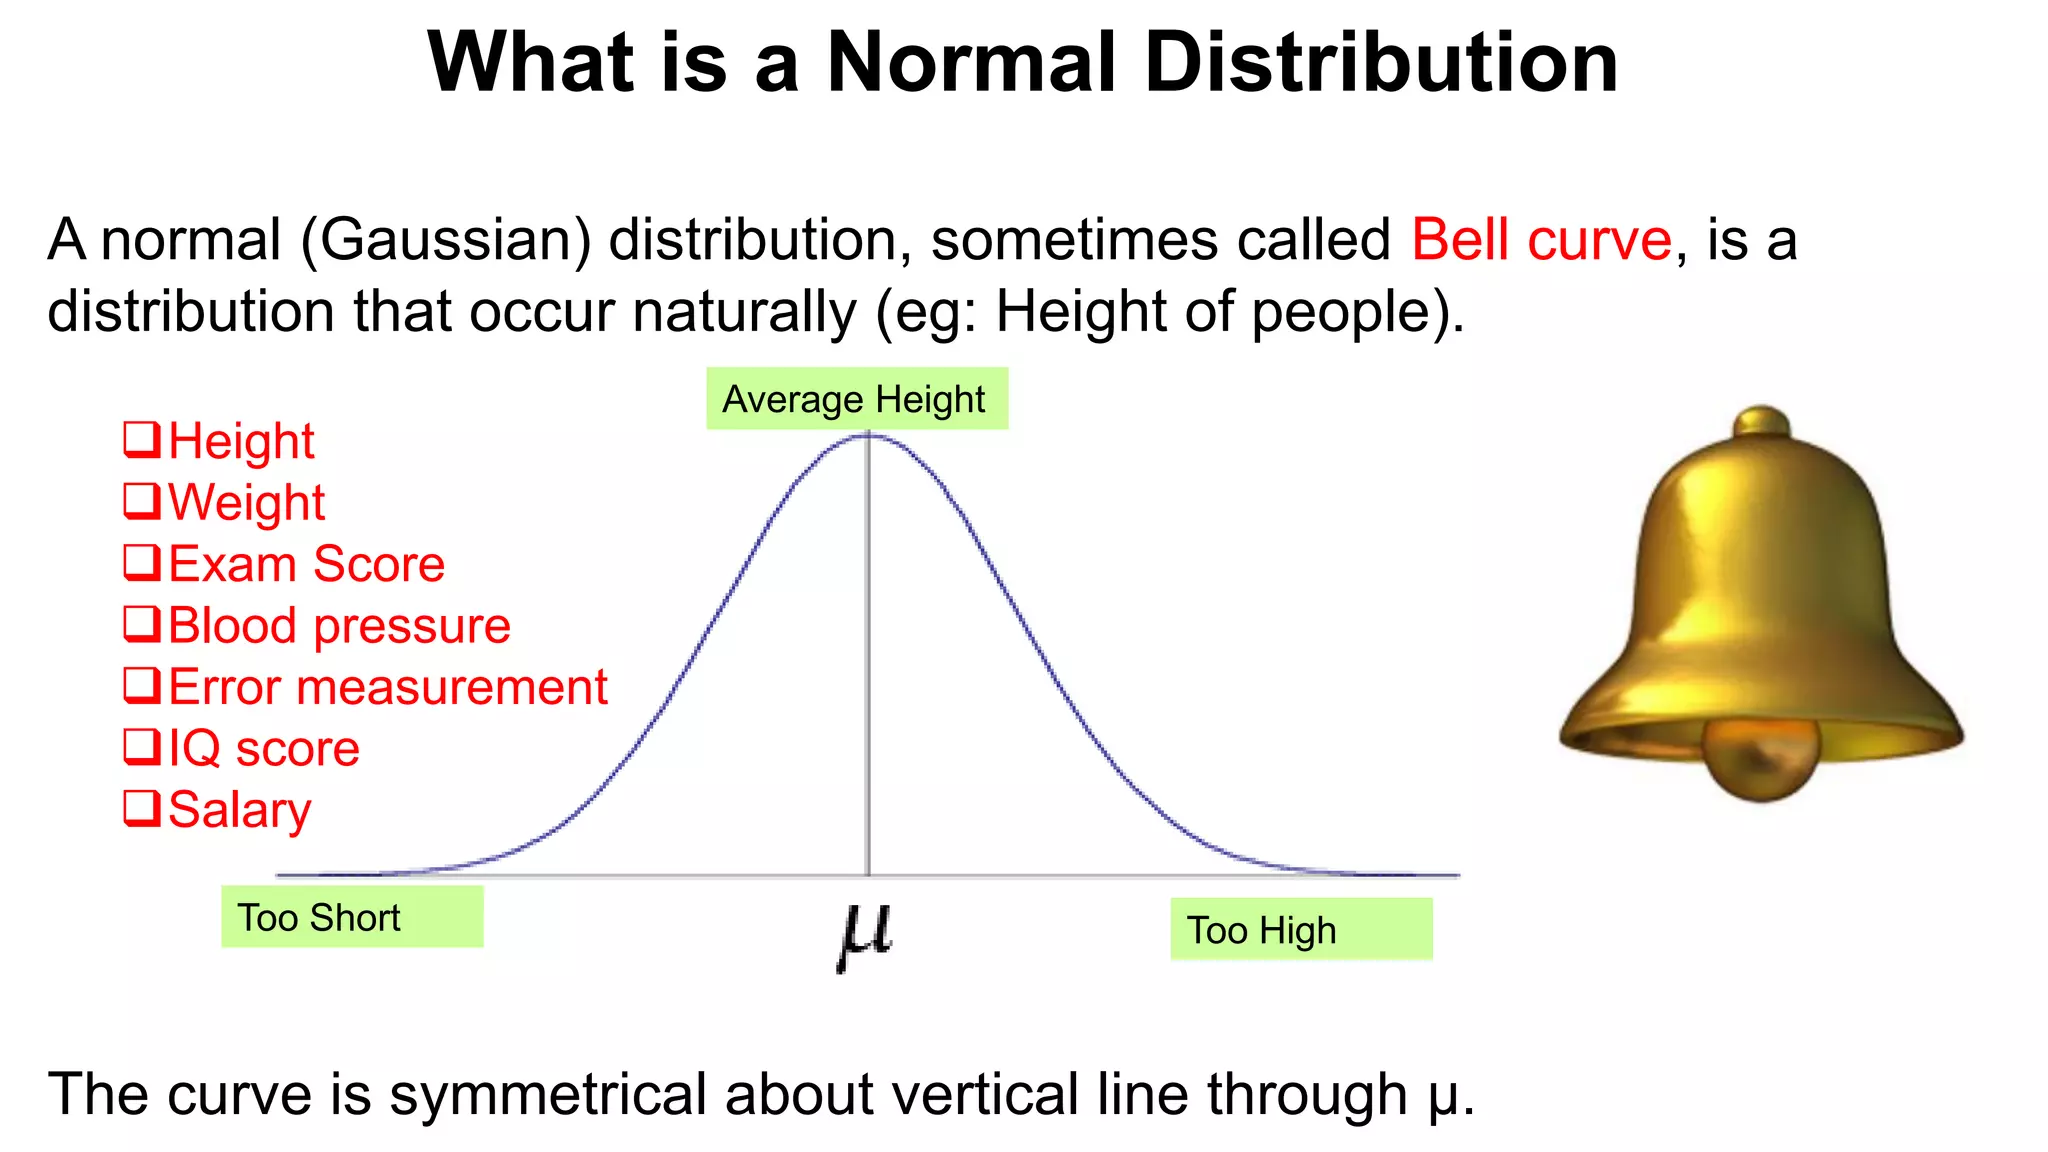


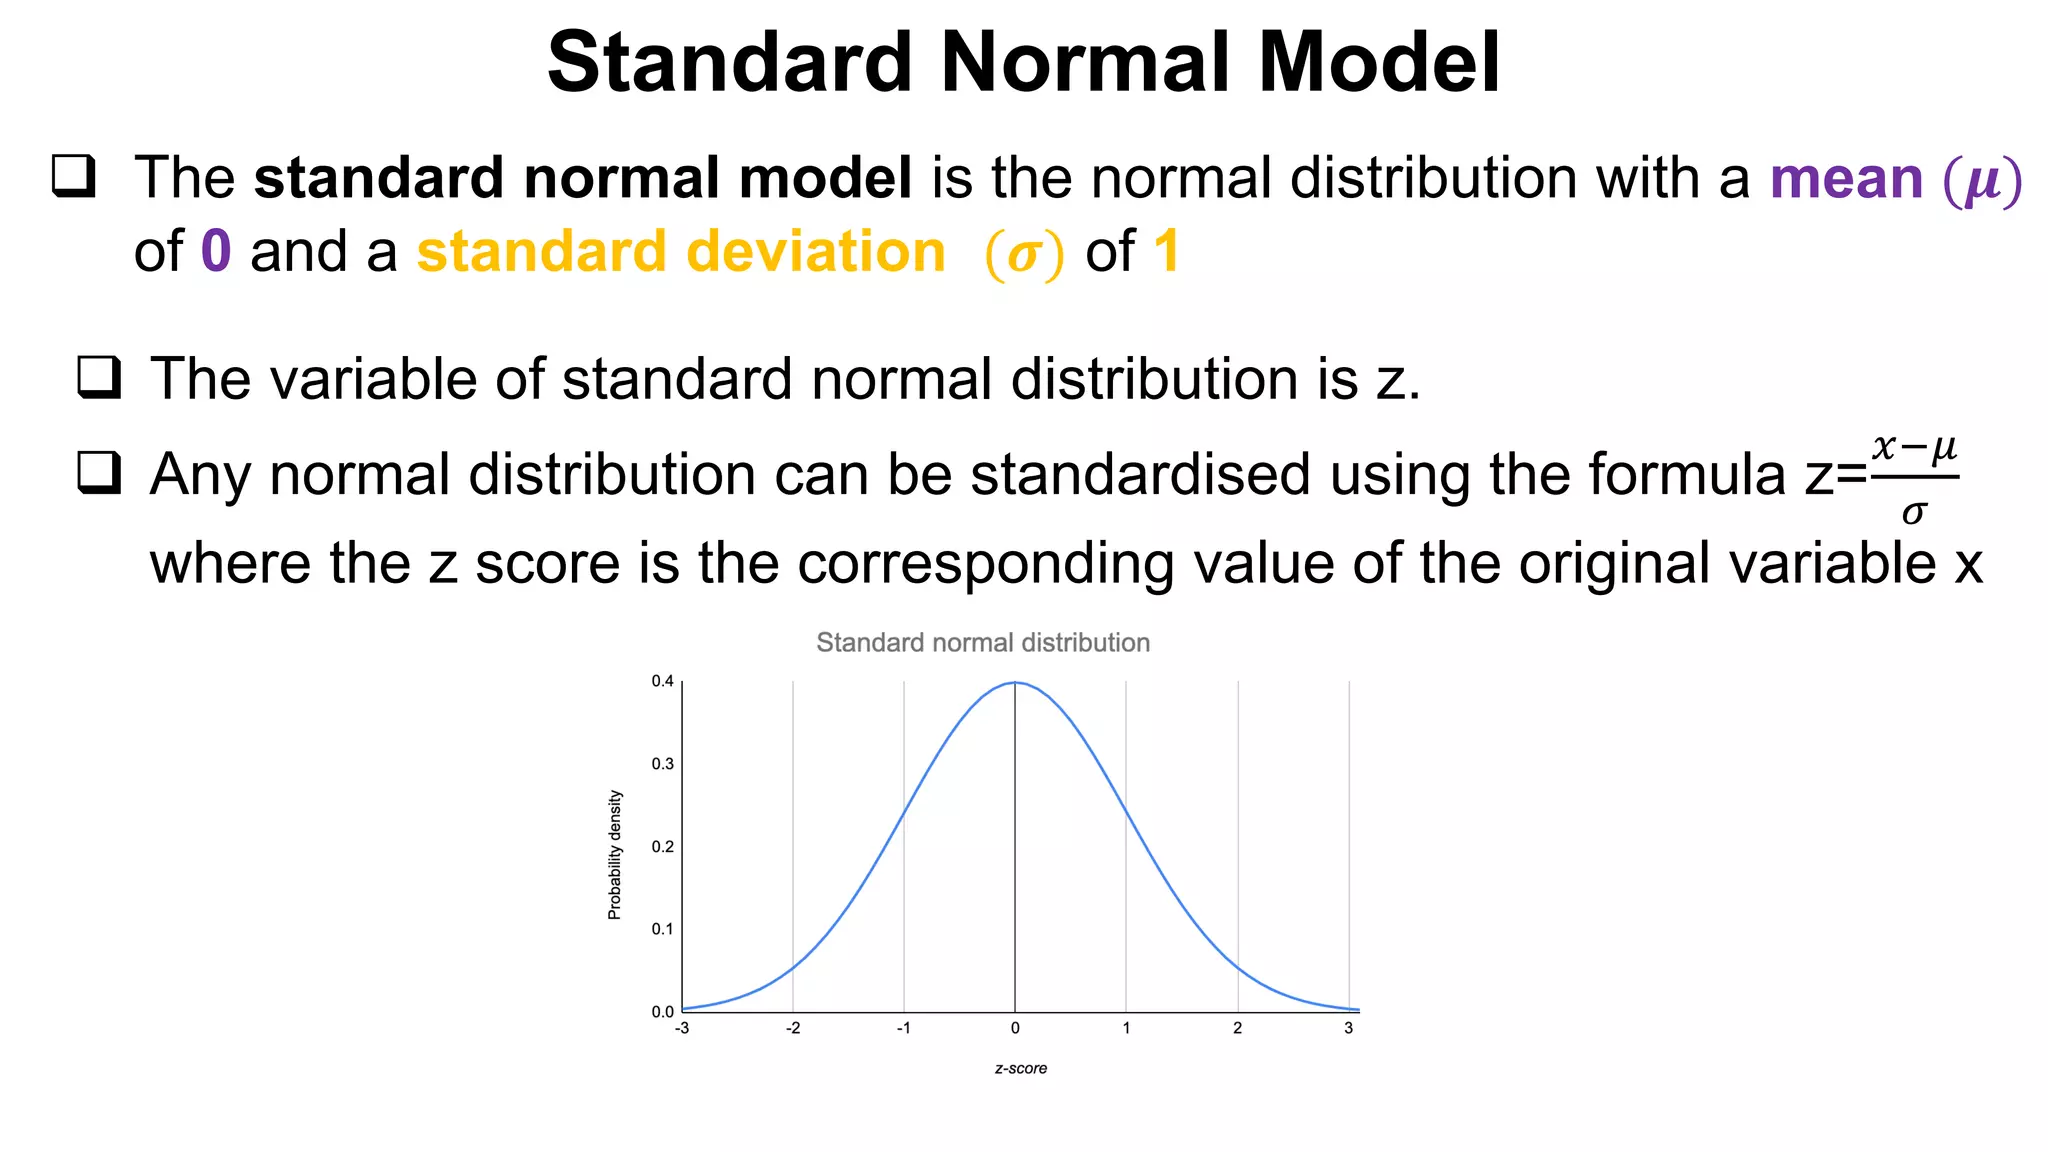

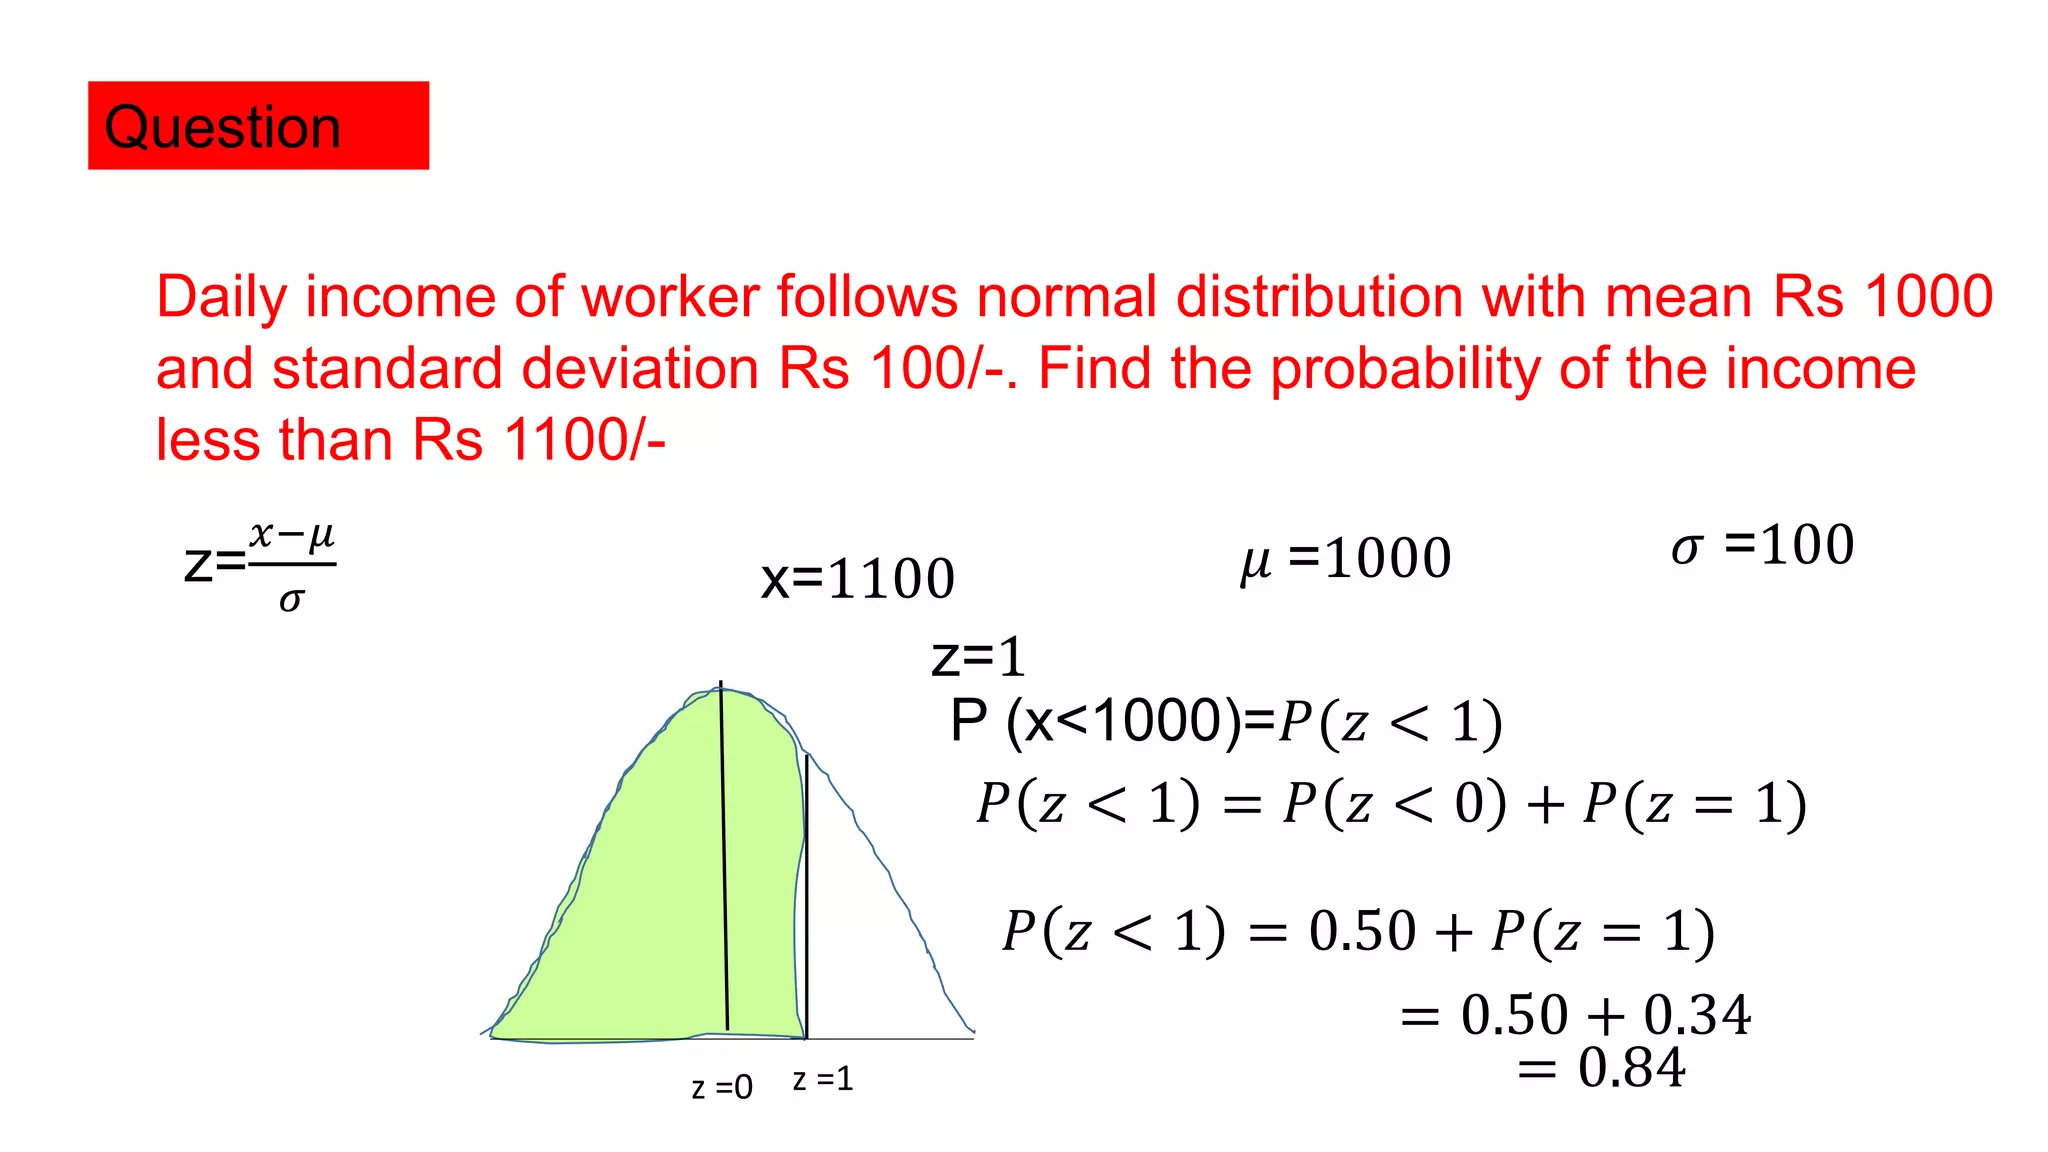
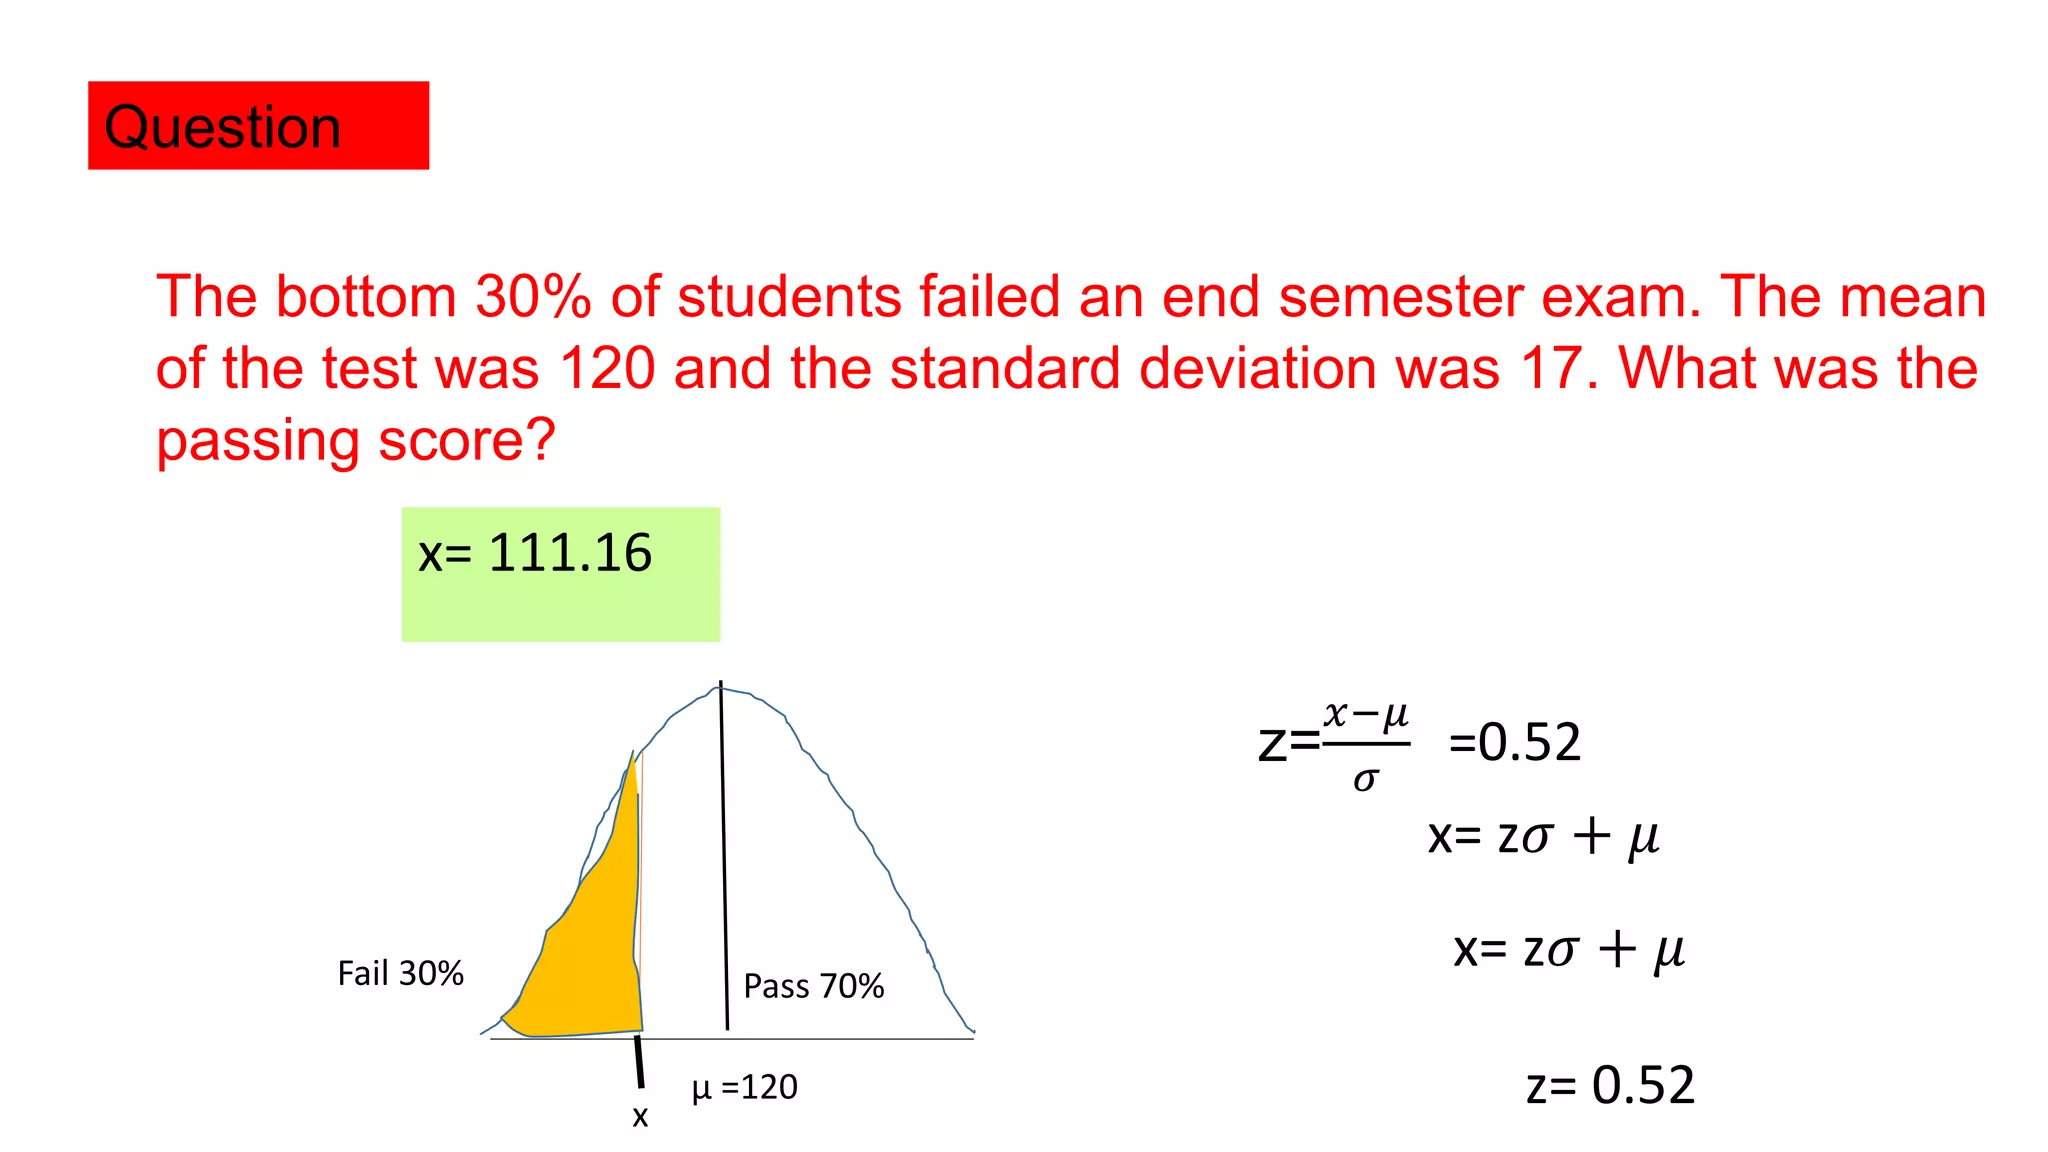

The document discusses normal distribution, also known as the Gaussian or bell curve, which is symmetrical and commonly appears in natural phenomena like height. It defines the normal density function, properties such as equality of mean, mode, and median, and explains the standard normal model which has a mean of 0 and standard deviation of 1. Additionally, it provides examples of applying normal distribution in calculating probabilities related to income and exam scores.