This document analyzes the financial performance of Nike Inc. over 2013-2014. It includes a company description noting Nike was founded in 1964 and is now a global brand in sports apparel and equipment. The document then provides detailed financial analysis including ratio calculations for profitability, liquidity, debt management, cash flow and market performance. Key ratios show Nike's gross margin and returns on assets and equity increased slightly from 2013 to 2014, indicating improved profitability.


![Nike Inc.
4
Financial Statement Ratios
Profitability Ratios
2014 2013
GrossMargin Percentage
Gross Margin/Sales
Gross Margin 12,446,000,000 11,034,000,000
Sales 27,799,000,000 25,313,000,000
Gross Margin Percentage 44.77% 43.59%
Return on Total Assets
{NetIncome+[InterestExpense*(1-Tax Rate)]}/Total Assets
NetIncome 2,693,000,000 2,485,000,000
InterestExpense 38,000,000 23,000,000
Total Assets 18,594,000,000 17,584,000,000
Effective Tax Rate 24.00% 24.70%
Returnon Total Assets 14.68% 14.23%
Return on Equity
NetIncome/Total Stockholder'sEquity
NetIncome 2,693,000,000 2,485,000,000
Average Total Stockholder'sEquity 10,952,000,000 11,156,000,000
Returnon Equity 24.58% 22.28%
NetProfit Margin Percentage
NetIncome/Sales
NetIncome 2,693,000 2,485,000,000
Sales 27,799,000,000 25,313,000,000
NetProfitMargin Percentage 9.68% 9.82%
Liquidity Ratios
WorkingCapital
CurrentAssets - CurrentLiabilities
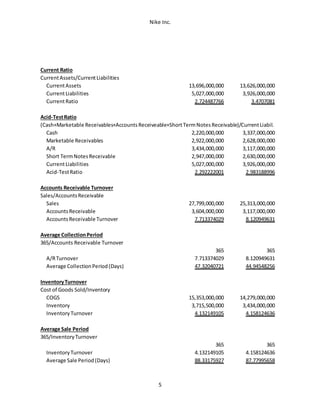
CurrentAssets 13,696,000,000 13,626,000,000
CurrentLiabilities 5,027,000,000 3,926,000,000
WorkingCapital $ 8,669,000,000 $ 9,700,000,000](https://image.slidesharecdn.com/2cd2ffb4-e1f8-4253-9762-549254dd1773-160130202019/85/Nike-Final-4-320.jpg)