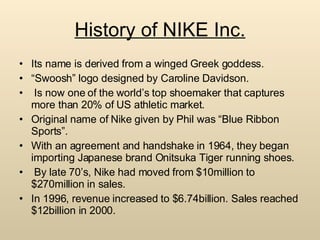
NIKE
History of NIKE Inc. Its name is derived from a winged Greek goddess.  “ Swoosh” logo designed by Caroline Davidson. Is now one of the world’s top shoemaker that captures more than 20% of US athletic market. Original name of Nike given by Phil was “Blue Ribbon Sports”. With an agreement and handshake in 1964, they began importing Japanese brand Onitsuka Tiger running shoes. By late 70’s, Nike had moved from $10million to $270million in sales. In 1996, revenue increased to $6.74billion. Sales reached $12billion in 2000.
Footwear Running Basketball Soccer Sport-inspired urban shoes Children’s Shoes
Also Sells Apparels and Accessories Athletic Bags Offers Apparels for Licensed Sports Team
Sale of Performance Equip. under Nike Brand  Bags Socks Sport Balls Eyewear Timepieces Electronic Devices Bats Gloves Protective Equipments
Provides Licenses to Produce and Sell Swimwear Cycling Apparel Children’s Clothing School Supplies Electronic Devices Eyewear Golf Accessories Belts
The company sells its products to retail accounts, through its owned retail stores, and through a mix of independent distributors and licensees, as well as through Internet Web site, nikestore.com Sales Technique
Subsidiaries NIKE inc. has major four subsidiaries which are: Converse Cole Haan Holdings Nike Bauer Hockey Hurley International
Major announcements February 15, 2008 (Financial Wire) NIKE, Inc.'s (NYSE: NKE) board has declared a quarterly cash dividend of twenty three cents per share on the company's outstanding class A and class B common stock, payable April 1 shareholders of record at the close of business March 10. NIKE and Phoenix Suns guard Steve Nash are releasing a new basketball shoe made with manufacturing scraps, called the Nike Trash Talk shoe. Feb. 5 (Bloomberg) -- Nike Inc. put its Bauer hockey equipment unit up for sale, having failed to promote the brand.
Comparative Balance Sheet Acoount Heads 2007 2006 Increase/Decrease % Change Current Assets 8077 7359 718 9.76% Total Non current Assets 2612 2511 101 4.02% Total Assets 10689 9870 819 8.30% Current Liabilities 2584 2623 -39 -1.49% Total Non-current Liabilities 1079 961 118 12.28% Total Liabilities 3663 3584 79 2.20% Total Equity 7025 6285 740 11.77%
 
Comparative Income Statement Accounts 2007 2006 Increase/Decrease % Change Revenue 16326 14954 1372 9.17% COGS 9165 8368 797 9.52% Gross Profit 7161 6586 575 8.73% SG&A Expense 4759 4187 572 13.66% Depreciationa & Amortization 270 291 -21 -7.22% Operating Income 2132 2108 24 1.14% Nonoperating Income 68 32 36 112.50% Income Before Taxes 2200 2140 60 2.80% Income Taxes 708 750 -42 -5.60% Net Income After Taxes 1492 1390 102 7.34%
 
Financial Strength Current ratio Quick Ratio Total Debt to Equity Ratio
 
Overall Financial Strength Analysis of these ratios shows that they are in overall good standing concerning financial strength. The company has a relatively low risk of not meeting their short term obligations. Current Ratio  (2.32:1) Good Quick Ratio  (3.11:1) Good Debt to Equity Ratio  (0.08) Good
Efficiency Receivable Turnover Inventory Turnover Asset Turnover
 
Overall Efficiency Analysis of these ratios shows that they are in overall good standing concerning the efficiency. Receivable Turnover (6.93:1) Good Inventory Turnover  (4.30:1) Good Asset Turnover  (1.63) Good
Valuation Ratios Price to Earnings Ratio Price to Sales Ratio Price to Cash Flow Ratio Price to Free Cash Flow Ratio


Dividends Ratio Analysis The higher dividend payout ratio compared to industrial average indicates that the company’s dividend payment ratio is well supported by its earnings. However, the dividend yield ratio and dividend growth ratio is well below the industrial average.
2007 2006 2005 2004 2003 2002 Dividends per Share - Common Stock Primary Issue    0.71    0.59    0.47    0.37    0.27    0.24 
Views In our view, Nike will increase its sales growth rate and its profit percent.  The company might as well start new products. The company is increasing its sales as well as revenue. So, it is profitable for company to expand its business as much as possible.
Citations Annual Report 2006,2007. http://www.finance.google.com/finance http://www.hoovers.com http://www.nikebiz.com http://investing.businessweek.com/ http://shoes.about.com

Nike 2007 Financial Statement Comparision with Statement

  • 1.
  • 2.
    History of NIKEInc. Its name is derived from a winged Greek goddess. “ Swoosh” logo designed by Caroline Davidson. Is now one of the world’s top shoemaker that captures more than 20% of US athletic market. Original name of Nike given by Phil was “Blue Ribbon Sports”. With an agreement and handshake in 1964, they began importing Japanese brand Onitsuka Tiger running shoes. By late 70’s, Nike had moved from $10million to $270million in sales. In 1996, revenue increased to $6.74billion. Sales reached $12billion in 2000.
  • 3.
    Footwear Running BasketballSoccer Sport-inspired urban shoes Children’s Shoes
  • 4.
    Also Sells Apparelsand Accessories Athletic Bags Offers Apparels for Licensed Sports Team
  • 5.
    Sale of PerformanceEquip. under Nike Brand Bags Socks Sport Balls Eyewear Timepieces Electronic Devices Bats Gloves Protective Equipments
  • 6.
    Provides Licenses toProduce and Sell Swimwear Cycling Apparel Children’s Clothing School Supplies Electronic Devices Eyewear Golf Accessories Belts
  • 7.
    The company sellsits products to retail accounts, through its owned retail stores, and through a mix of independent distributors and licensees, as well as through Internet Web site, nikestore.com Sales Technique
  • 8.
    Subsidiaries NIKE inc.has major four subsidiaries which are: Converse Cole Haan Holdings Nike Bauer Hockey Hurley International
  • 9.
    Major announcements February15, 2008 (Financial Wire) NIKE, Inc.'s (NYSE: NKE) board has declared a quarterly cash dividend of twenty three cents per share on the company's outstanding class A and class B common stock, payable April 1 shareholders of record at the close of business March 10. NIKE and Phoenix Suns guard Steve Nash are releasing a new basketball shoe made with manufacturing scraps, called the Nike Trash Talk shoe. Feb. 5 (Bloomberg) -- Nike Inc. put its Bauer hockey equipment unit up for sale, having failed to promote the brand.
  • 10.
    Comparative Balance SheetAcoount Heads 2007 2006 Increase/Decrease % Change Current Assets 8077 7359 718 9.76% Total Non current Assets 2612 2511 101 4.02% Total Assets 10689 9870 819 8.30% Current Liabilities 2584 2623 -39 -1.49% Total Non-current Liabilities 1079 961 118 12.28% Total Liabilities 3663 3584 79 2.20% Total Equity 7025 6285 740 11.77%
  • 11.
  • 12.
    Comparative Income StatementAccounts 2007 2006 Increase/Decrease % Change Revenue 16326 14954 1372 9.17% COGS 9165 8368 797 9.52% Gross Profit 7161 6586 575 8.73% SG&A Expense 4759 4187 572 13.66% Depreciationa & Amortization 270 291 -21 -7.22% Operating Income 2132 2108 24 1.14% Nonoperating Income 68 32 36 112.50% Income Before Taxes 2200 2140 60 2.80% Income Taxes 708 750 -42 -5.60% Net Income After Taxes 1492 1390 102 7.34%
  • 13.
  • 14.
    Financial Strength Currentratio Quick Ratio Total Debt to Equity Ratio
  • 15.
  • 16.
    Overall Financial StrengthAnalysis of these ratios shows that they are in overall good standing concerning financial strength. The company has a relatively low risk of not meeting their short term obligations. Current Ratio (2.32:1) Good Quick Ratio (3.11:1) Good Debt to Equity Ratio (0.08) Good
  • 17.
    Efficiency Receivable TurnoverInventory Turnover Asset Turnover
  • 18.
  • 19.
    Overall Efficiency Analysisof these ratios shows that they are in overall good standing concerning the efficiency. Receivable Turnover (6.93:1) Good Inventory Turnover (4.30:1) Good Asset Turnover (1.63) Good
  • 20.
    Valuation Ratios Priceto Earnings Ratio Price to Sales Ratio Price to Cash Flow Ratio Price to Free Cash Flow Ratio
  • 21.
  • 22.
  • 23.
  • 24.
    Dividends Ratio AnalysisThe higher dividend payout ratio compared to industrial average indicates that the company’s dividend payment ratio is well supported by its earnings. However, the dividend yield ratio and dividend growth ratio is well below the industrial average.
  • 25.
    2007 2006 20052004 2003 2002 Dividends per Share - Common Stock Primary Issue    0.71    0.59    0.47    0.37    0.27    0.24 
  • 26.
    Views In ourview, Nike will increase its sales growth rate and its profit percent. The company might as well start new products. The company is increasing its sales as well as revenue. So, it is profitable for company to expand its business as much as possible.
  • 27.
    Citations Annual Report2006,2007. http://www.finance.google.com/finance http://www.hoovers.com http://www.nikebiz.com http://investing.businessweek.com/ http://shoes.about.com