Download to read offline

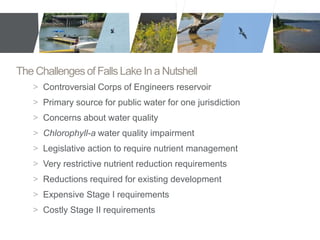
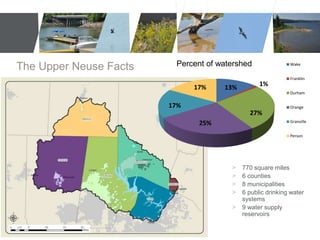
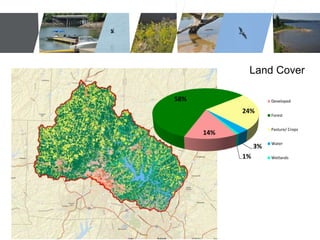
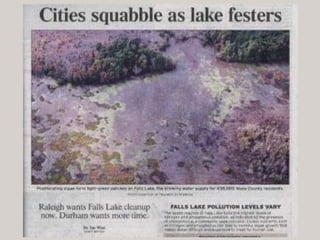


This document summarizes a panel discussion on the challenges facing the Falls Lake watershed in North Carolina. It discusses the history of water quality issues in Falls Lake leading to stringent nutrient reduction requirements. The Upper Neuse River Basin Association (UNRBA) was refocused to help members meet these requirements through collaborative efforts like developing nutrient credits and an adaptive monitoring program. While making progress towards its goals, the UNRBA still faces challenges in balancing ecological science with public policy given the large costs of compliance.


