Downloaded 17 times


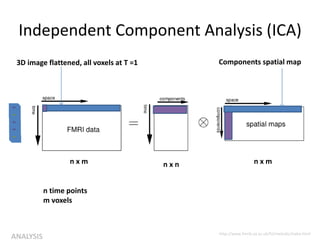
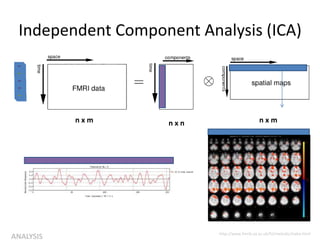
![Independent Component Analysis (ICA)
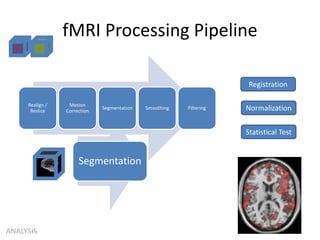
ANALYSIS
• One 3D image [ v1 v2 v3 v4… v4 ]
• 4D Image Matrix, M
v1 v2 v3 v4 v5 v6 v7 . . . vn
Voxels
Time](https://image.slidesharecdn.com/neuroimagingintroaug2012-150921070000-lva1-app6892/85/Neuroimaging-Introduction-16-320.jpg)
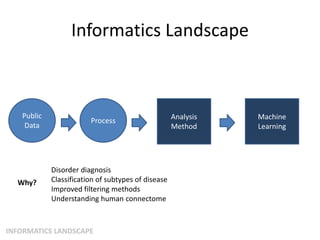


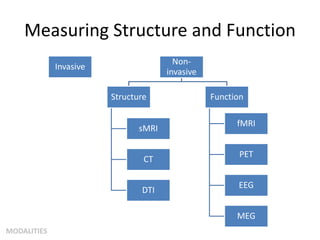
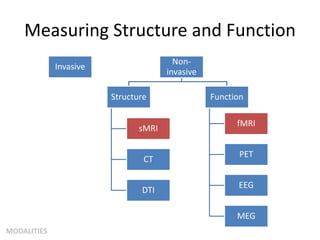
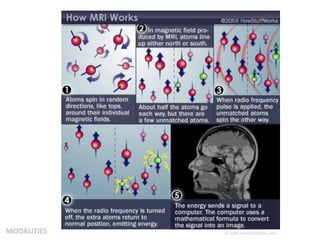
This document summarizes a neuroimaging introduction meeting. It discusses measuring the structure and function of the human brain using various modalities like MRI, CT, fMRI, PET. It describes the informatics processing pipeline for neuroimaging data including preprocessing, analysis techniques like segmentation, registration, and statistical tests. Independent component analysis is discussed as a data-driven approach to analyze functional connectivity within networks. The goals of neuroinformatics are also mentioned, such as using public data and machine learning for disorder diagnosis and classification.