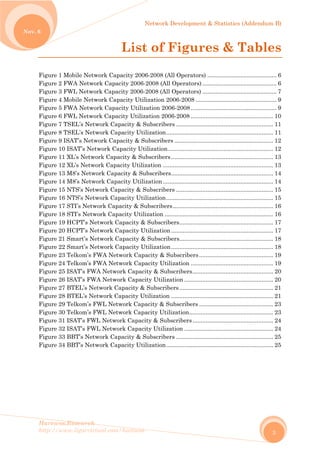
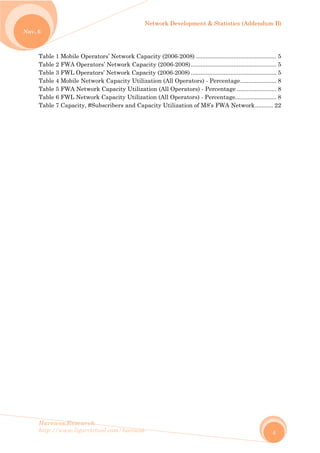
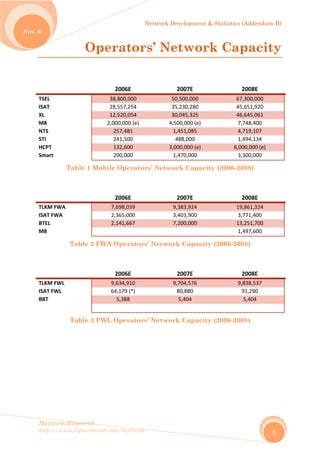
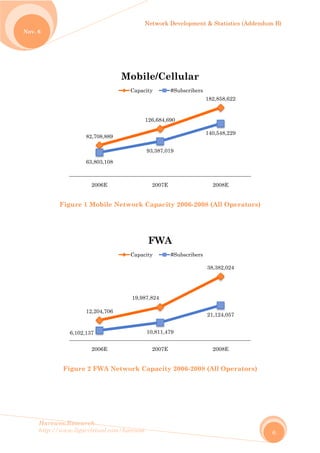
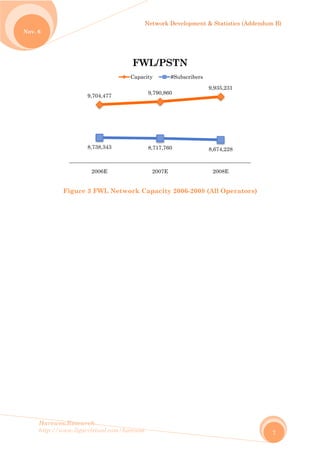
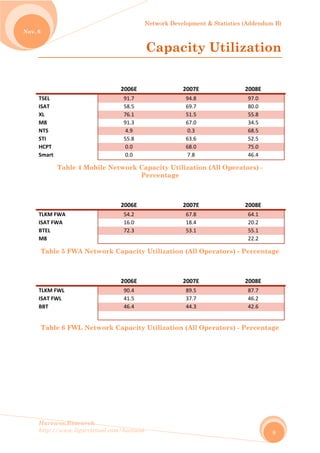
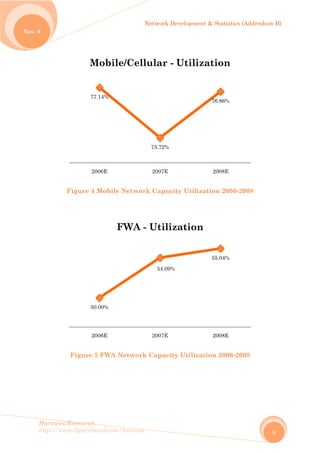
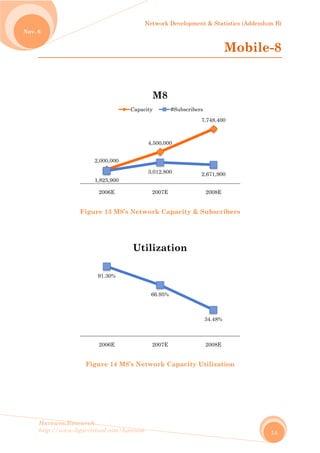
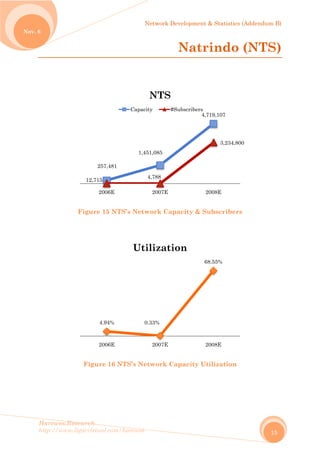
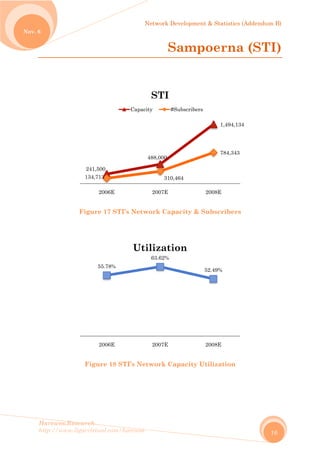
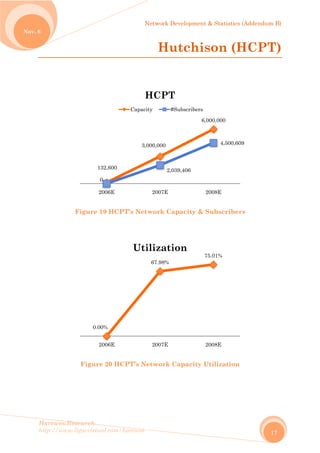
SlideShare a Scribd company logo
Network
Development &
Statistics
(Addendum B)
Indonesian Telecom Market Facts and
Numbers: Charts & Tables
2006-2008
[HR.CTD006b.V1U1-2009]
Dr.-Ing. Eueung Mulyana @ Harewos Research
11/6/2009
http://www.ligarvirtual.com/harewos
Network Development & Statistics (Addendum B)
Harewos.Research
http://www.ligarvirtual.com/harewos
Nov. 6
2
Contents
List of Figures & Tables........................................................................................................ 3
Operators’ Network Capacity ............................................................................................... 5
Capacity Utilization .............................................................................................................. 8
Telkomsel............................................................................................................................. 11
Indosat ................................................................................................................................. 12
Excelcomindo ....................................................................................................................... 13
Mobile-8................................................................................................................................ 14
Natrindo (NTS).................................................................................................................... 15
Sampoerna (STI).................................................................................................................. 16
Hutchison (HCPT)............................................................................................................... 17
Smart Telecom..................................................................................................................... 18
Telkom FWA........................................................................................................................ 19
Indosat FWA........................................................................................................................ 20
Bakrie Telecom.................................................................................................................... 21
Mobile-8 FWA...................................................................................................................... 22
Telkom FWL/PSTN ............................................................................................................. 23
Indosat FWL/PSTN ............................................................................................................. 24
BBT ...................................................................................................................................... 25
Abbreviations & Notes ........................................................................................................ 26
Network Development & Statistics (Addendum B)
Harewos.Research
http://www.ligarvirtual.com/harewos
Nov. 6
3
List of Figures & Tables
Figure 1 Mobile Network Capacity 2006-2008 (All Operators) .......................................... 6
Figure 2 FWA Network Capacity 2006-2008 (All Operators) ............................................. 6
Figure 3 FWL Network Capacity 2006-2008 (All Operators) ............................................. 7
Figure 4 Mobile Network Capacity Utilization 2006-2008 ................................................. 9
Figure 5 FWA Network Capacity Utilization 2006-2008 .................................................... 9
Figure 6 FWL Network Capacity Utilization 2006-2008 .................................................. 10
Figure 7 TSEL’s Network Capacity & Subscribers ........................................................... 11
Figure 8 TSEL’s Network Capacity Utilization................................................................. 11
Figure 9 ISAT’s Network Capacity & Subscribers ............................................................ 12
Figure 10 ISAT’s Network Capacity Utilization................................................................ 12
Figure 11 XL’s Network Capacity & Subscribers.............................................................. 13
Figure 12 XL’s Network Capacity Utilization ................................................................... 13
Figure 13 M8’s Network Capacity & Subscribers.............................................................. 14
Figure 14 M8’s Network Capacity Utilization................................................................... 14
Figure 15 NTS’s Network Capacity & Subscribers ........................................................... 15
Figure 16 NTS’s Network Capacity Utilization................................................................. 15
Figure 17 STI’s Network Capacity & Subscribers............................................................. 16
Figure 18 STI’s Network Capacity Utilization .................................................................. 16
Figure 19 HCPT’s Network Capacity & Subscribers......................................................... 17
Figure 20 HCPT’s Network Capacity Utilization.............................................................. 17
Figure 21 Smart’s Network Capacity & Subscribers......................................................... 18
Figure 22 Smart’s Network Capacity Utilization.............................................................. 18
Figure 23 Telkom’s FWA Network Capacity & Subscribers............................................. 19
Figure 24 Telkom’s FWA Network Capacity Utilization .................................................. 19
Figure 25 ISAT’s FWA Network Capacity & Subscribers................................................. 20
Figure 26 ISAT’s FWA Network Capacity Utilization ...................................................... 20
Figure 27 BTEL’s Network Capacity & Subscribers......................................................... 21
Figure 28 BTEL’s Network Capacity Utilization .............................................................. 21
Figure 29 Telkom’s FWL Network Capacity & Subscribers ............................................. 23
Figure 30 Telkom’s FWL Network Capacity Utilization................................................... 23
Figure 31 ISAT’s FWL Network Capacity & Subscribers................................................. 24
Figure 32 ISAT’s FWL Network Capacity Utilization ...................................................... 24
Figure 33 BBT’s Network Capacity & Subscribers ........................................................... 25
Figure 34 BBT’s Network Capacity Utilization................................................................. 25
Network Development & Statistics (Addendum B)
Harewos.Research
http://www.ligarvirtual.com/harewos
Nov. 6
4
Table 1 Mobile Operators’ Network Capacity (2006-2008) ................................................. 5
Table 2 FWA Operators’ Network Capacity (2006-2008).................................................... 5
Table 3 FWL Operators’ Network Capacity (2006-2008) .................................................... 5
Table 4 Mobile Network Capacity Utilization (All Operators) - Percentage...................... 8
Table 5 FWA Network Capacity Utilization (All Operators) - Percentage ........................ 8
Table 6 FWL Network Capacity Utilization (All Operators) - Percentage......................... 8
Table 7 Capacity, #Subscribers and Capacity Utilization of M8’s FWA Network........... 22
Network Development & Statistics (Addendum B)
Harewos.Research
http://www.ligarvirtual.com/harewos
Nov. 6
5
Operators’ Network Capacity
   2006E  2007E  2008E 
TSEL  38,800,000  50,500,000  67,300,000 
ISAT  28,557,254  35,230,280  45,651,920 
XL  12,520,054  30,045,325  46,645,061 
M8  2,000,000 (e)  4,500,000 (e)  7,748,400 
NTS  257,481  1,451,085  4,719,107 
STI  241,500  488,000  1,494,134 
HCPT  132,600  3,000,000 (e)  6,000,000 (e) 
Smart  200,000  1,470,000  3,300,000 
Table 1 Mobile Operators’ Network Capacity (2006-2008)
  2006E  2007E  2008E 
TLKM FWA  7,698,039  9,383,924  19,861,324 
ISAT FWA  2,365,000  3,403,900  3,771,400 
BTEL  2,141,667  7,200,000  13,251,700 
M8      1,497,600 
Table 2 FWA Operators’ Network Capacity (2006-2008)
  2006E  2007E  2008E 
TLKM FWL  9,634,910  9,704,576  9,838,537 
ISAT FWL  64,179 (*)  80,880  91,290 
BBT  5,388  5,404  5,404 
       
Table 3 FWL Operators’ Network Capacity (2006-2008)
No
Harew
http://
ov. 6
wos.Resear
/www.ligar
Figure 1
Figure
8
6
1
6,102,1
rch
rvirtual.com
1 Mobile N
2 FWA N
82,708,889
63,803,108
2006E
12,204,706
137
2006E
m/harewos
Network
Network C
Mobi
Capac
19,98
Capac
Network D
Capacity
Capacity
126,684,690
93,387,019
2007E
ile/Cel
city #
87,824
10,811,479
2007E
FWA
city #
Developmen
y 2006-200
2006-2008
0
llular
#Subscribers
#Subscribers
nt & Statist
08 (All Op
8 (All Ope
182,858,62
140,548,22
2008E
s
38,382,02
21,124,05
2008E
s
tics (Adden
perators)
erators)
22
29
4
7
ndum B)
6
)
No
Harew
http://
ov. 6
wos.Resear
/www.ligar
Figure
rch
rvirtual.com
3 FWL N
9,704,477
8,738,343
2006E
m/harewos
etwork C
FW
Capac
Network D
Capacity
9,790,860
8,717,760
2007E
WL/PST
city #
Developmen
2006-2008
TN
#Subscribers
nt & Statist
8 (All Ope
9,935,231
8,674,228
2008E
s
tics (Adden
erators)
1
8
ndum B)
7
Network Development & Statistics (Addendum B)
Harewos.Research
http://www.ligarvirtual.com/harewos
Nov. 6
8
Capacity Utilization
  2006E  2007E  2008E 
TSEL  91.7  94.8  97.0 
ISAT  58.5  69.7  80.0 
XL  76.1  51.5  55.8 
M8  91.3  67.0  34.5 
NTS  4.9  0.3  68.5 
STI  55.8  63.6  52.5 
HCPT  0.0  68.0  75.0 
Smart  0.0  7.8  46.4 
Table 4 Mobile Network Capacity Utilization (All Operators) -
Percentage
  2006E  2007E  2008E 
TLKM FWA  54.2  67.8  64.1 
ISAT FWA  16.0  18.4  20.2 
BTEL  72.3  53.1  55.1 
M8        22.2 
Table 5 FWA Network Capacity Utilization (All Operators) - Percentage
  2006E  2007E  2008E 
TLKM FWL  90.4  89.5  87.7 
ISAT FWL  41.5  37.7  46.2 
BBT  46.4  44.3  42.6 
       
Table 6 FWL Network Capacity Utilization (All Operators) - Percentage
No
Harew
http://
ov. 6
wos.Resear
/www.ligar
Figure
Figur
rch
rvirtual.com
e 4 Mobil
re 5 FWA
77.14%
2006E
Mobil
50.00%
2006E
m/harewos
e Networ
A Network
le/Cell
FWA -
Network D
rk Capaci
k Capacit
73.72%
2007E
lular -
54.09%
2007E
- Utiliz
Developmen
ity Utiliz
ty Utiliza
Utiliz
%
zation
nt & Statist
ation 200
ation 2006
76.86%
2008E
zation
55.04%
2008E
n
tics (Adden
06-2008
6-2008
ndum B)
9
No
Harew
http://
ov. 6
wos.Resear
/www.ligar
Figur
rch
rvirtual.com
re 6 FWL
90.04%
2006E
FW
m/harewos
Network
WL/PST
Network D
k Capacit
89.04%
2007E
TN - Ut
Developmen
ty Utiliza
tilizat
nt & Statist
ation 2006
87.31%
2008E
tion
tics (Adden
6-2008
ndum B)
10
No
Harew
http://
ov. 6
wos.Resear
/www.ligar
Fig
F
rch
rvirtual.com
gure 7 TS
Figure 8 T
38,800,00
35,597,17
2006E
91.75%
2006E
m/harewos
SEL’s Net
TSEL’s Ne
00
71
Capac
Ut
Network D
work Cap
etwork C
50,500,000
47,890,139
2007E
TSEL
city #
94.83%
2007E
tilizati
Developmen
pacity &
Capacity U
6
6
L
#Subscribers
ion
nt & Statist
Tel
Subscrib
Utilizatio
67,300,000
65,299,991
2008E
s
97.03%
2008E
tics (Adden
lkom
bers
on
ndum B)
11
msel
No
Harew
http://
ov. 6
wos.Resear
/www.ligar
Fig
F
rch
rvirtual.com
gure 9 ISA
igure 10
28,557,25
16,704,63
2006E
58.50%
2006E
m/harewos
AT’s Netw
ISAT’s N
54
39
Capac
Ut
Network D
work Cap
etwork C
35,230,280
24,545,422
2007E
ISAT
city #
69.67%
2007E
tilizati
Developmen
pacity & S
Capacity U
4
3
#Subscribers
ion
nt & Statist
I
Subscrib
Utilizatio
45,651,920
36,510,246
2008E
s
79.98%
2008E
tics (Adden
Indo
ers
on
ndum B)
12
osat
No
Harew
http://
ov. 6
wos.Resear
/www.ligar
Fi
F
rch
rvirtual.com
igure 11 X
Figure 12
12,520,05
9,527,97
2006E
76.10%
2006E
m/harewos
XL’s Netw
2 XL’s Ne
54
0
Capac
Ut
Network D
work Cap
twork Ca
30,045,325
15,469,000
2007E
XL
city #
51.49%
2007E
tilizati
Developmen
Ex
pacity & S
apacity U
4
2
#Subscribers
ion
nt & Statist
xcelc
Subscribe
Utilization
46,645,061
26,015,517
2008E
s
55.77%
2008E
tics (Adden
omin
ers
n
ndum B)
13
ndo
No
Harew
http://
ov. 6
wos.Resear
/www.ligar
Fi
F
rch
rvirtual.com
igure 13 M
Figure 14
2,000,00
1,825,90
2006E
91.30%
2006E
m/harewos
M8’s Netw
4 M8’s Ne
0
0
Capac
Ut
Network D
work Cap
etwork Ca
4,500,000
3,012,800
2007E
M8
city #
66.95%
2007E
tilizati
Developmen
pacity & S
apacity U
7
2
#Subscribers
ion
nt & Statist
M
Subscribe
Utilization
7,748,400
2,671,900
2008E
s
34.48%
2008E
tics (Adden
Mobil
ers
n
ndum B)
14
le-8
No
Harew
http://
ov. 6
wos.Resear
/www.ligar
Fig
F
1
rch
rvirtual.com
gure 15 N
Figure 16
257,481
12,715
2006E
4.94%
2006E
m/harewos
NTS’s Netw
NTS’s Ne
1
1,4
Capac
Ut
Network D
work Cap
etwork C
451,085
4,788
2007E
NTS
city #
0.33%
2007E
tilizati
Developmen
Nat
pacity &
Capacity U
4
#Subscribers
ion
nt & Statist
rind
Subscrib
Utilizatio
4,719,107
3,234
2008E
s
68.55%
2008E
tics (Adden
o (NT
bers
on
4,800
ndum B)
15
TS)
No
Harew
http://
ov. 6
wos.Resear
/www.ligar
Fig
F
2
1
rch
rvirtual.com
gure 17 S
Figure 18
241,500
134,713
2006E
55.78%
2006E
m/harewos
STI’s Netw
8 STI’s Ne
Capac
Ut
Network D
S
work Cap
etwork Ca
488,000
310,
2007E
STI
city #
63.62%
2007E
tilizati
Developmen
Samp
pacity & S
apacity U
,464
#Subscribers
ion
nt & Statist
poern
Subscribe
Utilizatio
1,494
784,3
2008E
s
52.49%
2008E
tics (Adden
na (S
ers
n
4,134
343
ndum B)
16
STI)
No
Harew
http://
ov. 6
wos.Resear
/www.ligar
Figu
Fi
rch
rvirtual.com
ure 19 HC
igure 20 H
132,600
0
2006E
0.00%
2006E
m/harewos
CPT’s Ne
HCPT’s N
0
3
Capac
Ut
Network D
Hu
twork Ca
Network C
,000,000
2,0
2007E
HCPT
city #
67.98%
2007E
tilizati
Developmen
utchi
apacity &
Capacity
6
039,406
T
#Subscribers
ion
nt & Statist
ison
& Subscrib
Utilizati
6,000,000
4,500
2008E
s
75.01%
2008E
tics (Adden
(HCP
bers
on
0,609
ndum B)
17
PT)
No
Harew
http://
ov. 6
wos.Resear
/www.ligar
Figu
Fi
rch
rvirtual.com
ure 21 Sm
igure 22 S
200,000
0
2006E
0.00%
2006E
m/harewos
mart’s Ne
Smart’s N
0
1,4
Capac
Ut
Network D
twork Ca
Network C
470,000
115,000
2007E
Smart
city #
7.82%
2007E
tilizati
Developmen
Sma
apacity &
Capacity
3
t
#Subscribers
ion
nt & Statist
art T
& Subscrib
Utilizati
3,300,000
1,530
2008E
s
46.39%
2008E
tics (Adden
Telec
bers
on
0,823
ndum B)
18
com
No
Harew
http://
ov. 6
wos.Resear
/www.ligar
Figure
Figur
rch
rvirtual.com
23 Telko
re 24 Telk
7,698,03
4,
2006E
54.25%
2006E
m/harewos
om’s FWA
kom’s FW
9
9
175,853
TL
Capac
Ut
Network D
A Network
WA Netwo
9,383,924
6,362,844
2007E
LKM-FW
city #
67.81%
2007E
tilizati
Developmen
T
k Capacit
rk Capac
1
1
WA
#Subscribers
ion
nt & Statist
Telko
ty & Subs
city Utiliz
19,861,324
12,725,425
2008E
s
64.07%
2008E
tics (Adden
om FW
scribers
zation
ndum B)
19
WA
No
Harew
http://
ov. 6
wos.Resear
/www.ligar
Figur
Figu
rch
rvirtual.com
e 25 ISAT
ure 26 ISA
2,365,00
378,727
2006E
16.01%
2006E
m/harewos
T’s FWA N
AT’s FWA
0
3,4
7
IS
Capac
Ut
Network D
Network
A Network
403,900
627,934
2007E
AT-FW
city #
18.45%
2007E
tilizati
Developmen
In
Capacity
k Capacit
3
WA
#Subscribers
ion
nt & Statist
ndos
y & Subsc
ty Utiliza
3,771,400
761,589
2008E
s
20.19%
2008E
tics (Adden
sat FW
cribers
ation
ndum B)
20
WA
No
Harew
http://
ov. 6
wos.Resear
/www.ligar
Figu
Fi
1,54
rch
rvirtual.com
ure 27 BT
igure 28 B
2,141,66
47,557
2006E
72.26%
2006E
m/harewos
TEL’s Net
BTEL’s N
7
7,2
Se
Ut
Network D
twork Ca
Network C
200,000
3,820,701
2007E
BTEL
eries2
53.07%
2007E
tilizati
Developmen
Bak
apacity &
Capacity
1
7
L
Series3
ion
nt & Statist
krie T
& Subscrib
Utilizatio
13,251,700
7,304,543
2008E
55.12%
2008E
tics (Adden
Telec
bers
on
ndum B)
21
com
Network Development & Statistics (Addendum B)
Harewos.Research
http://www.ligarvirtual.com/harewos
Nov. 6
22
Mobile-8 FWA
  2006E  2007E  2008E 
Capacity  ‐  ‐  1,497,600 
#Subscribers  ‐  ‐  332,500 
Utilization  ‐  ‐  22.2 % 
Table 7 Capacity, #Subscribers and Capacity Utilization of M8’s FWA
Network
No
Harew
http://
ov. 6
wos.Resear
/www.ligar
Figure
Figur
8,70
rch
rvirtual.com
29 Telko
re 30 Telk
9,634,91
09,211
2006E
90.39%
2006E
m/harewos
om’s FWL
kom’s FW
0
TL
Capac
Ut
Network D
Tel
Network
WL Netwo
9,704,576
8,684,888
2007E
LKM-FW
city #
89.49%
2007E
tilizati
Developmen
lkom
k Capacit
rk Capac
9
8
WL
#Subscribers
ion
nt & Statist
m FWL
ty & Subs
city Utiliz
9,838,537
8,629,783
2008E
s
87.71%
2008E
tics (Adden
L/PS
scribers
zation
ndum B)
23
STN
No
Harew
http://
ov. 6
wos.Resear
/www.ligar
Figur
Figu
rch
rvirtual.com
e 31 ISAT
ure 32 ISA
64,179
26,632
2006E
41.50%
2006E
m/harewos
T’s FWL N
AT’s FWL
IS
Capac
Ut
Network D
Ind
Network
L Network
80,880
30,479
2007E
AT-FW
city #
37.68%
2007E
tilizati
Developmen
dosat
Capacity
k Capacit
WL
#Subscribers
ion
nt & Statist
t FWL
y & Subsc
ty Utiliza
91,290
42,145
2008E
s
46.17%
2008E
tics (Adden
L/PS
cribers
ation
ndum B)
24
STN
No
Harew
http://
ov. 6
wos.Resear
/www.ligar
Fig
F
rch
rvirtual.com
gure 33 B
Figure 34
5,388
2,500
2006E
46.40%
2006E
m/harewos
BBT’s Net
BBT’s Ne
Capac
Ut
Network D
work Cap
etwork C
5,404
2,393
2007E
BBT
city #
44.28%
2007E
tilizati
Developmen
pacity &
Capacity U
#Subscribers
ion
nt & Statist
Subscrib
Utilizatio
5,404
2,300
2008E
s
42.56%
2008E
tics (Adden
B
bers
on
ndum B)
25
BBT
Network Development & Statistics (Addendum B)
Harewos.Research
http://www.ligarvirtual.com/harewos
Nov. 6
26
Abbreviations & Notes
FWA Fixed Wireless Access
FWL Fixed Wire-Line
PSTN Public Switched Telephone Network
TLKM
PT. Telekomunikasi Indonesia / PT. Telkom Indonesia
ISAT
PT. Indosat
XL
PT. Excelcomindo Pratama
M-8 / M8
PT. Mobile-8
BTEL
PT. Bakrie Telecom
TSEL PT. Telekomunikasi Selular (Telkomsel)
STI
PT. Sampoerna Telekomunikasi Indonesia
NTS
PT. Natrindo Telepon Selular
HCPT
PT. Hutchison CP Telecommunication
Smart
PT. Smart Telecom
BBT
PT. Batam Bintan Telekomunikasi
(e) As used in e.g. Table 1
It refers to estimated values
2008E End of year 2008

More Related Content

What's hot

JCB 536-70 TELESCOPIC HANDLER Service Repair Manual
JCB 536-70 TELESCOPIC HANDLER Service Repair ManualJCB 536-70 TELESCOPIC HANDLER Service Repair Manual
JCB 536-70 TELESCOPIC HANDLER Service Repair Manual
jjsiekdmmse
 
JCB 531-70 TELESCOPIC HANDLER Service Repair Manual
JCB 531-70 TELESCOPIC HANDLER Service Repair ManualJCB 531-70 TELESCOPIC HANDLER Service Repair Manual
JCB 531-70 TELESCOPIC HANDLER Service Repair Manual
jksmelmdme
 
JCB 531-T70 TELESCOPIC HANDLER Service Repair Manual
JCB 531-T70 TELESCOPIC HANDLER Service Repair ManualJCB 531-T70 TELESCOPIC HANDLER Service Repair Manual
JCB 531-T70 TELESCOPIC HANDLER Service Repair Manual
jkseodlpled
 
JCB 535-T95 TELESCOPIC HANDLER Service Repair Manual
JCB 535-T95 TELESCOPIC HANDLER Service Repair ManualJCB 535-T95 TELESCOPIC HANDLER Service Repair Manual
JCB 535-T95 TELESCOPIC HANDLER Service Repair Manual
jkskemeedmm
 
Jcb 515 40 load control (supplement) service repair manual
Jcb 515 40 load control (supplement) service repair manualJcb 515 40 load control (supplement) service repair manual
Jcb 515 40 load control (supplement) service repair manual
jksmenmd
 
JCB 536-60 TELESCOPIC HANDLER Service Repair Manual
JCB 536-60 TELESCOPIC HANDLER Service Repair ManualJCB 536-60 TELESCOPIC HANDLER Service Repair Manual
JCB 536-60 TELESCOPIC HANDLER Service Repair Manual
jehjmm kusejm
 
Jcb 541 70 sway load control (supplement) service repair manual
Jcb 541 70 sway load control (supplement) service repair manualJcb 541 70 sway load control (supplement) service repair manual
Jcb 541 70 sway load control (supplement) service repair manual
fusjjfksekmme
 

What's hot (7)

JCB 536-70 TELESCOPIC HANDLER Service Repair Manual
JCB 536-70 TELESCOPIC HANDLER Service Repair ManualJCB 536-70 TELESCOPIC HANDLER Service Repair Manual
JCB 536-70 TELESCOPIC HANDLER Service Repair Manual
 
JCB 531-70 TELESCOPIC HANDLER Service Repair Manual
JCB 531-70 TELESCOPIC HANDLER Service Repair ManualJCB 531-70 TELESCOPIC HANDLER Service Repair Manual
JCB 531-70 TELESCOPIC HANDLER Service Repair Manual
 
JCB 531-T70 TELESCOPIC HANDLER Service Repair Manual
JCB 531-T70 TELESCOPIC HANDLER Service Repair ManualJCB 531-T70 TELESCOPIC HANDLER Service Repair Manual
JCB 531-T70 TELESCOPIC HANDLER Service Repair Manual
 
JCB 535-T95 TELESCOPIC HANDLER Service Repair Manual
JCB 535-T95 TELESCOPIC HANDLER Service Repair ManualJCB 535-T95 TELESCOPIC HANDLER Service Repair Manual
JCB 535-T95 TELESCOPIC HANDLER Service Repair Manual
 
Jcb 515 40 load control (supplement) service repair manual
Jcb 515 40 load control (supplement) service repair manualJcb 515 40 load control (supplement) service repair manual
Jcb 515 40 load control (supplement) service repair manual
 
JCB 536-60 TELESCOPIC HANDLER Service Repair Manual
JCB 536-60 TELESCOPIC HANDLER Service Repair ManualJCB 536-60 TELESCOPIC HANDLER Service Repair Manual
JCB 536-60 TELESCOPIC HANDLER Service Repair Manual
 
Jcb 541 70 sway load control (supplement) service repair manual
Jcb 541 70 sway load control (supplement) service repair manualJcb 541 70 sway load control (supplement) service repair manual
Jcb 541 70 sway load control (supplement) service repair manual
 

Viewers also liked

Saks Recognition Award
Saks Recognition AwardSaks Recognition Award
Saks Recognition Award
Darina Bender
 
Gloria
GloriaGloria
5 key things management students should focus on
5 key things management students should focus on5 key things management students should focus on
5 key things management students should focus on
Bijay pandey
 
Malaysia negara berdaulat(dun)
Malaysia negara berdaulat(dun)Malaysia negara berdaulat(dun)
Malaysia negara berdaulat(dun)
nurul izza
 
Informe Practica 3
Informe Practica 3Informe Practica 3
Informe Practica 3
IgnacioBobeda
 
Nubia
NubiaNubia
Geschäftsmodell tourismus
Geschäftsmodell tourismusGeschäftsmodell tourismus
Geschäftsmodell tourismus
JasmiinH
 
Rpp revisi 2016 teknik ukur tanah x smk rpp diva pendidikan
Rpp revisi 2016 teknik ukur tanah x smk   rpp diva pendidikanRpp revisi 2016 teknik ukur tanah x smk   rpp diva pendidikan
Rpp revisi 2016 teknik ukur tanah x smk rpp diva pendidikan
Diva Pendidikan
 
PROJECT FEASIBILITY REPORT ON
PROJECT FEASIBILITY REPORT ONPROJECT FEASIBILITY REPORT ON
PROJECT FEASIBILITY REPORT ON
Ajit Pal Singh Bana
 

Viewers also liked (10)

doc3
doc3doc3
doc3
 
Saks Recognition Award
Saks Recognition AwardSaks Recognition Award
Saks Recognition Award
 
Gloria
GloriaGloria
Gloria
 
5 key things management students should focus on
5 key things management students should focus on5 key things management students should focus on
5 key things management students should focus on
 
Malaysia negara berdaulat(dun)
Malaysia negara berdaulat(dun)Malaysia negara berdaulat(dun)
Malaysia negara berdaulat(dun)
 
Informe Practica 3
Informe Practica 3Informe Practica 3
Informe Practica 3
 
Nubia
NubiaNubia
Nubia
 
Geschäftsmodell tourismus
Geschäftsmodell tourismusGeschäftsmodell tourismus
Geschäftsmodell tourismus
 
Rpp revisi 2016 teknik ukur tanah x smk rpp diva pendidikan
Rpp revisi 2016 teknik ukur tanah x smk   rpp diva pendidikanRpp revisi 2016 teknik ukur tanah x smk   rpp diva pendidikan
Rpp revisi 2016 teknik ukur tanah x smk rpp diva pendidikan
 
PROJECT FEASIBILITY REPORT ON
PROJECT FEASIBILITY REPORT ONPROJECT FEASIBILITY REPORT ON
PROJECT FEASIBILITY REPORT ON
 

Similar to Network Development & Statistics (Addendum B)

3G Services & Infrastructure
3G Services & Infrastructure3G Services & Infrastructure
3G Services & Infrastructure
EM Archieve
 
Internet Services
Internet ServicesInternet Services
Internet Services
EM Archieve
 
Telecom Customer Bases – Part 3
Telecom Customer Bases – Part 3Telecom Customer Bases – Part 3
Telecom Customer Bases – Part 3
EM Archieve
 
2000330 en
2000330 en2000330 en
Sample global industrial ethernet cables market research report 2020
Sample global industrial ethernet cables market research report 2020  Sample global industrial ethernet cables market research report 2020
Sample global industrial ethernet cables market research report 2020
Cognitive Market Research
 
Telecom Customer Bases – Part 2
Telecom Customer Bases – Part 2Telecom Customer Bases – Part 2
Telecom Customer Bases – Part 2
EM Archieve
 
SMS Production
SMS ProductionSMS Production
SMS Production
EM Archieve
 
The het net ecosystem
The het net ecosystemThe het net ecosystem
The het net ecosystem
Market Reports Center
 
CrossFire Technical Feature Description-REV02
CrossFire Technical Feature Description-REV02CrossFire Technical Feature Description-REV02
CrossFire Technical Feature Description-REV02
Spiro Evagelakos
 
Lte introduction into_gsm-umts
Lte introduction into_gsm-umtsLte introduction into_gsm-umts
Lte introduction into_gsm-umts
Morg
 
Iic tsn testbed_char_mapping_of_converged_traffic_types_whitepaper_20180328
Iic tsn testbed_char_mapping_of_converged_traffic_types_whitepaper_20180328Iic tsn testbed_char_mapping_of_converged_traffic_types_whitepaper_20180328
Iic tsn testbed_char_mapping_of_converged_traffic_types_whitepaper_20180328
Jörgen Gade
 
Interconnection 101
Interconnection 101Interconnection 101
Interconnection 101
Equinix
 
Zxsdr bs8800 product description
Zxsdr bs8800 product descriptionZxsdr bs8800 product description
Zxsdr bs8800 product description
Adeep Asaad
 
Tech note umts
Tech note umtsTech note umts
Tech note umts
Morg
 
Automatic generation of power system network diagram(Mimic diagram) from a CI...
Automatic generation of power system network diagram(Mimic diagram) from a CI...Automatic generation of power system network diagram(Mimic diagram) from a CI...
Automatic generation of power system network diagram(Mimic diagram) from a CI...
Nikhil Valiveti
 
G-Cloud Programme vision UK - technical architectureworkstrand-report t8
G-Cloud Programme vision UK - technical architectureworkstrand-report t8G-Cloud Programme vision UK - technical architectureworkstrand-report t8
G-Cloud Programme vision UK - technical architectureworkstrand-report t8
Victor Gridnev
 
Mobile Internet, Broadband & Data Services
Mobile Internet, Broadband & Data ServicesMobile Internet, Broadband & Data Services
Mobile Internet, Broadband & Data Services
EM Archieve
 
Madge Perspective
Madge PerspectiveMadge Perspective
Madge Perspective
Ronald Bartels
 
Telecom Customer Bases – Part 1
Telecom Customer Bases – Part 1Telecom Customer Bases – Part 1
Telecom Customer Bases – Part 1
EM Archieve
 
ICT deployment and strategies for Smart Cities
ICT deployment and strategies for  Smart CitiesICT deployment and strategies for  Smart Cities
ICT deployment and strategies for Smart Cities
Aditya Basu
 

Similar to Network Development & Statistics (Addendum B) (20)

3G Services & Infrastructure
3G Services & Infrastructure3G Services & Infrastructure
3G Services & Infrastructure
 
Internet Services
Internet ServicesInternet Services
Internet Services
 
Telecom Customer Bases – Part 3
Telecom Customer Bases – Part 3Telecom Customer Bases – Part 3
Telecom Customer Bases – Part 3
 
2000330 en
2000330 en2000330 en
2000330 en
 
Sample global industrial ethernet cables market research report 2020
Sample global industrial ethernet cables market research report 2020  Sample global industrial ethernet cables market research report 2020
Sample global industrial ethernet cables market research report 2020
 
Telecom Customer Bases – Part 2
Telecom Customer Bases – Part 2Telecom Customer Bases – Part 2
Telecom Customer Bases – Part 2
 
SMS Production
SMS ProductionSMS Production
SMS Production
 
The het net ecosystem
The het net ecosystemThe het net ecosystem
The het net ecosystem
 
CrossFire Technical Feature Description-REV02
CrossFire Technical Feature Description-REV02CrossFire Technical Feature Description-REV02
CrossFire Technical Feature Description-REV02
 
Lte introduction into_gsm-umts
Lte introduction into_gsm-umtsLte introduction into_gsm-umts
Lte introduction into_gsm-umts
 
Iic tsn testbed_char_mapping_of_converged_traffic_types_whitepaper_20180328
Iic tsn testbed_char_mapping_of_converged_traffic_types_whitepaper_20180328Iic tsn testbed_char_mapping_of_converged_traffic_types_whitepaper_20180328
Iic tsn testbed_char_mapping_of_converged_traffic_types_whitepaper_20180328
 
Interconnection 101
Interconnection 101Interconnection 101
Interconnection 101
 
Zxsdr bs8800 product description
Zxsdr bs8800 product descriptionZxsdr bs8800 product description
Zxsdr bs8800 product description
 
Tech note umts
Tech note umtsTech note umts
Tech note umts
 
Automatic generation of power system network diagram(Mimic diagram) from a CI...
Automatic generation of power system network diagram(Mimic diagram) from a CI...Automatic generation of power system network diagram(Mimic diagram) from a CI...
Automatic generation of power system network diagram(Mimic diagram) from a CI...
 
G-Cloud Programme vision UK - technical architectureworkstrand-report t8
G-Cloud Programme vision UK - technical architectureworkstrand-report t8G-Cloud Programme vision UK - technical architectureworkstrand-report t8
G-Cloud Programme vision UK - technical architectureworkstrand-report t8
 
Mobile Internet, Broadband & Data Services
Mobile Internet, Broadband & Data ServicesMobile Internet, Broadband & Data Services
Mobile Internet, Broadband & Data Services
 
Madge Perspective
Madge PerspectiveMadge Perspective
Madge Perspective
 
Telecom Customer Bases – Part 1
Telecom Customer Bases – Part 1Telecom Customer Bases – Part 1
Telecom Customer Bases – Part 1
 
ICT deployment and strategies for Smart Cities
ICT deployment and strategies for  Smart CitiesICT deployment and strategies for  Smart Cities
ICT deployment and strategies for Smart Cities
 

More from EM Archieve

Case Studies & Network Planning Tools
Case Studies & Network Planning ToolsCase Studies & Network Planning Tools
Case Studies & Network Planning Tools
EM Archieve
 
Dimensioning of IP Backbone
Dimensioning of IP BackboneDimensioning of IP Backbone
Dimensioning of IP Backbone
EM Archieve
 
Broadband Connectivity for Indonesia
Broadband Connectivity for IndonesiaBroadband Connectivity for Indonesia
Broadband Connectivity for Indonesia
EM Archieve
 
PT Eigen Network - Network Planning & Overview
PT Eigen Network - Network Planning & OverviewPT Eigen Network - Network Planning & Overview
PT Eigen Network - Network Planning & Overview
EM Archieve
 
BlackBerry Services
BlackBerry ServicesBlackBerry Services
BlackBerry Services
EM Archieve
 
Estimate of Internet Subscriber 2009
Estimate of Internet Subscriber 2009Estimate of Internet Subscriber 2009
Estimate of Internet Subscriber 2009
EM Archieve
 
Population Distribution 2009
Population Distribution 2009Population Distribution 2009
Population Distribution 2009
EM Archieve
 

More from EM Archieve (7)

Case Studies & Network Planning Tools
Case Studies & Network Planning ToolsCase Studies & Network Planning Tools
Case Studies & Network Planning Tools
 
Dimensioning of IP Backbone
Dimensioning of IP BackboneDimensioning of IP Backbone
Dimensioning of IP Backbone
 
Broadband Connectivity for Indonesia
Broadband Connectivity for IndonesiaBroadband Connectivity for Indonesia
Broadband Connectivity for Indonesia
 
PT Eigen Network - Network Planning & Overview
PT Eigen Network - Network Planning & OverviewPT Eigen Network - Network Planning & Overview
PT Eigen Network - Network Planning & Overview
 
BlackBerry Services
BlackBerry ServicesBlackBerry Services
BlackBerry Services
 
Estimate of Internet Subscriber 2009
Estimate of Internet Subscriber 2009Estimate of Internet Subscriber 2009
Estimate of Internet Subscriber 2009
 
Population Distribution 2009
Population Distribution 2009Population Distribution 2009
Population Distribution 2009
 

Recently uploaded

Analysis insight about a Flyball dog competition team's performance
Analysis insight about a Flyball dog competition team's performanceAnalysis insight about a Flyball dog competition team's performance
Analysis insight about a Flyball dog competition team's performance
roli9797
 
Population Growth in Bataan: The effects of population growth around rural pl...
Population Growth in Bataan: The effects of population growth around rural pl...Population Growth in Bataan: The effects of population growth around rural pl...
Population Growth in Bataan: The effects of population growth around rural pl...
Bill641377
 
Everything you wanted to know about LIHTC
Everything you wanted to know about LIHTCEverything you wanted to know about LIHTC
Everything you wanted to know about LIHTC
Roger Valdez
 
一比一原版(Harvard毕业证书)哈佛大学毕业证如何办理
一比一原版(Harvard毕业证书)哈佛大学毕业证如何办理一比一原版(Harvard毕业证书)哈佛大学毕业证如何办理
一比一原版(Harvard毕业证书)哈佛大学毕业证如何办理
zsjl4mimo
 
一比一原版(Chester毕业证书)切斯特大学毕业证如何办理
一比一原版(Chester毕业证书)切斯特大学毕业证如何办理一比一原版(Chester毕业证书)切斯特大学毕业证如何办理
一比一原版(Chester毕业证书)切斯特大学毕业证如何办理
74nqk8xf
 
06-12-2024-BudapestDataForum-BuildingReal-timePipelineswithFLaNK AIM
06-12-2024-BudapestDataForum-BuildingReal-timePipelineswithFLaNK AIM06-12-2024-BudapestDataForum-BuildingReal-timePipelineswithFLaNK AIM
06-12-2024-BudapestDataForum-BuildingReal-timePipelineswithFLaNK AIM
Timothy Spann
 
Predictably Improve Your B2B Tech Company's Performance by Leveraging Data
Predictably Improve Your B2B Tech Company's Performance by Leveraging DataPredictably Improve Your B2B Tech Company's Performance by Leveraging Data
Predictably Improve Your B2B Tech Company's Performance by Leveraging Data
Kiwi Creative
 
STATATHON: Unleashing the Power of Statistics in a 48-Hour Knowledge Extravag...
STATATHON: Unleashing the Power of Statistics in a 48-Hour Knowledge Extravag...STATATHON: Unleashing the Power of Statistics in a 48-Hour Knowledge Extravag...
STATATHON: Unleashing the Power of Statistics in a 48-Hour Knowledge Extravag...
sameer shah
 
DSSML24_tspann_CodelessGenerativeAIPipelines
DSSML24_tspann_CodelessGenerativeAIPipelinesDSSML24_tspann_CodelessGenerativeAIPipelines
DSSML24_tspann_CodelessGenerativeAIPipelines
Timothy Spann
 
Influence of Marketing Strategy and Market Competition on Business Plan
Influence of Marketing Strategy and Market Competition on Business PlanInfluence of Marketing Strategy and Market Competition on Business Plan
Influence of Marketing Strategy and Market Competition on Business Plan
jerlynmaetalle
 
The Building Blocks of QuestDB, a Time Series Database
The Building Blocks of QuestDB, a Time Series DatabaseThe Building Blocks of QuestDB, a Time Series Database
The Building Blocks of QuestDB, a Time Series Database
javier ramirez
 
一比一原版(UCSB文凭证书)圣芭芭拉分校毕业证如何办理
一比一原版(UCSB文凭证书)圣芭芭拉分校毕业证如何办理一比一原版(UCSB文凭证书)圣芭芭拉分校毕业证如何办理
一比一原版(UCSB文凭证书)圣芭芭拉分校毕业证如何办理
nuttdpt
 
Palo Alto Cortex XDR presentation .......
Palo Alto Cortex XDR presentation .......Palo Alto Cortex XDR presentation .......
Palo Alto Cortex XDR presentation .......
Sachin Paul
 
一比一原版(UO毕业证)渥太华大学毕业证如何办理
一比一原版(UO毕业证)渥太华大学毕业证如何办理一比一原版(UO毕业证)渥太华大学毕业证如何办理
一比一原版(UO毕业证)渥太华大学毕业证如何办理
aqzctr7x
 
Udemy_2024_Global_Learning_Skills_Trends_Report (1).pdf
Udemy_2024_Global_Learning_Skills_Trends_Report (1).pdfUdemy_2024_Global_Learning_Skills_Trends_Report (1).pdf
Udemy_2024_Global_Learning_Skills_Trends_Report (1).pdf
Fernanda Palhano
 
University of New South Wales degree offer diploma Transcript
University of New South Wales degree offer diploma TranscriptUniversity of New South Wales degree offer diploma Transcript
University of New South Wales degree offer diploma Transcript
soxrziqu
 
4th Modern Marketing Reckoner by MMA Global India & Group M: 60+ experts on W...
4th Modern Marketing Reckoner by MMA Global India & Group M: 60+ experts on W...4th Modern Marketing Reckoner by MMA Global India & Group M: 60+ experts on W...
4th Modern Marketing Reckoner by MMA Global India & Group M: 60+ experts on W...
Social Samosa
 
一比一原版(爱大毕业证书)爱丁堡大学毕业证如何办理
一比一原版(爱大毕业证书)爱丁堡大学毕业证如何办理一比一原版(爱大毕业证书)爱丁堡大学毕业证如何办理
一比一原版(爱大毕业证书)爱丁堡大学毕业证如何办理
g4dpvqap0
 
一比一原版(UCSF文凭证书)旧金山分校毕业证如何办理
一比一原版(UCSF文凭证书)旧金山分校毕业证如何办理一比一原版(UCSF文凭证书)旧金山分校毕业证如何办理
一比一原版(UCSF文凭证书)旧金山分校毕业证如何办理
nuttdpt
 
办(uts毕业证书)悉尼科技大学毕业证学历证书原版一模一样
办(uts毕业证书)悉尼科技大学毕业证学历证书原版一模一样办(uts毕业证书)悉尼科技大学毕业证学历证书原版一模一样
办(uts毕业证书)悉尼科技大学毕业证学历证书原版一模一样
apvysm8
 

Recently uploaded (20)

Analysis insight about a Flyball dog competition team's performance
Analysis insight about a Flyball dog competition team's performanceAnalysis insight about a Flyball dog competition team's performance
Analysis insight about a Flyball dog competition team's performance
 
Population Growth in Bataan: The effects of population growth around rural pl...
Population Growth in Bataan: The effects of population growth around rural pl...Population Growth in Bataan: The effects of population growth around rural pl...
Population Growth in Bataan: The effects of population growth around rural pl...
 
Everything you wanted to know about LIHTC
Everything you wanted to know about LIHTCEverything you wanted to know about LIHTC
Everything you wanted to know about LIHTC
 
一比一原版(Harvard毕业证书)哈佛大学毕业证如何办理
一比一原版(Harvard毕业证书)哈佛大学毕业证如何办理一比一原版(Harvard毕业证书)哈佛大学毕业证如何办理
一比一原版(Harvard毕业证书)哈佛大学毕业证如何办理
 
一比一原版(Chester毕业证书)切斯特大学毕业证如何办理
一比一原版(Chester毕业证书)切斯特大学毕业证如何办理一比一原版(Chester毕业证书)切斯特大学毕业证如何办理
一比一原版(Chester毕业证书)切斯特大学毕业证如何办理
 
06-12-2024-BudapestDataForum-BuildingReal-timePipelineswithFLaNK AIM
06-12-2024-BudapestDataForum-BuildingReal-timePipelineswithFLaNK AIM06-12-2024-BudapestDataForum-BuildingReal-timePipelineswithFLaNK AIM
06-12-2024-BudapestDataForum-BuildingReal-timePipelineswithFLaNK AIM
 
Predictably Improve Your B2B Tech Company's Performance by Leveraging Data
Predictably Improve Your B2B Tech Company's Performance by Leveraging DataPredictably Improve Your B2B Tech Company's Performance by Leveraging Data
Predictably Improve Your B2B Tech Company's Performance by Leveraging Data
 
STATATHON: Unleashing the Power of Statistics in a 48-Hour Knowledge Extravag...
STATATHON: Unleashing the Power of Statistics in a 48-Hour Knowledge Extravag...STATATHON: Unleashing the Power of Statistics in a 48-Hour Knowledge Extravag...
STATATHON: Unleashing the Power of Statistics in a 48-Hour Knowledge Extravag...
 
DSSML24_tspann_CodelessGenerativeAIPipelines
DSSML24_tspann_CodelessGenerativeAIPipelinesDSSML24_tspann_CodelessGenerativeAIPipelines
DSSML24_tspann_CodelessGenerativeAIPipelines
 
Influence of Marketing Strategy and Market Competition on Business Plan
Influence of Marketing Strategy and Market Competition on Business PlanInfluence of Marketing Strategy and Market Competition on Business Plan
Influence of Marketing Strategy and Market Competition on Business Plan
 
The Building Blocks of QuestDB, a Time Series Database
The Building Blocks of QuestDB, a Time Series DatabaseThe Building Blocks of QuestDB, a Time Series Database
The Building Blocks of QuestDB, a Time Series Database
 
一比一原版(UCSB文凭证书)圣芭芭拉分校毕业证如何办理
一比一原版(UCSB文凭证书)圣芭芭拉分校毕业证如何办理一比一原版(UCSB文凭证书)圣芭芭拉分校毕业证如何办理
一比一原版(UCSB文凭证书)圣芭芭拉分校毕业证如何办理
 
Palo Alto Cortex XDR presentation .......
Palo Alto Cortex XDR presentation .......Palo Alto Cortex XDR presentation .......
Palo Alto Cortex XDR presentation .......
 
一比一原版(UO毕业证)渥太华大学毕业证如何办理
一比一原版(UO毕业证)渥太华大学毕业证如何办理一比一原版(UO毕业证)渥太华大学毕业证如何办理
一比一原版(UO毕业证)渥太华大学毕业证如何办理
 
Udemy_2024_Global_Learning_Skills_Trends_Report (1).pdf
Udemy_2024_Global_Learning_Skills_Trends_Report (1).pdfUdemy_2024_Global_Learning_Skills_Trends_Report (1).pdf
Udemy_2024_Global_Learning_Skills_Trends_Report (1).pdf
 
University of New South Wales degree offer diploma Transcript
University of New South Wales degree offer diploma TranscriptUniversity of New South Wales degree offer diploma Transcript
University of New South Wales degree offer diploma Transcript
 
4th Modern Marketing Reckoner by MMA Global India & Group M: 60+ experts on W...
4th Modern Marketing Reckoner by MMA Global India & Group M: 60+ experts on W...4th Modern Marketing Reckoner by MMA Global India & Group M: 60+ experts on W...
4th Modern Marketing Reckoner by MMA Global India & Group M: 60+ experts on W...
 
一比一原版(爱大毕业证书)爱丁堡大学毕业证如何办理
一比一原版(爱大毕业证书)爱丁堡大学毕业证如何办理一比一原版(爱大毕业证书)爱丁堡大学毕业证如何办理
一比一原版(爱大毕业证书)爱丁堡大学毕业证如何办理
 
一比一原版(UCSF文凭证书)旧金山分校毕业证如何办理
一比一原版(UCSF文凭证书)旧金山分校毕业证如何办理一比一原版(UCSF文凭证书)旧金山分校毕业证如何办理
一比一原版(UCSF文凭证书)旧金山分校毕业证如何办理
 
办(uts毕业证书)悉尼科技大学毕业证学历证书原版一模一样
办(uts毕业证书)悉尼科技大学毕业证学历证书原版一模一样办(uts毕业证书)悉尼科技大学毕业证学历证书原版一模一样
办(uts毕业证书)悉尼科技大学毕业证学历证书原版一模一样
 

Network Development & Statistics (Addendum B)

  • 1. Network Development & Statistics (Addendum B) Indonesian Telecom Market Facts and Numbers: Charts & Tables 2006-2008 [HR.CTD006b.V1U1-2009] Dr.-Ing. Eueung Mulyana @ Harewos Research 11/6/2009 http://www.ligarvirtual.com/harewos
  • 2. Network Development & Statistics (Addendum B) Harewos.Research http://www.ligarvirtual.com/harewos Nov. 6 2 Contents List of Figures & Tables........................................................................................................ 3 Operators’ Network Capacity ............................................................................................... 5 Capacity Utilization .............................................................................................................. 8 Telkomsel............................................................................................................................. 11 Indosat ................................................................................................................................. 12 Excelcomindo ....................................................................................................................... 13 Mobile-8................................................................................................................................ 14 Natrindo (NTS).................................................................................................................... 15 Sampoerna (STI).................................................................................................................. 16 Hutchison (HCPT)............................................................................................................... 17 Smart Telecom..................................................................................................................... 18 Telkom FWA........................................................................................................................ 19 Indosat FWA........................................................................................................................ 20 Bakrie Telecom.................................................................................................................... 21 Mobile-8 FWA...................................................................................................................... 22 Telkom FWL/PSTN ............................................................................................................. 23 Indosat FWL/PSTN ............................................................................................................. 24 BBT ...................................................................................................................................... 25 Abbreviations & Notes ........................................................................................................ 26
  • 3. Network Development & Statistics (Addendum B) Harewos.Research http://www.ligarvirtual.com/harewos Nov. 6 3 List of Figures & Tables Figure 1 Mobile Network Capacity 2006-2008 (All Operators) .......................................... 6 Figure 2 FWA Network Capacity 2006-2008 (All Operators) ............................................. 6 Figure 3 FWL Network Capacity 2006-2008 (All Operators) ............................................. 7 Figure 4 Mobile Network Capacity Utilization 2006-2008 ................................................. 9 Figure 5 FWA Network Capacity Utilization 2006-2008 .................................................... 9 Figure 6 FWL Network Capacity Utilization 2006-2008 .................................................. 10 Figure 7 TSEL’s Network Capacity & Subscribers ........................................................... 11 Figure 8 TSEL’s Network Capacity Utilization................................................................. 11 Figure 9 ISAT’s Network Capacity & Subscribers ............................................................ 12 Figure 10 ISAT’s Network Capacity Utilization................................................................ 12 Figure 11 XL’s Network Capacity & Subscribers.............................................................. 13 Figure 12 XL’s Network Capacity Utilization ................................................................... 13 Figure 13 M8’s Network Capacity & Subscribers.............................................................. 14 Figure 14 M8’s Network Capacity Utilization................................................................... 14 Figure 15 NTS’s Network Capacity & Subscribers ........................................................... 15 Figure 16 NTS’s Network Capacity Utilization................................................................. 15 Figure 17 STI’s Network Capacity & Subscribers............................................................. 16 Figure 18 STI’s Network Capacity Utilization .................................................................. 16 Figure 19 HCPT’s Network Capacity & Subscribers......................................................... 17 Figure 20 HCPT’s Network Capacity Utilization.............................................................. 17 Figure 21 Smart’s Network Capacity & Subscribers......................................................... 18 Figure 22 Smart’s Network Capacity Utilization.............................................................. 18 Figure 23 Telkom’s FWA Network Capacity & Subscribers............................................. 19 Figure 24 Telkom’s FWA Network Capacity Utilization .................................................. 19 Figure 25 ISAT’s FWA Network Capacity & Subscribers................................................. 20 Figure 26 ISAT’s FWA Network Capacity Utilization ...................................................... 20 Figure 27 BTEL’s Network Capacity & Subscribers......................................................... 21 Figure 28 BTEL’s Network Capacity Utilization .............................................................. 21 Figure 29 Telkom’s FWL Network Capacity & Subscribers ............................................. 23 Figure 30 Telkom’s FWL Network Capacity Utilization................................................... 23 Figure 31 ISAT’s FWL Network Capacity & Subscribers................................................. 24 Figure 32 ISAT’s FWL Network Capacity Utilization ...................................................... 24 Figure 33 BBT’s Network Capacity & Subscribers ........................................................... 25 Figure 34 BBT’s Network Capacity Utilization................................................................. 25
  • 4. Network Development & Statistics (Addendum B) Harewos.Research http://www.ligarvirtual.com/harewos Nov. 6 4 Table 1 Mobile Operators’ Network Capacity (2006-2008) ................................................. 5 Table 2 FWA Operators’ Network Capacity (2006-2008).................................................... 5 Table 3 FWL Operators’ Network Capacity (2006-2008) .................................................... 5 Table 4 Mobile Network Capacity Utilization (All Operators) - Percentage...................... 8 Table 5 FWA Network Capacity Utilization (All Operators) - Percentage ........................ 8 Table 6 FWL Network Capacity Utilization (All Operators) - Percentage......................... 8 Table 7 Capacity, #Subscribers and Capacity Utilization of M8’s FWA Network........... 22
  • 5. Network Development & Statistics (Addendum B) Harewos.Research http://www.ligarvirtual.com/harewos Nov. 6 5 Operators’ Network Capacity    2006E  2007E  2008E  TSEL  38,800,000  50,500,000  67,300,000  ISAT  28,557,254  35,230,280  45,651,920  XL  12,520,054  30,045,325  46,645,061  M8  2,000,000 (e)  4,500,000 (e)  7,748,400  NTS  257,481  1,451,085  4,719,107  STI  241,500  488,000  1,494,134  HCPT  132,600  3,000,000 (e)  6,000,000 (e)  Smart  200,000  1,470,000  3,300,000  Table 1 Mobile Operators’ Network Capacity (2006-2008)   2006E  2007E  2008E  TLKM FWA  7,698,039  9,383,924  19,861,324  ISAT FWA  2,365,000  3,403,900  3,771,400  BTEL  2,141,667  7,200,000  13,251,700  M8      1,497,600  Table 2 FWA Operators’ Network Capacity (2006-2008)   2006E  2007E  2008E  TLKM FWL  9,634,910  9,704,576  9,838,537  ISAT FWL  64,179 (*)  80,880  91,290  BBT  5,388  5,404  5,404          Table 3 FWL Operators’ Network Capacity (2006-2008)
  • 6. No Harew http:// ov. 6 wos.Resear /www.ligar Figure 1 Figure 8 6 1 6,102,1 rch rvirtual.com 1 Mobile N 2 FWA N 82,708,889 63,803,108 2006E 12,204,706 137 2006E m/harewos Network Network C Mobi Capac 19,98 Capac Network D Capacity Capacity 126,684,690 93,387,019 2007E ile/Cel city # 87,824 10,811,479 2007E FWA city # Developmen y 2006-200 2006-2008 0 llular #Subscribers #Subscribers nt & Statist 08 (All Op 8 (All Ope 182,858,62 140,548,22 2008E s 38,382,02 21,124,05 2008E s tics (Adden perators) erators) 22 29 4 7 ndum B) 6 )
  • 7. No Harew http:// ov. 6 wos.Resear /www.ligar Figure rch rvirtual.com 3 FWL N 9,704,477 8,738,343 2006E m/harewos etwork C FW Capac Network D Capacity 9,790,860 8,717,760 2007E WL/PST city # Developmen 2006-2008 TN #Subscribers nt & Statist 8 (All Ope 9,935,231 8,674,228 2008E s tics (Adden erators) 1 8 ndum B) 7
  • 8. Network Development & Statistics (Addendum B) Harewos.Research http://www.ligarvirtual.com/harewos Nov. 6 8 Capacity Utilization   2006E  2007E  2008E  TSEL  91.7  94.8  97.0  ISAT  58.5  69.7  80.0  XL  76.1  51.5  55.8  M8  91.3  67.0  34.5  NTS  4.9  0.3  68.5  STI  55.8  63.6  52.5  HCPT  0.0  68.0  75.0  Smart  0.0  7.8  46.4  Table 4 Mobile Network Capacity Utilization (All Operators) - Percentage   2006E  2007E  2008E  TLKM FWA  54.2  67.8  64.1  ISAT FWA  16.0  18.4  20.2  BTEL  72.3  53.1  55.1  M8        22.2  Table 5 FWA Network Capacity Utilization (All Operators) - Percentage   2006E  2007E  2008E  TLKM FWL  90.4  89.5  87.7  ISAT FWL  41.5  37.7  46.2  BBT  46.4  44.3  42.6          Table 6 FWL Network Capacity Utilization (All Operators) - Percentage
  • 9. No Harew http:// ov. 6 wos.Resear /www.ligar Figure Figur rch rvirtual.com e 4 Mobil re 5 FWA 77.14% 2006E Mobil 50.00% 2006E m/harewos e Networ A Network le/Cell FWA - Network D rk Capaci k Capacit 73.72% 2007E lular - 54.09% 2007E - Utiliz Developmen ity Utiliz ty Utiliza Utiliz % zation nt & Statist ation 200 ation 2006 76.86% 2008E zation 55.04% 2008E n tics (Adden 06-2008 6-2008 ndum B) 9
  • 10. No Harew http:// ov. 6 wos.Resear /www.ligar Figur rch rvirtual.com re 6 FWL 90.04% 2006E FW m/harewos Network WL/PST Network D k Capacit 89.04% 2007E TN - Ut Developmen ty Utiliza tilizat nt & Statist ation 2006 87.31% 2008E tion tics (Adden 6-2008 ndum B) 10
  • 11. No Harew http:// ov. 6 wos.Resear /www.ligar Fig F rch rvirtual.com gure 7 TS Figure 8 T 38,800,00 35,597,17 2006E 91.75% 2006E m/harewos SEL’s Net TSEL’s Ne 00 71 Capac Ut Network D work Cap etwork C 50,500,000 47,890,139 2007E TSEL city # 94.83% 2007E tilizati Developmen pacity & Capacity U 6 6 L #Subscribers ion nt & Statist Tel Subscrib Utilizatio 67,300,000 65,299,991 2008E s 97.03% 2008E tics (Adden lkom bers on ndum B) 11 msel
  • 12. No Harew http:// ov. 6 wos.Resear /www.ligar Fig F rch rvirtual.com gure 9 ISA igure 10 28,557,25 16,704,63 2006E 58.50% 2006E m/harewos AT’s Netw ISAT’s N 54 39 Capac Ut Network D work Cap etwork C 35,230,280 24,545,422 2007E ISAT city # 69.67% 2007E tilizati Developmen pacity & S Capacity U 4 3 #Subscribers ion nt & Statist I Subscrib Utilizatio 45,651,920 36,510,246 2008E s 79.98% 2008E tics (Adden Indo ers on ndum B) 12 osat
  • 13. No Harew http:// ov. 6 wos.Resear /www.ligar Fi F rch rvirtual.com igure 11 X Figure 12 12,520,05 9,527,97 2006E 76.10% 2006E m/harewos XL’s Netw 2 XL’s Ne 54 0 Capac Ut Network D work Cap twork Ca 30,045,325 15,469,000 2007E XL city # 51.49% 2007E tilizati Developmen Ex pacity & S apacity U 4 2 #Subscribers ion nt & Statist xcelc Subscribe Utilization 46,645,061 26,015,517 2008E s 55.77% 2008E tics (Adden omin ers n ndum B) 13 ndo
  • 14. No Harew http:// ov. 6 wos.Resear /www.ligar Fi F rch rvirtual.com igure 13 M Figure 14 2,000,00 1,825,90 2006E 91.30% 2006E m/harewos M8’s Netw 4 M8’s Ne 0 0 Capac Ut Network D work Cap etwork Ca 4,500,000 3,012,800 2007E M8 city # 66.95% 2007E tilizati Developmen pacity & S apacity U 7 2 #Subscribers ion nt & Statist M Subscribe Utilization 7,748,400 2,671,900 2008E s 34.48% 2008E tics (Adden Mobil ers n ndum B) 14 le-8
  • 15. No Harew http:// ov. 6 wos.Resear /www.ligar Fig F 1 rch rvirtual.com gure 15 N Figure 16 257,481 12,715 2006E 4.94% 2006E m/harewos NTS’s Netw NTS’s Ne 1 1,4 Capac Ut Network D work Cap etwork C 451,085 4,788 2007E NTS city # 0.33% 2007E tilizati Developmen Nat pacity & Capacity U 4 #Subscribers ion nt & Statist rind Subscrib Utilizatio 4,719,107 3,234 2008E s 68.55% 2008E tics (Adden o (NT bers on 4,800 ndum B) 15 TS)
  • 16. No Harew http:// ov. 6 wos.Resear /www.ligar Fig F 2 1 rch rvirtual.com gure 17 S Figure 18 241,500 134,713 2006E 55.78% 2006E m/harewos STI’s Netw 8 STI’s Ne Capac Ut Network D S work Cap etwork Ca 488,000 310, 2007E STI city # 63.62% 2007E tilizati Developmen Samp pacity & S apacity U ,464 #Subscribers ion nt & Statist poern Subscribe Utilizatio 1,494 784,3 2008E s 52.49% 2008E tics (Adden na (S ers n 4,134 343 ndum B) 16 STI)
  • 17. No Harew http:// ov. 6 wos.Resear /www.ligar Figu Fi rch rvirtual.com ure 19 HC igure 20 H 132,600 0 2006E 0.00% 2006E m/harewos CPT’s Ne HCPT’s N 0 3 Capac Ut Network D Hu twork Ca Network C ,000,000 2,0 2007E HCPT city # 67.98% 2007E tilizati Developmen utchi apacity & Capacity 6 039,406 T #Subscribers ion nt & Statist ison & Subscrib Utilizati 6,000,000 4,500 2008E s 75.01% 2008E tics (Adden (HCP bers on 0,609 ndum B) 17 PT)
  • 18. No Harew http:// ov. 6 wos.Resear /www.ligar Figu Fi rch rvirtual.com ure 21 Sm igure 22 S 200,000 0 2006E 0.00% 2006E m/harewos mart’s Ne Smart’s N 0 1,4 Capac Ut Network D twork Ca Network C 470,000 115,000 2007E Smart city # 7.82% 2007E tilizati Developmen Sma apacity & Capacity 3 t #Subscribers ion nt & Statist art T & Subscrib Utilizati 3,300,000 1,530 2008E s 46.39% 2008E tics (Adden Telec bers on 0,823 ndum B) 18 com
  • 19. No Harew http:// ov. 6 wos.Resear /www.ligar Figure Figur rch rvirtual.com 23 Telko re 24 Telk 7,698,03 4, 2006E 54.25% 2006E m/harewos om’s FWA kom’s FW 9 9 175,853 TL Capac Ut Network D A Network WA Netwo 9,383,924 6,362,844 2007E LKM-FW city # 67.81% 2007E tilizati Developmen T k Capacit rk Capac 1 1 WA #Subscribers ion nt & Statist Telko ty & Subs city Utiliz 19,861,324 12,725,425 2008E s 64.07% 2008E tics (Adden om FW scribers zation ndum B) 19 WA
  • 20. No Harew http:// ov. 6 wos.Resear /www.ligar Figur Figu rch rvirtual.com e 25 ISAT ure 26 ISA 2,365,00 378,727 2006E 16.01% 2006E m/harewos T’s FWA N AT’s FWA 0 3,4 7 IS Capac Ut Network D Network A Network 403,900 627,934 2007E AT-FW city # 18.45% 2007E tilizati Developmen In Capacity k Capacit 3 WA #Subscribers ion nt & Statist ndos y & Subsc ty Utiliza 3,771,400 761,589 2008E s 20.19% 2008E tics (Adden sat FW cribers ation ndum B) 20 WA
  • 21. No Harew http:// ov. 6 wos.Resear /www.ligar Figu Fi 1,54 rch rvirtual.com ure 27 BT igure 28 B 2,141,66 47,557 2006E 72.26% 2006E m/harewos TEL’s Net BTEL’s N 7 7,2 Se Ut Network D twork Ca Network C 200,000 3,820,701 2007E BTEL eries2 53.07% 2007E tilizati Developmen Bak apacity & Capacity 1 7 L Series3 ion nt & Statist krie T & Subscrib Utilizatio 13,251,700 7,304,543 2008E 55.12% 2008E tics (Adden Telec bers on ndum B) 21 com
  • 22. Network Development & Statistics (Addendum B) Harewos.Research http://www.ligarvirtual.com/harewos Nov. 6 22 Mobile-8 FWA   2006E  2007E  2008E  Capacity  ‐  ‐  1,497,600  #Subscribers  ‐  ‐  332,500  Utilization  ‐  ‐  22.2 %  Table 7 Capacity, #Subscribers and Capacity Utilization of M8’s FWA Network
  • 23. No Harew http:// ov. 6 wos.Resear /www.ligar Figure Figur 8,70 rch rvirtual.com 29 Telko re 30 Telk 9,634,91 09,211 2006E 90.39% 2006E m/harewos om’s FWL kom’s FW 0 TL Capac Ut Network D Tel Network WL Netwo 9,704,576 8,684,888 2007E LKM-FW city # 89.49% 2007E tilizati Developmen lkom k Capacit rk Capac 9 8 WL #Subscribers ion nt & Statist m FWL ty & Subs city Utiliz 9,838,537 8,629,783 2008E s 87.71% 2008E tics (Adden L/PS scribers zation ndum B) 23 STN
  • 24. No Harew http:// ov. 6 wos.Resear /www.ligar Figur Figu rch rvirtual.com e 31 ISAT ure 32 ISA 64,179 26,632 2006E 41.50% 2006E m/harewos T’s FWL N AT’s FWL IS Capac Ut Network D Ind Network L Network 80,880 30,479 2007E AT-FW city # 37.68% 2007E tilizati Developmen dosat Capacity k Capacit WL #Subscribers ion nt & Statist t FWL y & Subsc ty Utiliza 91,290 42,145 2008E s 46.17% 2008E tics (Adden L/PS cribers ation ndum B) 24 STN
  • 25. No Harew http:// ov. 6 wos.Resear /www.ligar Fig F rch rvirtual.com gure 33 B Figure 34 5,388 2,500 2006E 46.40% 2006E m/harewos BBT’s Net BBT’s Ne Capac Ut Network D work Cap etwork C 5,404 2,393 2007E BBT city # 44.28% 2007E tilizati Developmen pacity & Capacity U #Subscribers ion nt & Statist Subscrib Utilizatio 5,404 2,300 2008E s 42.56% 2008E tics (Adden B bers on ndum B) 25 BBT
  • 26. Network Development & Statistics (Addendum B) Harewos.Research http://www.ligarvirtual.com/harewos Nov. 6 26 Abbreviations & Notes FWA Fixed Wireless Access FWL Fixed Wire-Line PSTN Public Switched Telephone Network TLKM PT. Telekomunikasi Indonesia / PT. Telkom Indonesia ISAT PT. Indosat XL PT. Excelcomindo Pratama M-8 / M8 PT. Mobile-8 BTEL PT. Bakrie Telecom TSEL PT. Telekomunikasi Selular (Telkomsel) STI PT. Sampoerna Telekomunikasi Indonesia NTS PT. Natrindo Telepon Selular HCPT PT. Hutchison CP Telecommunication Smart PT. Smart Telecom BBT PT. Batam Bintan Telekomunikasi (e) As used in e.g. Table 1 It refers to estimated values 2008E End of year 2008