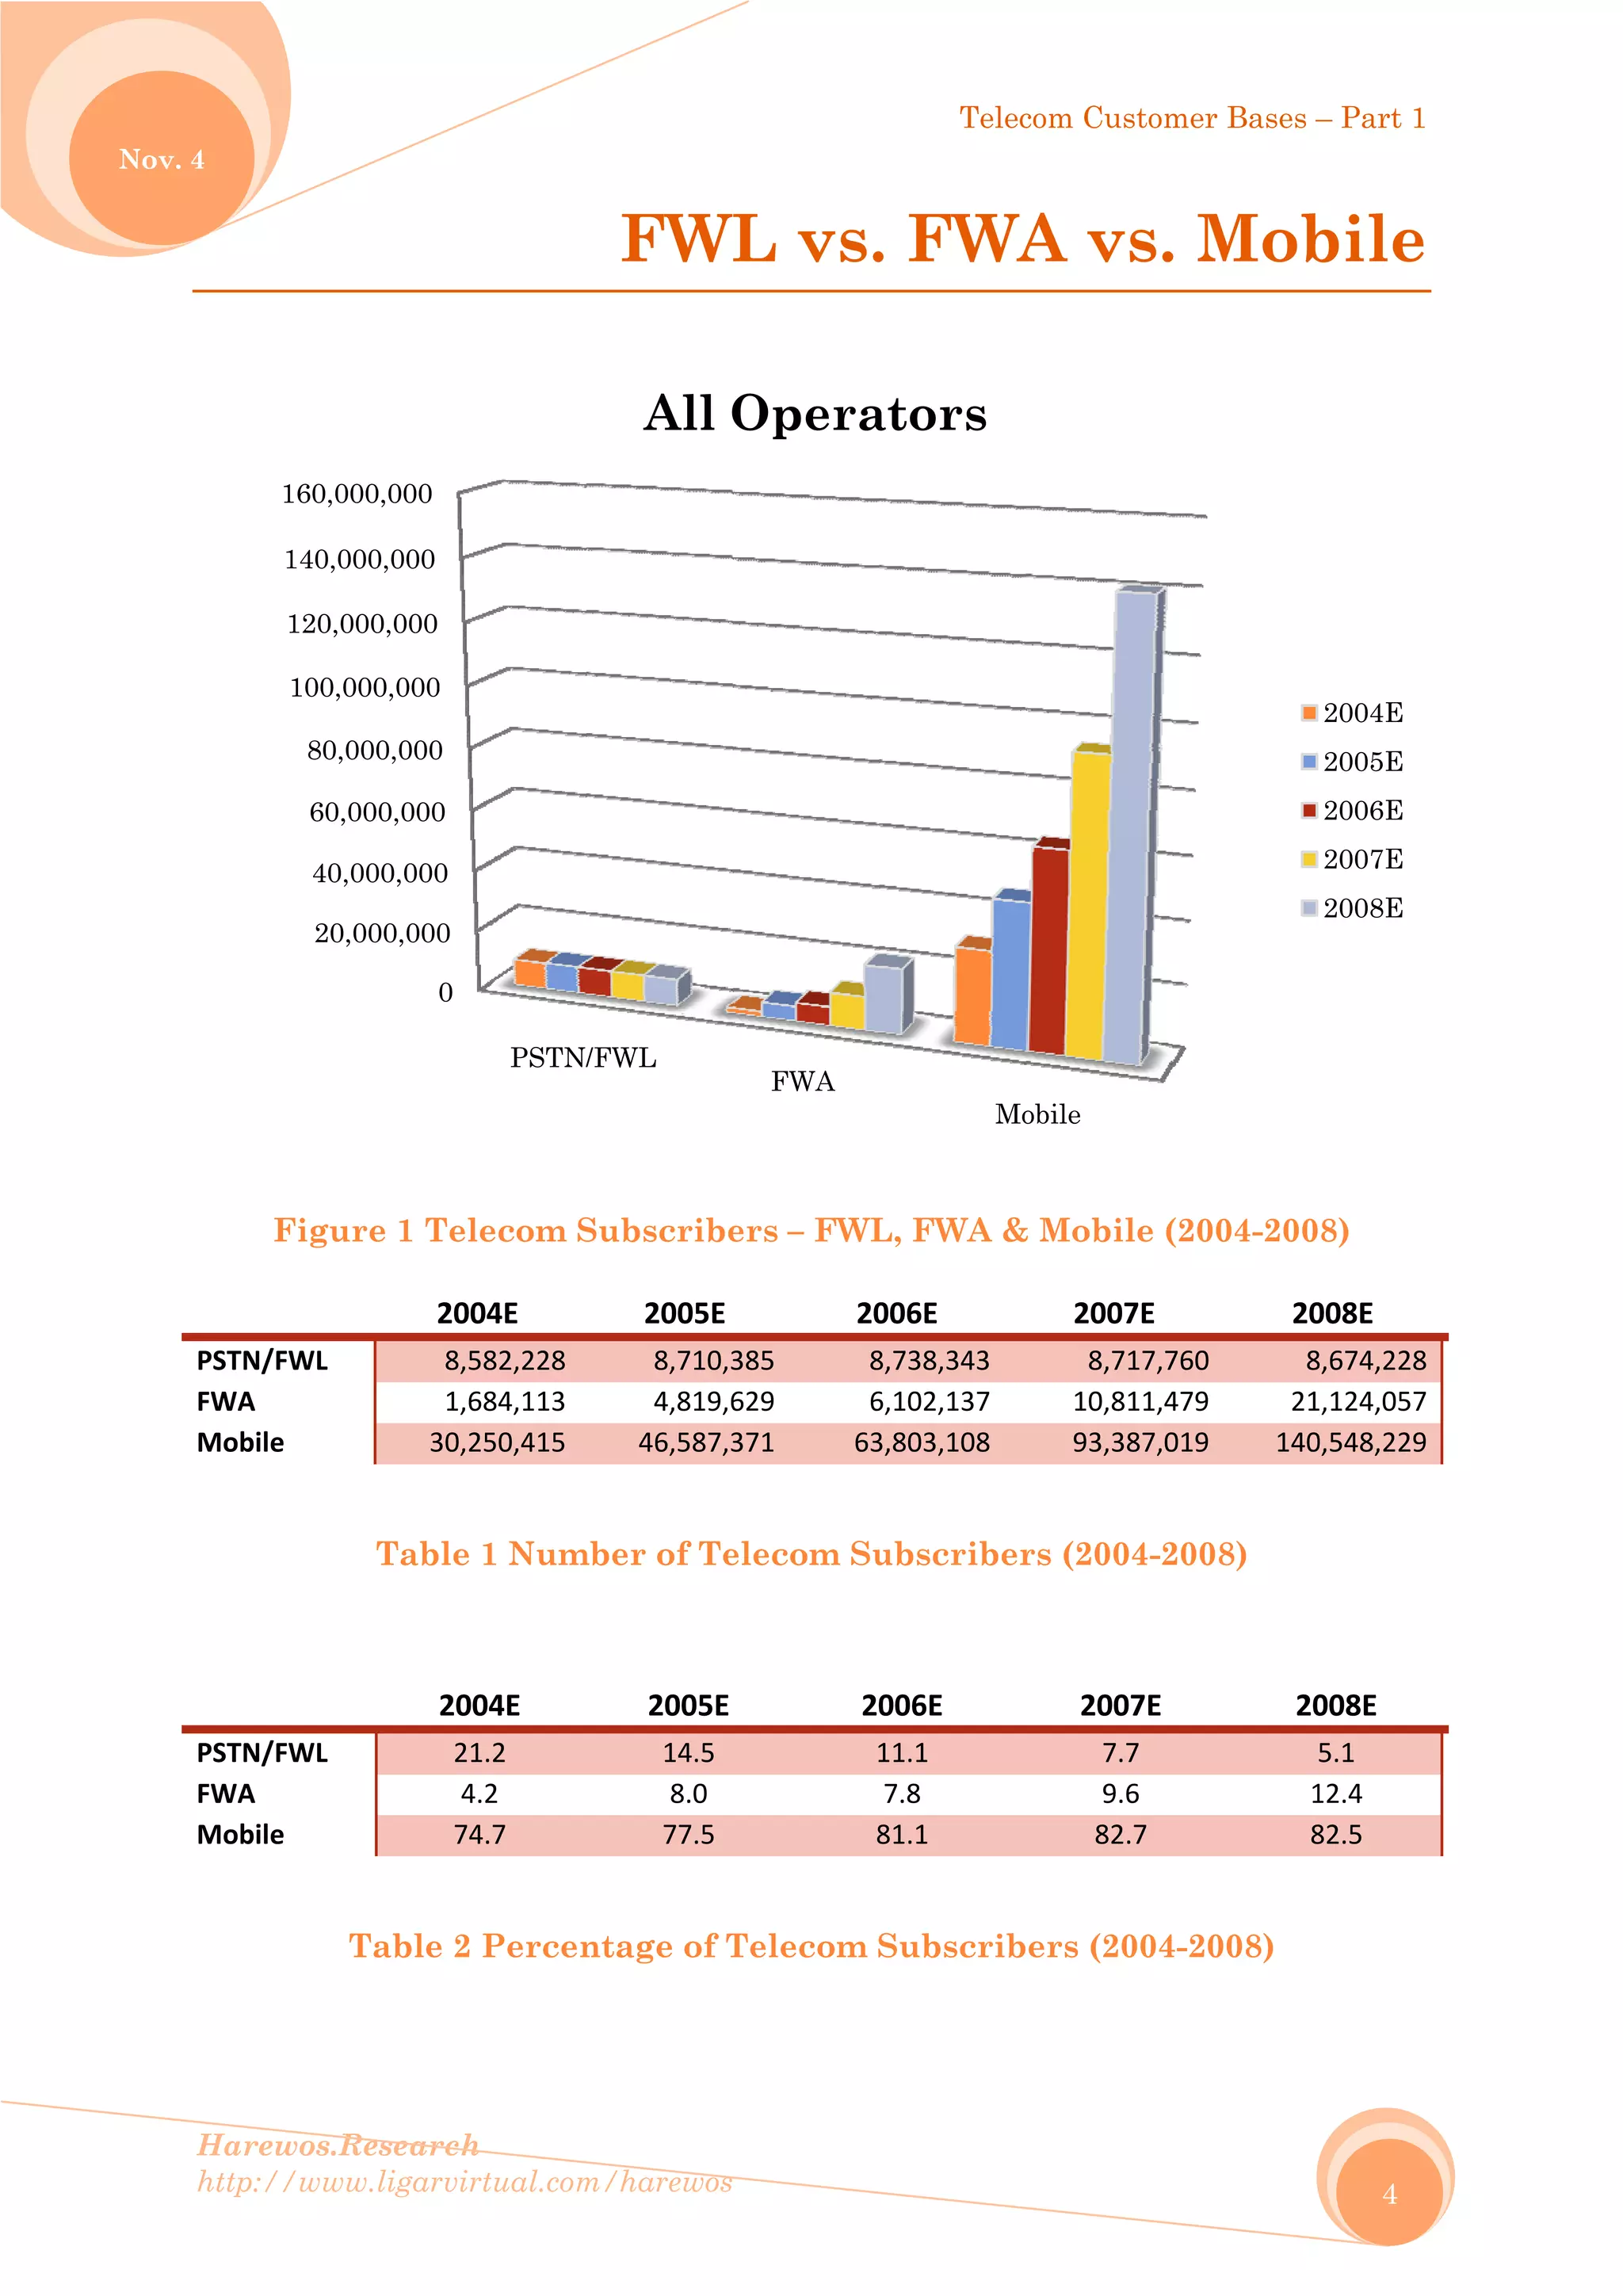
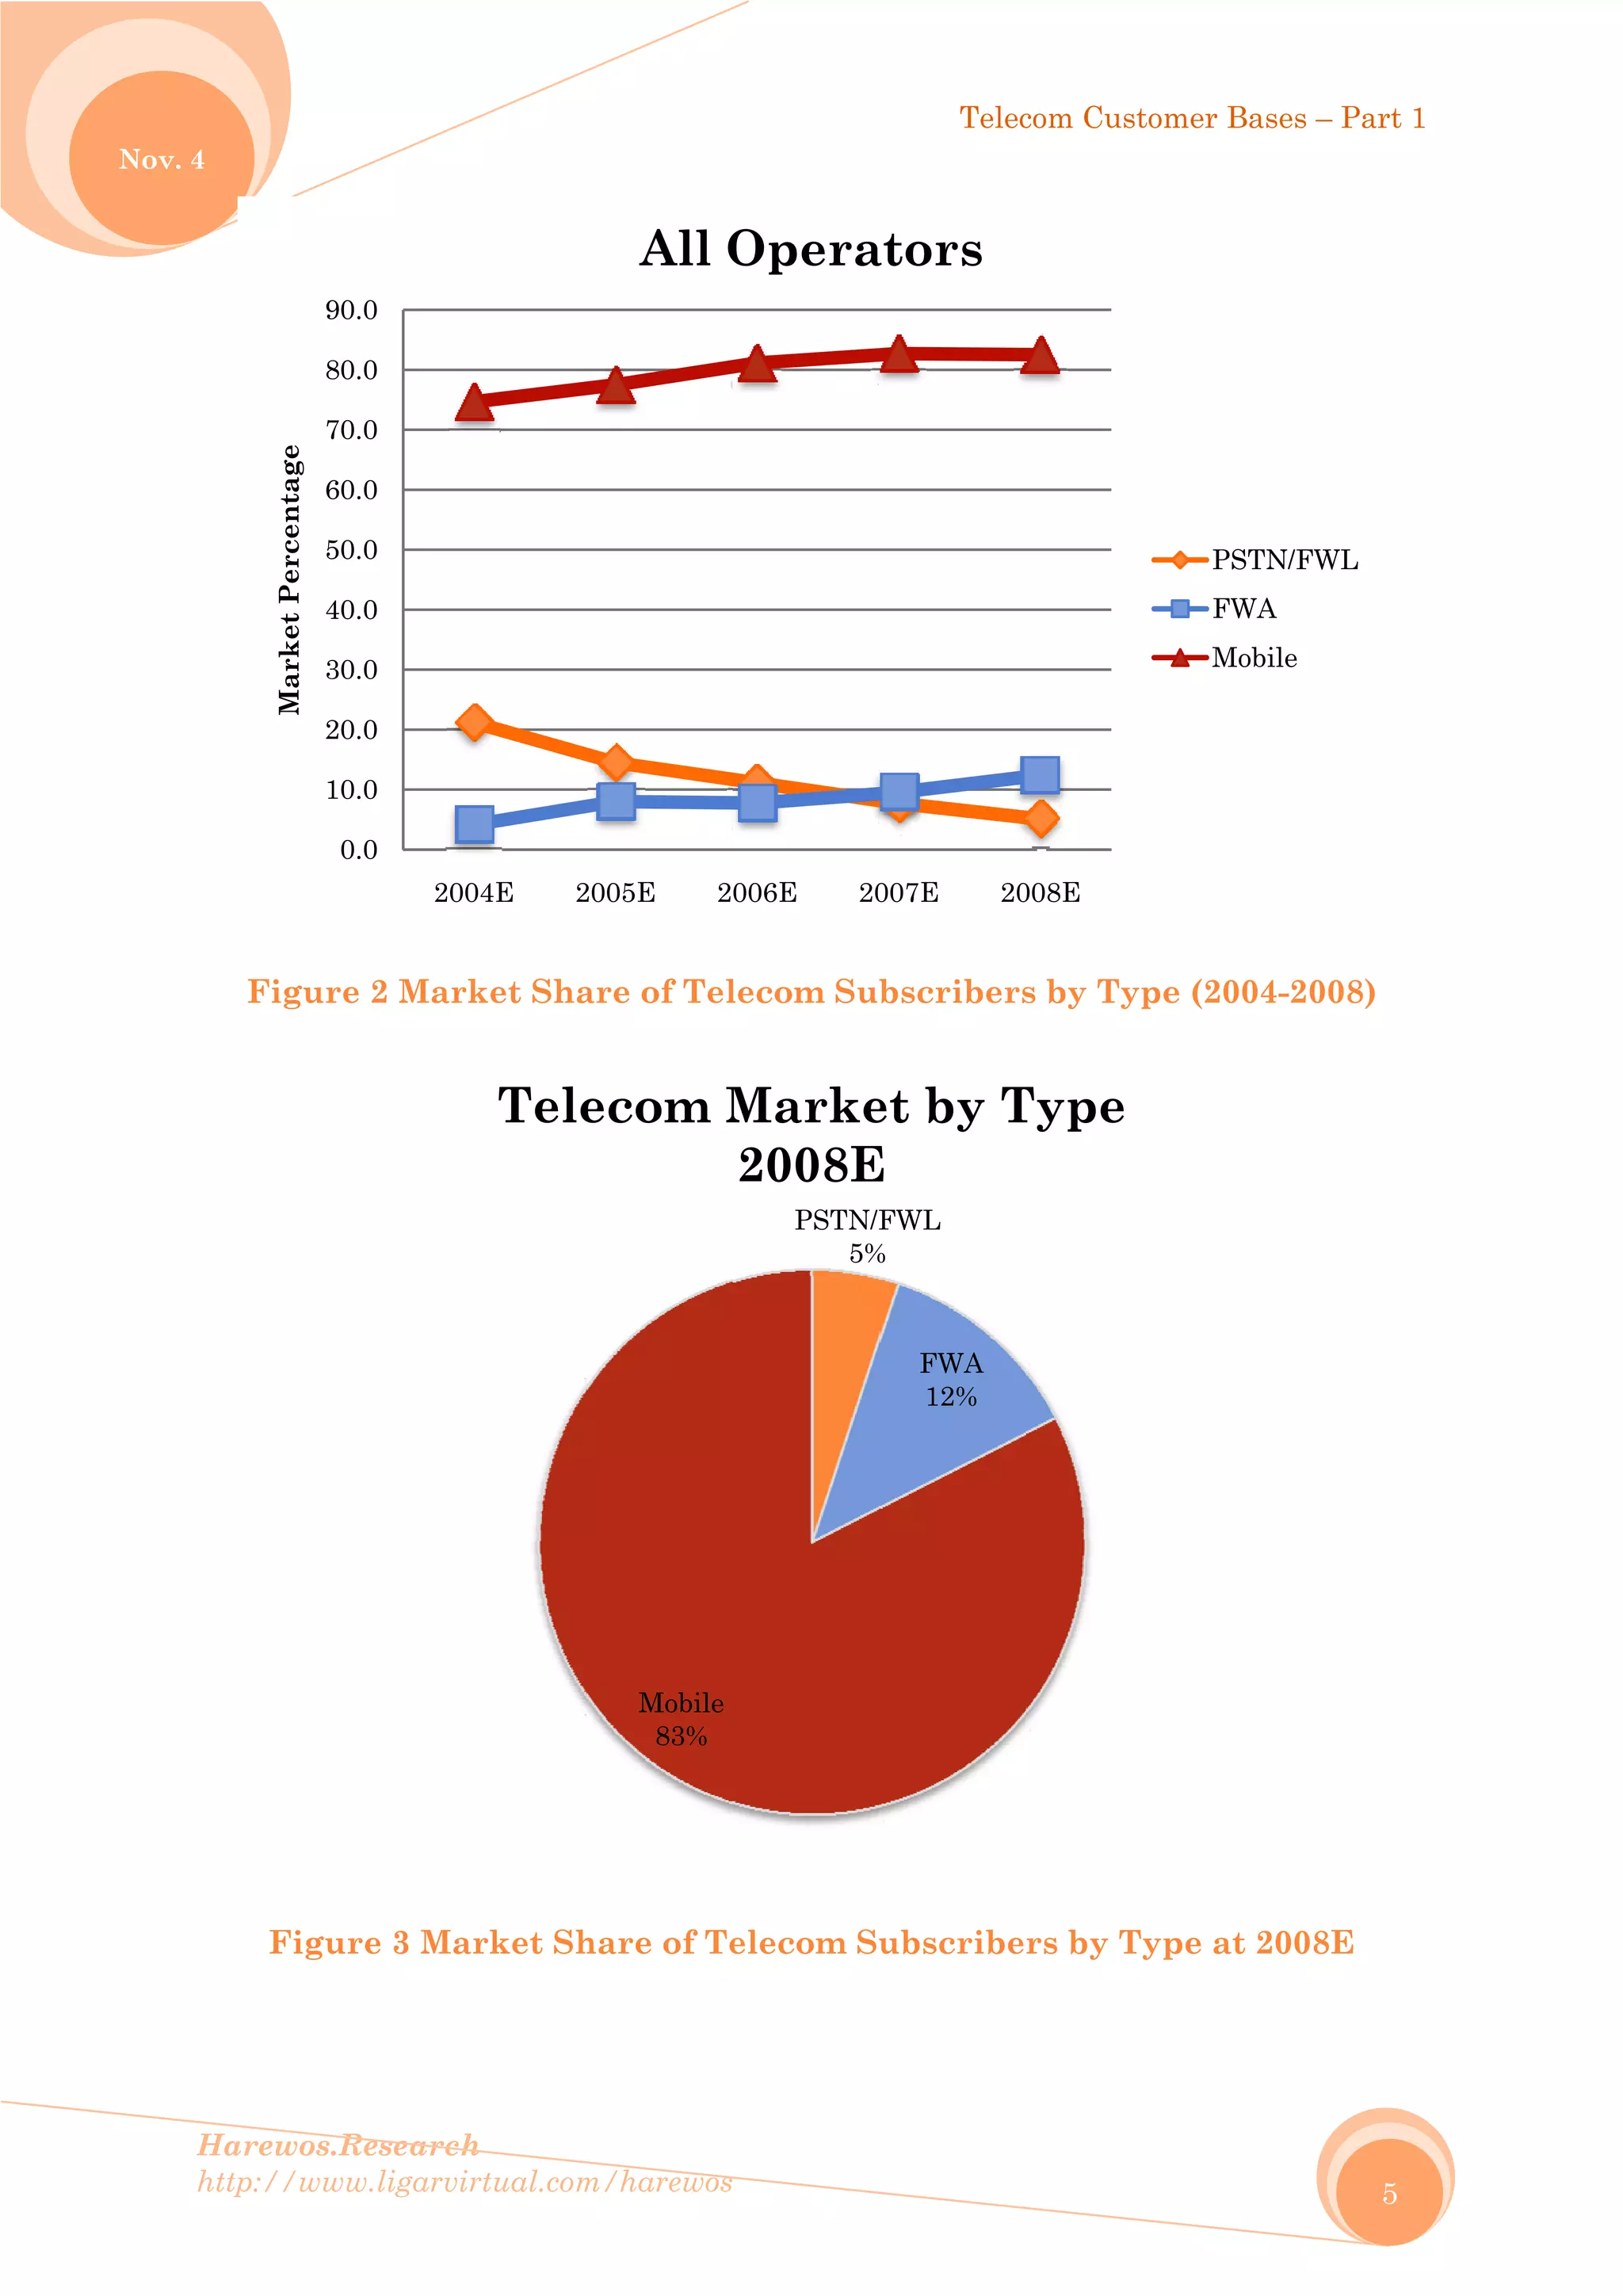
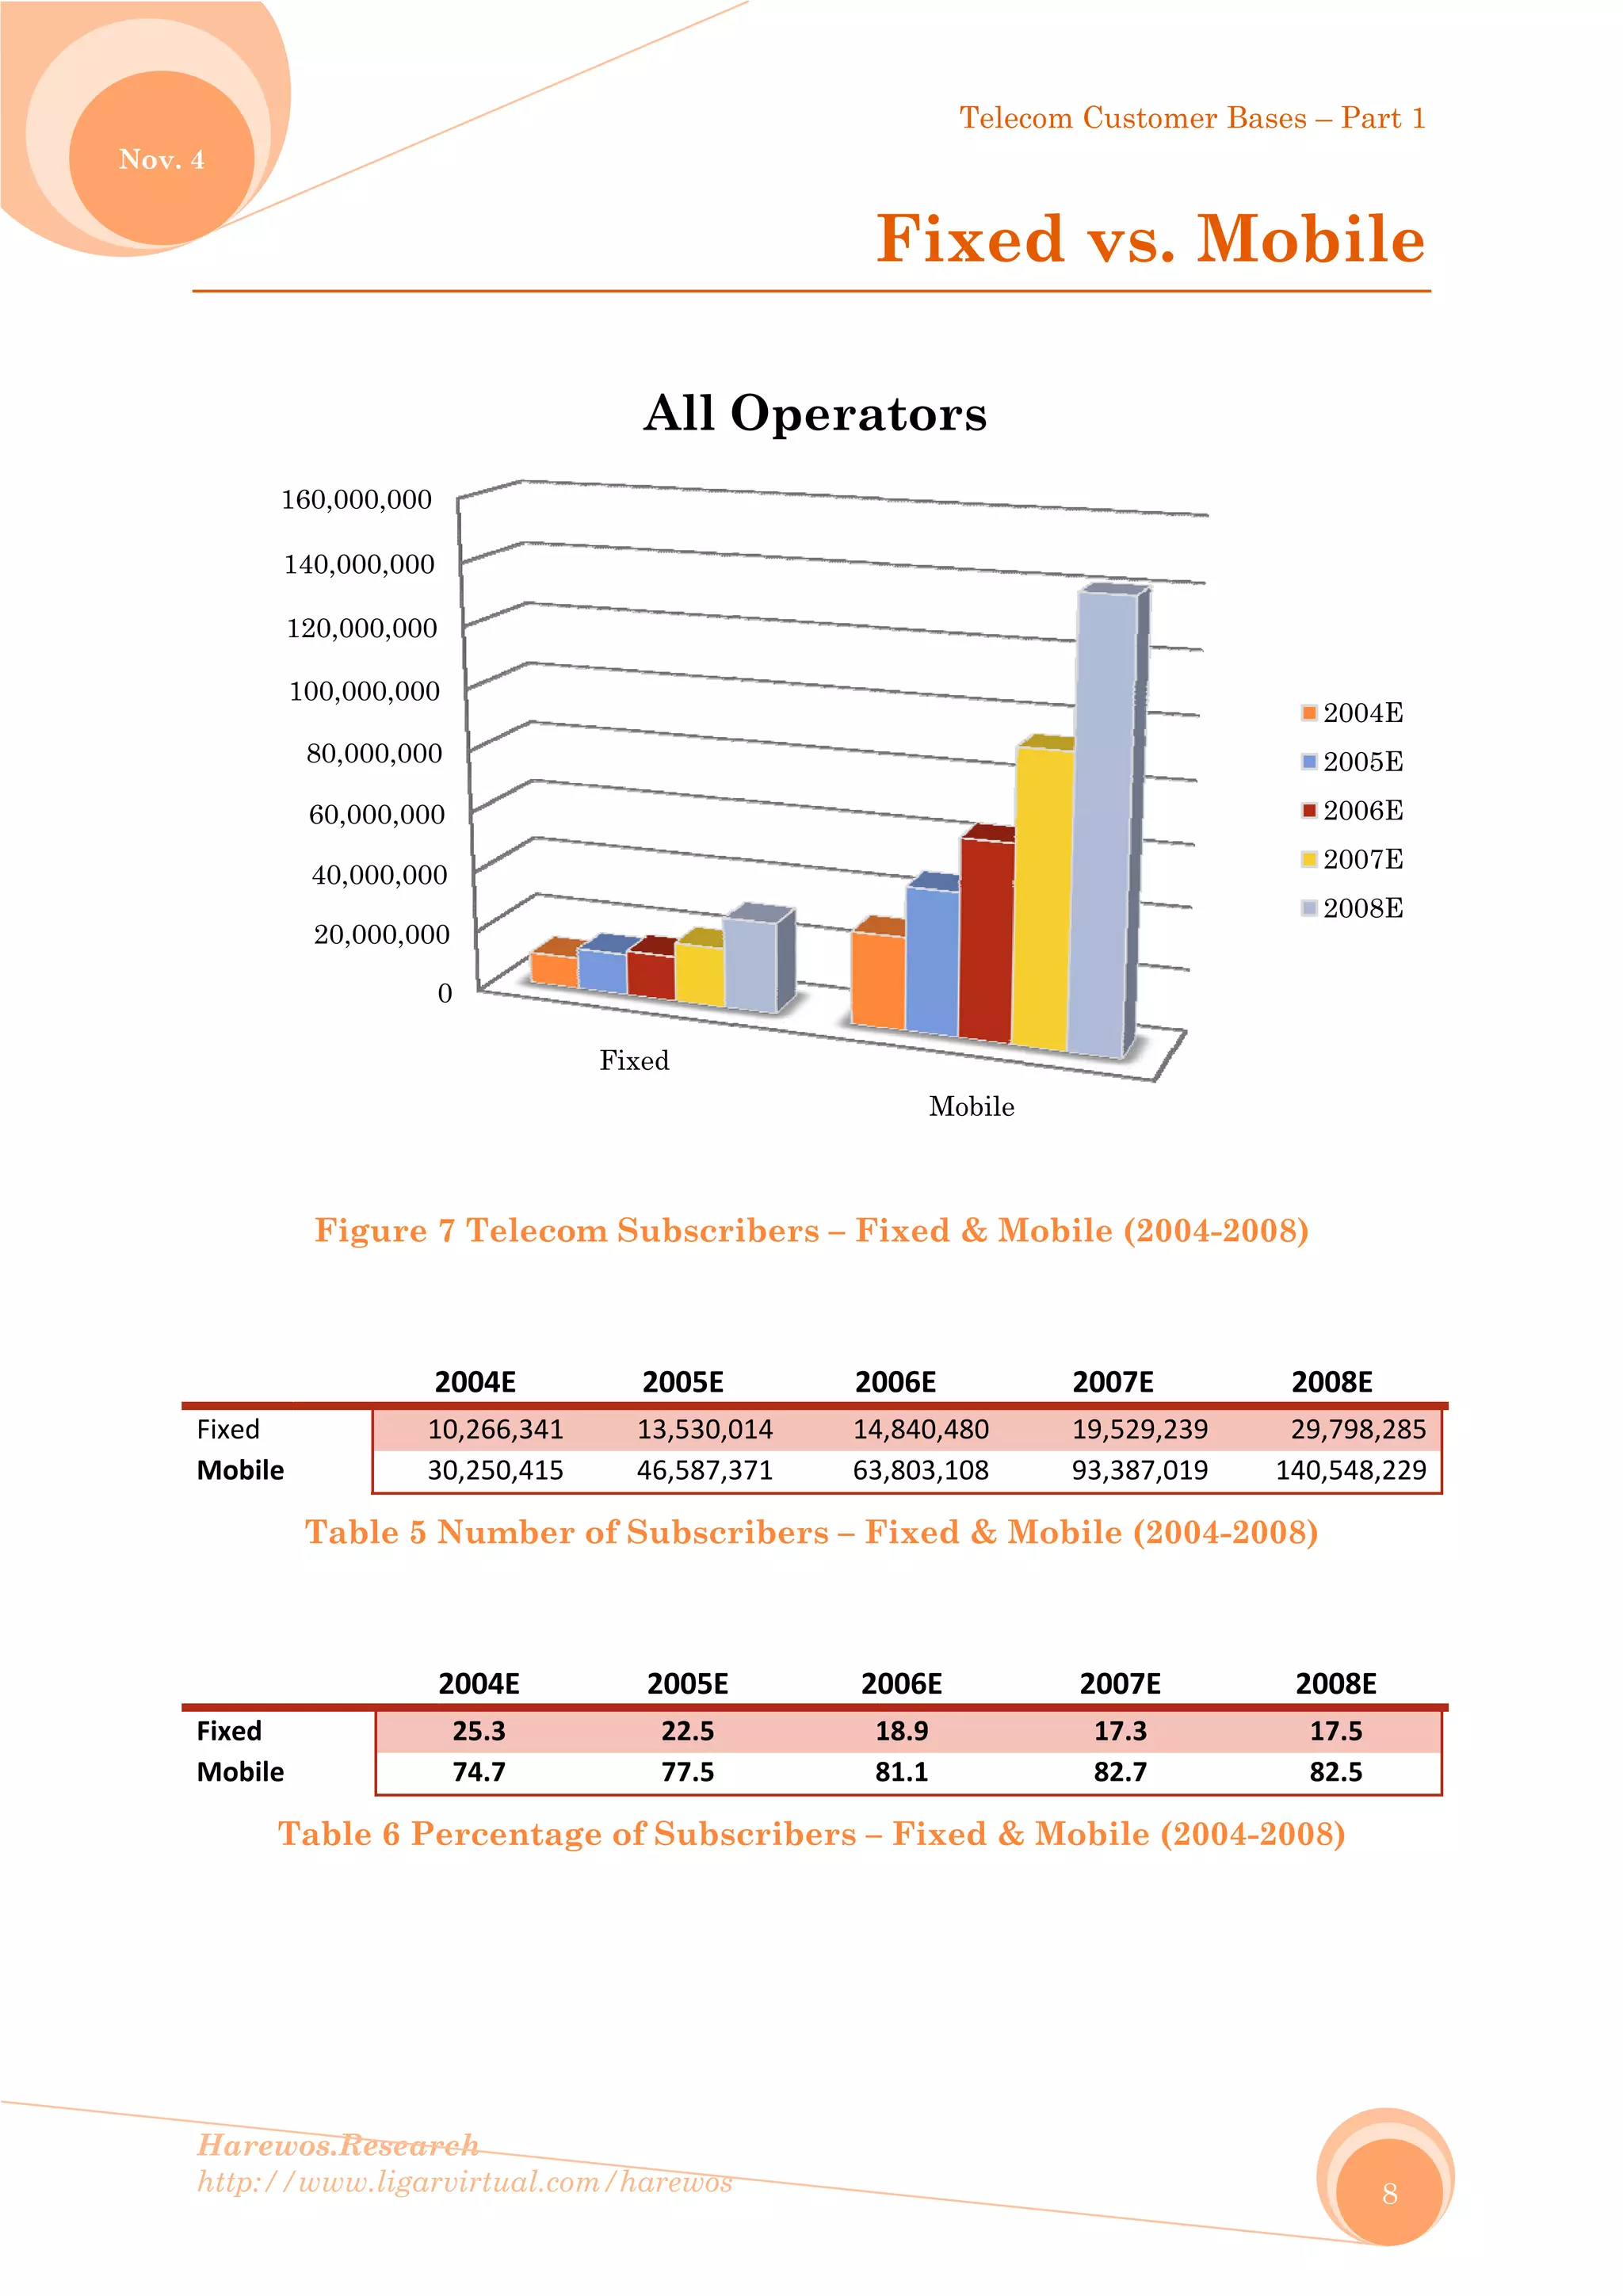
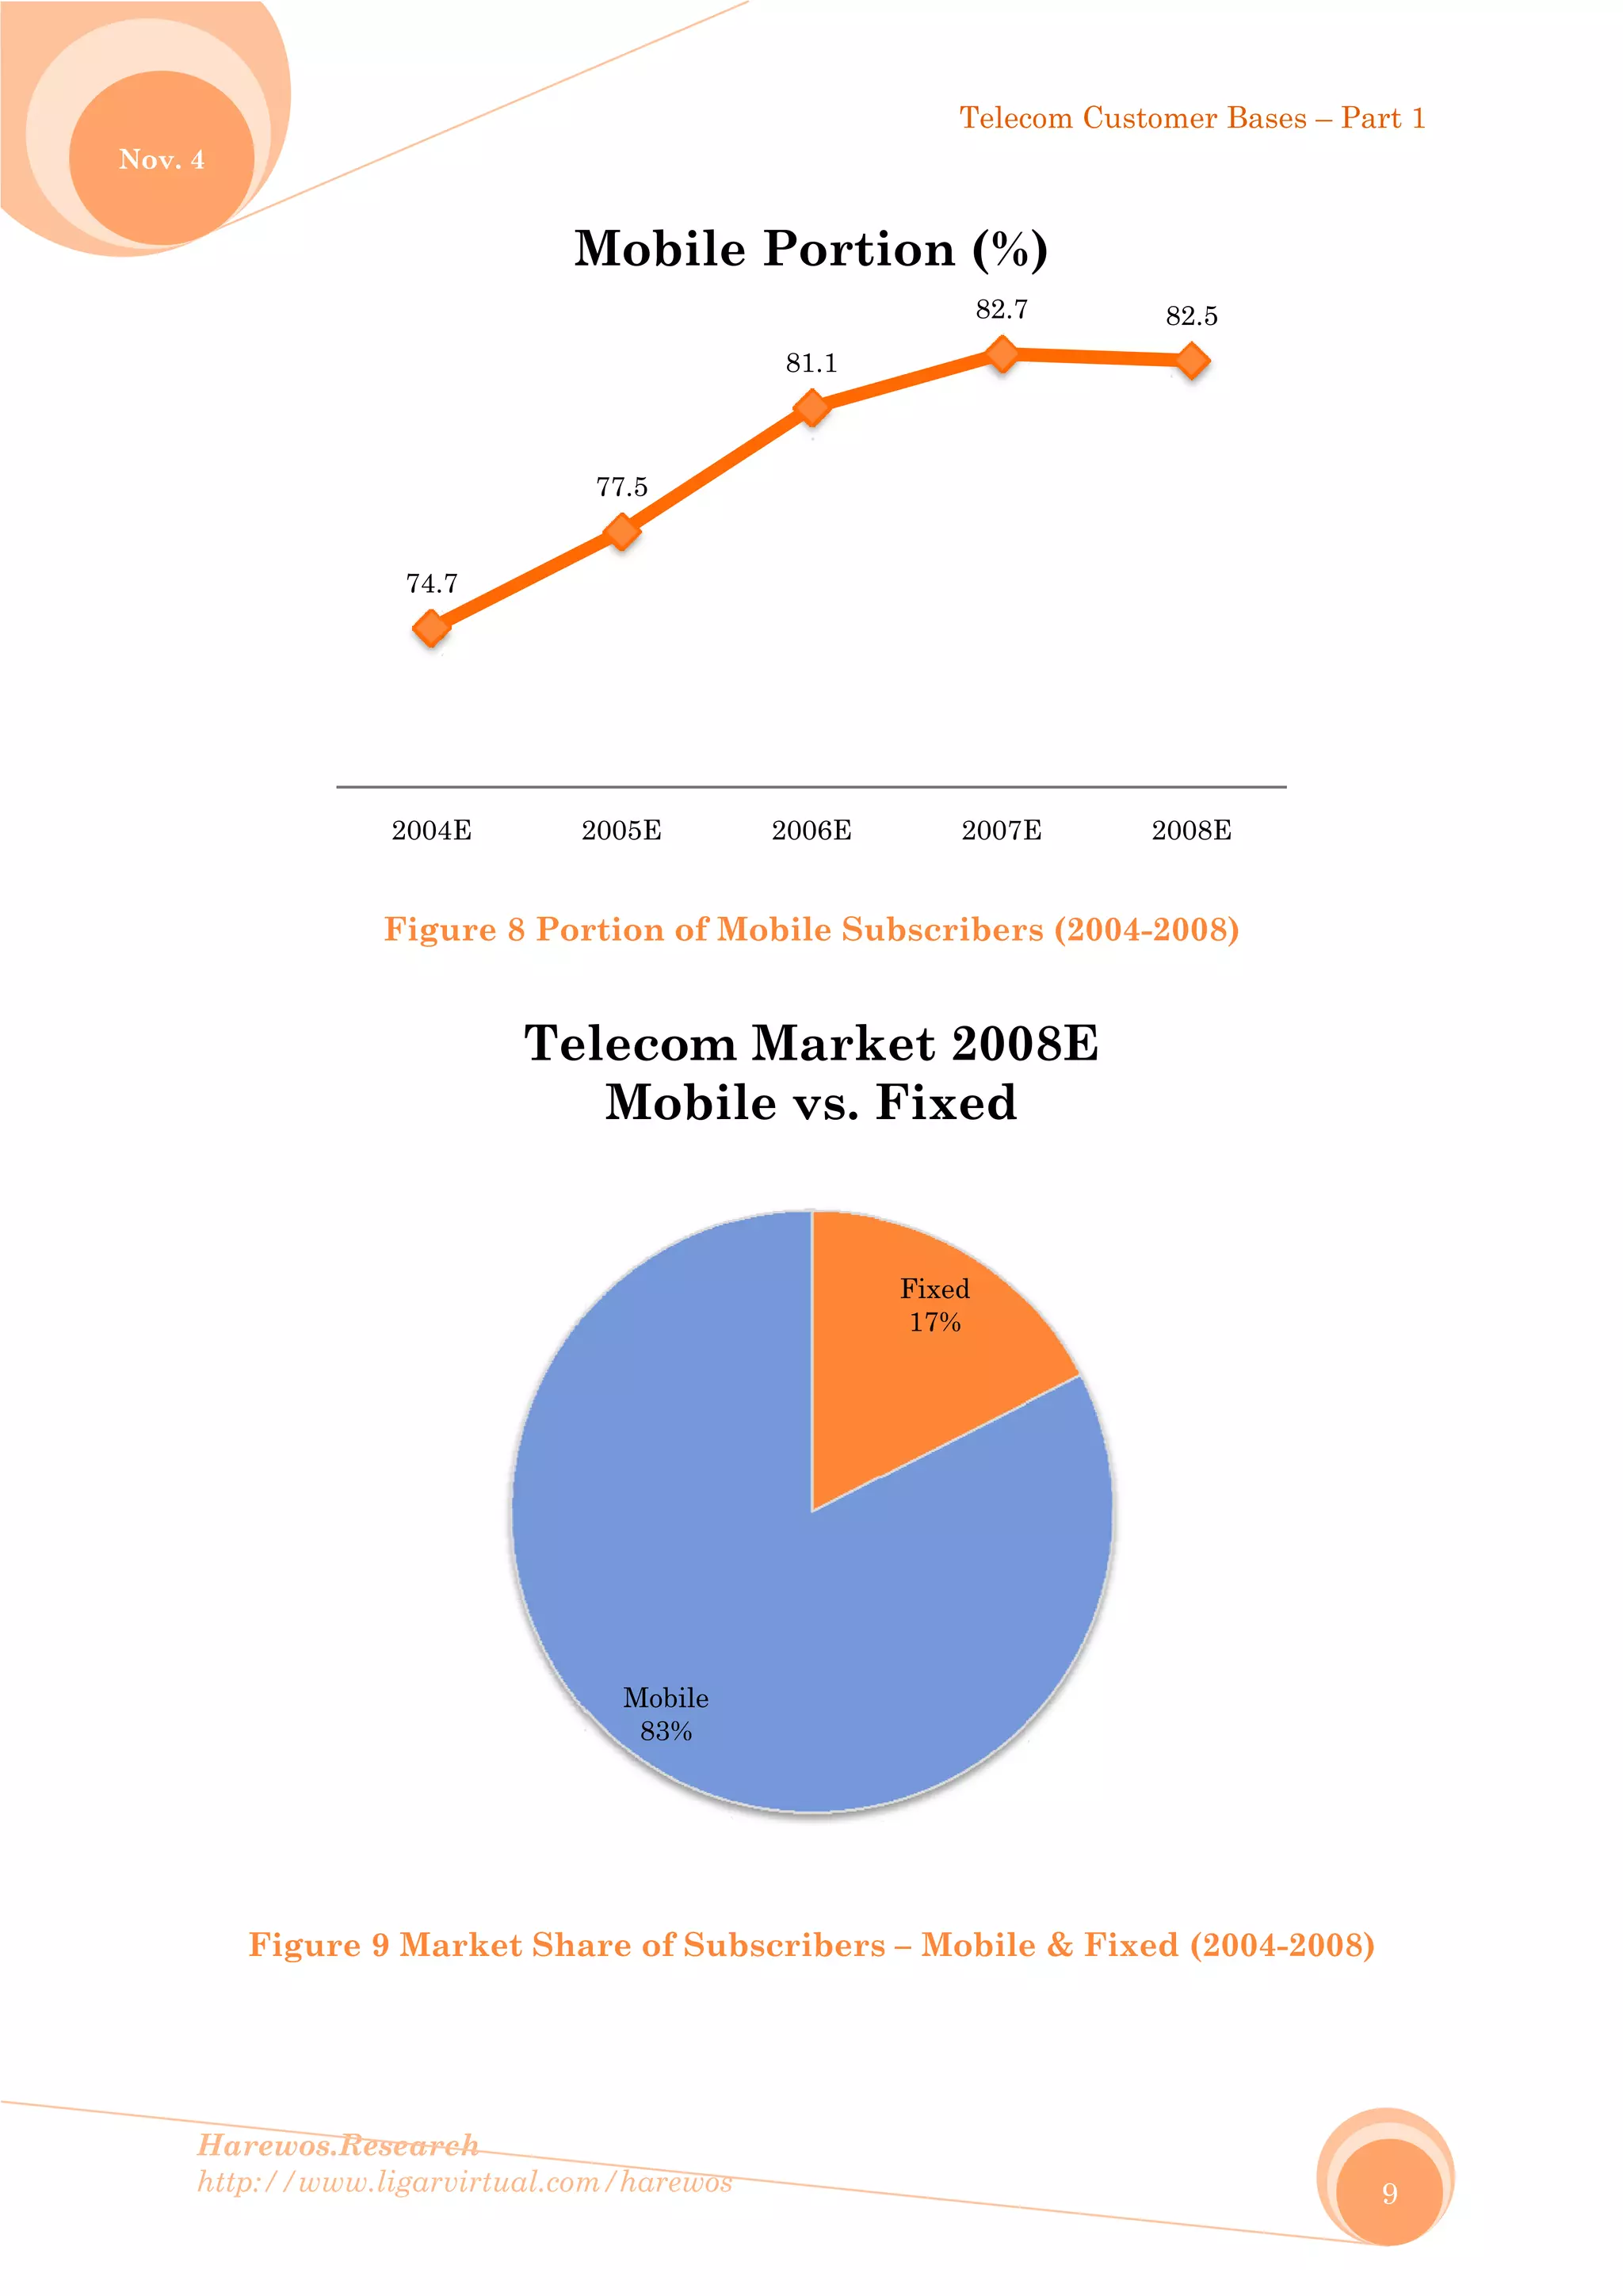
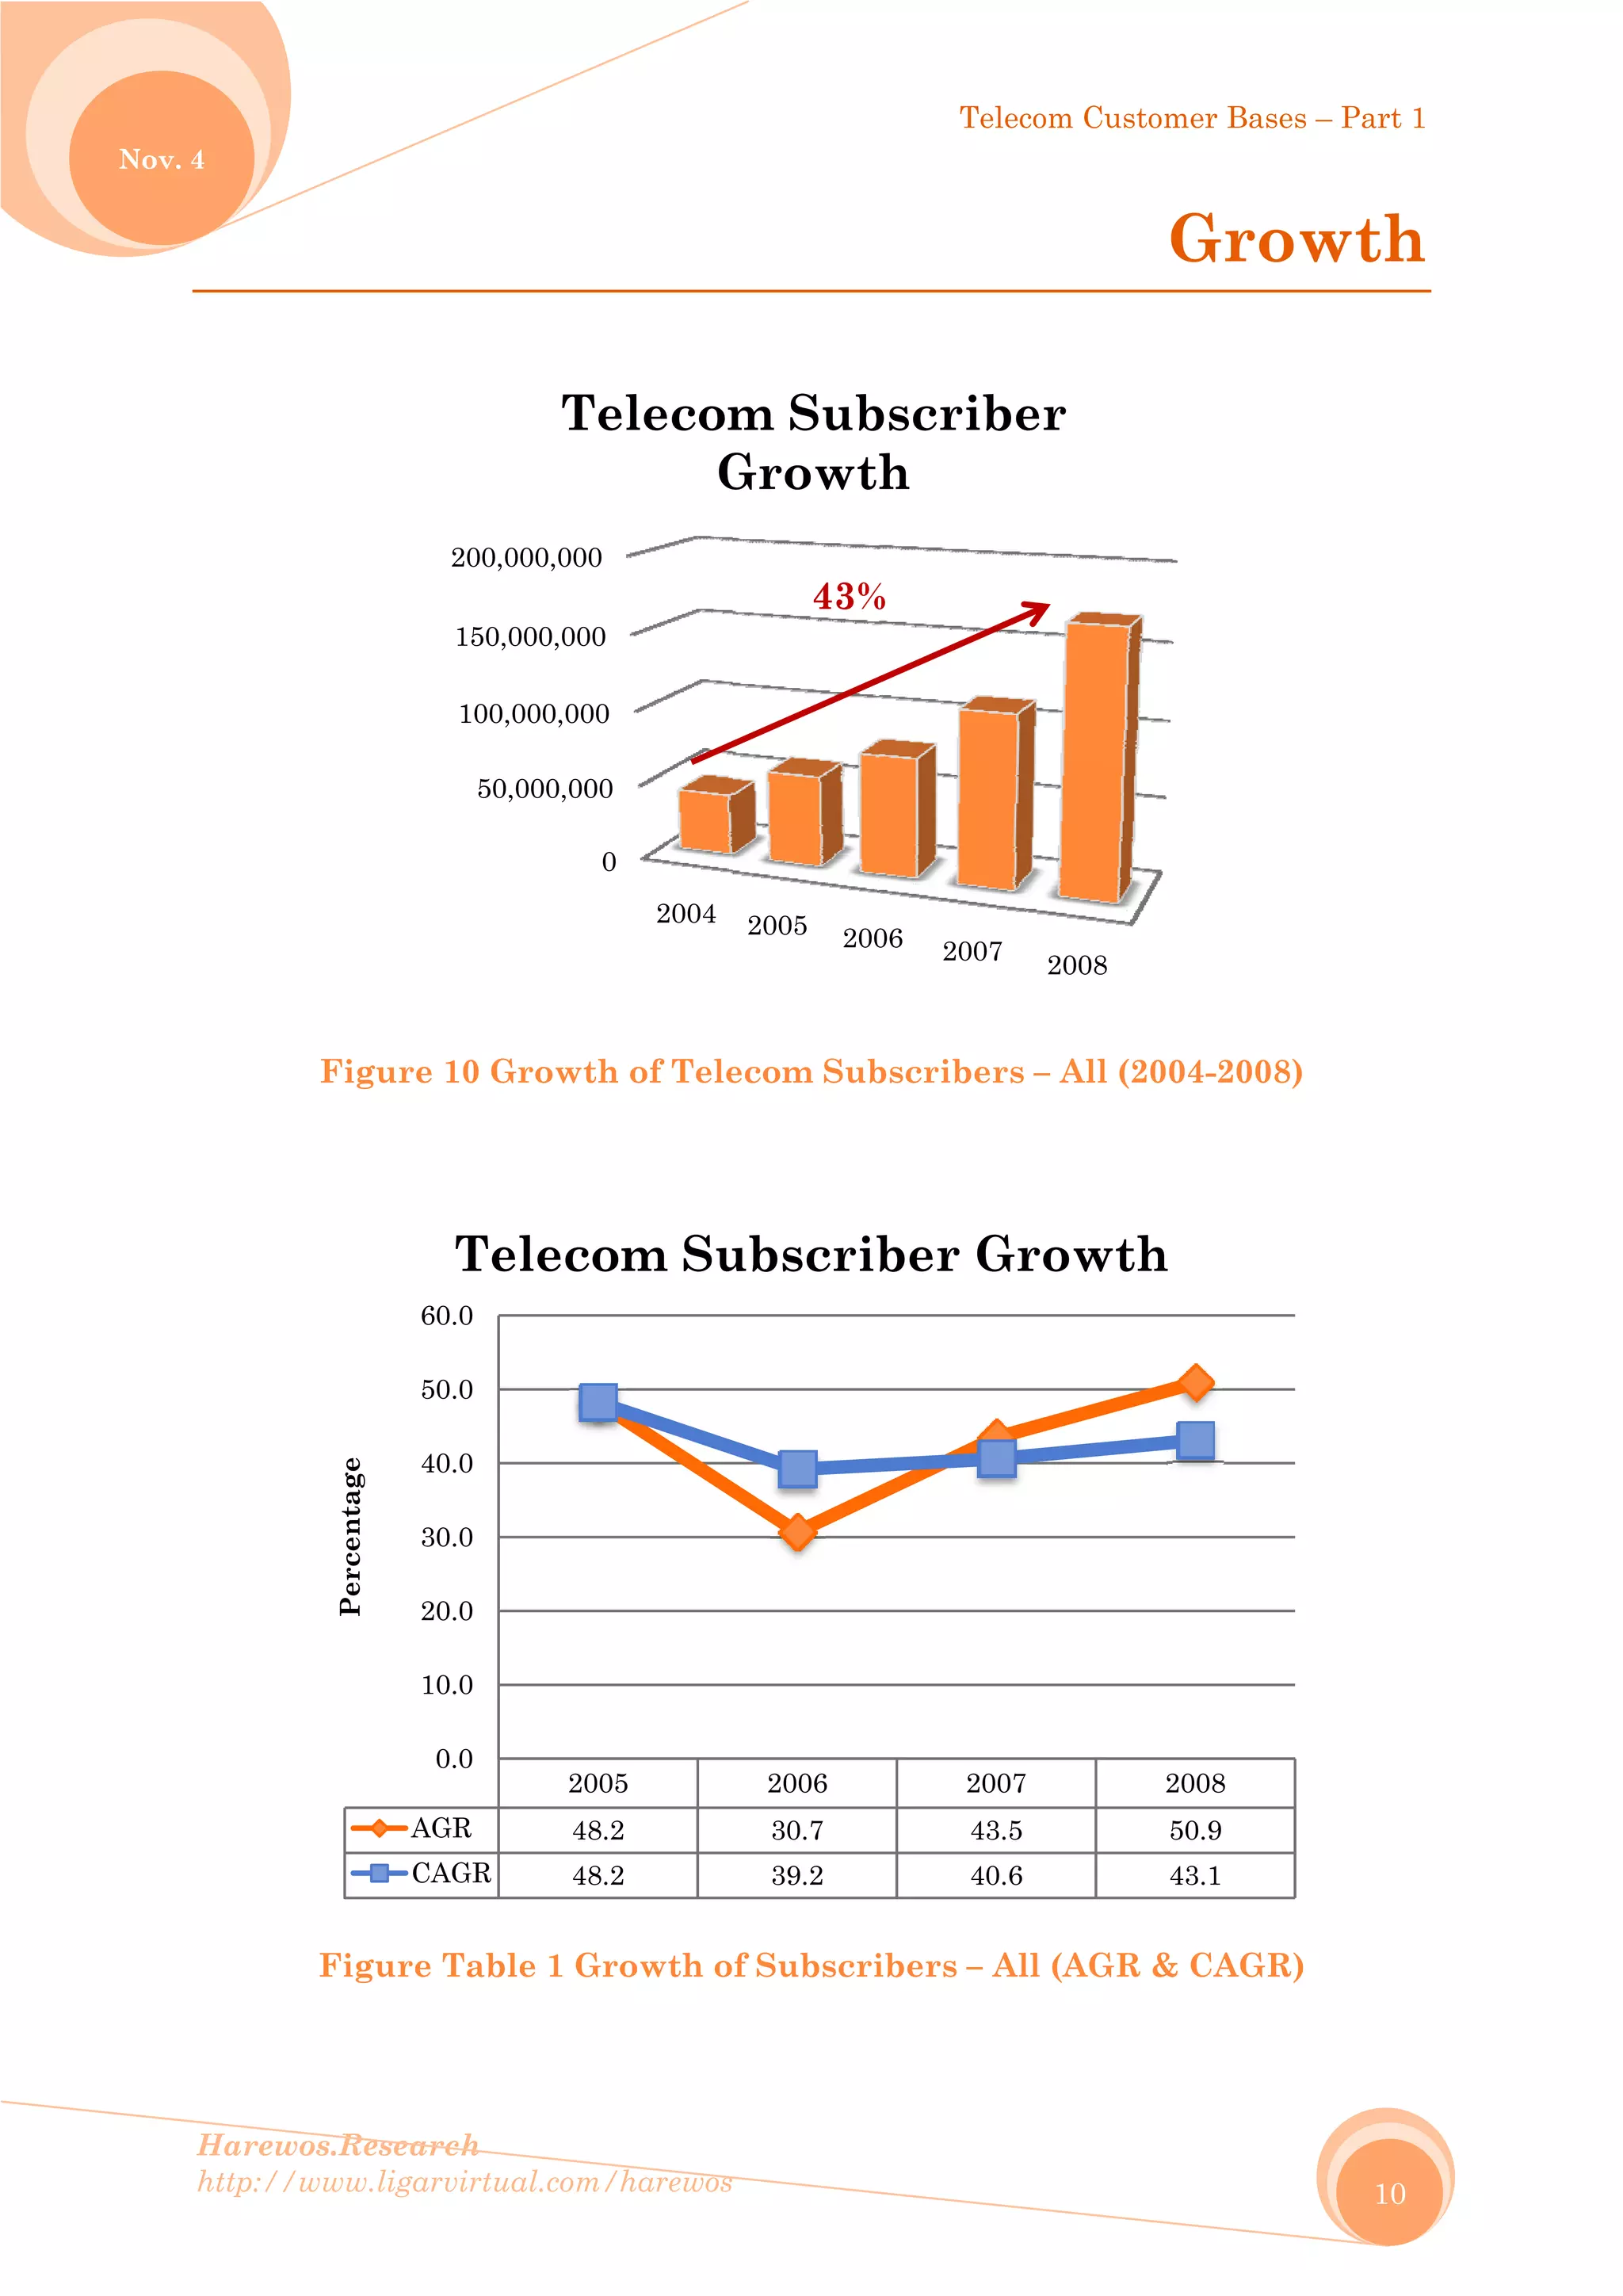
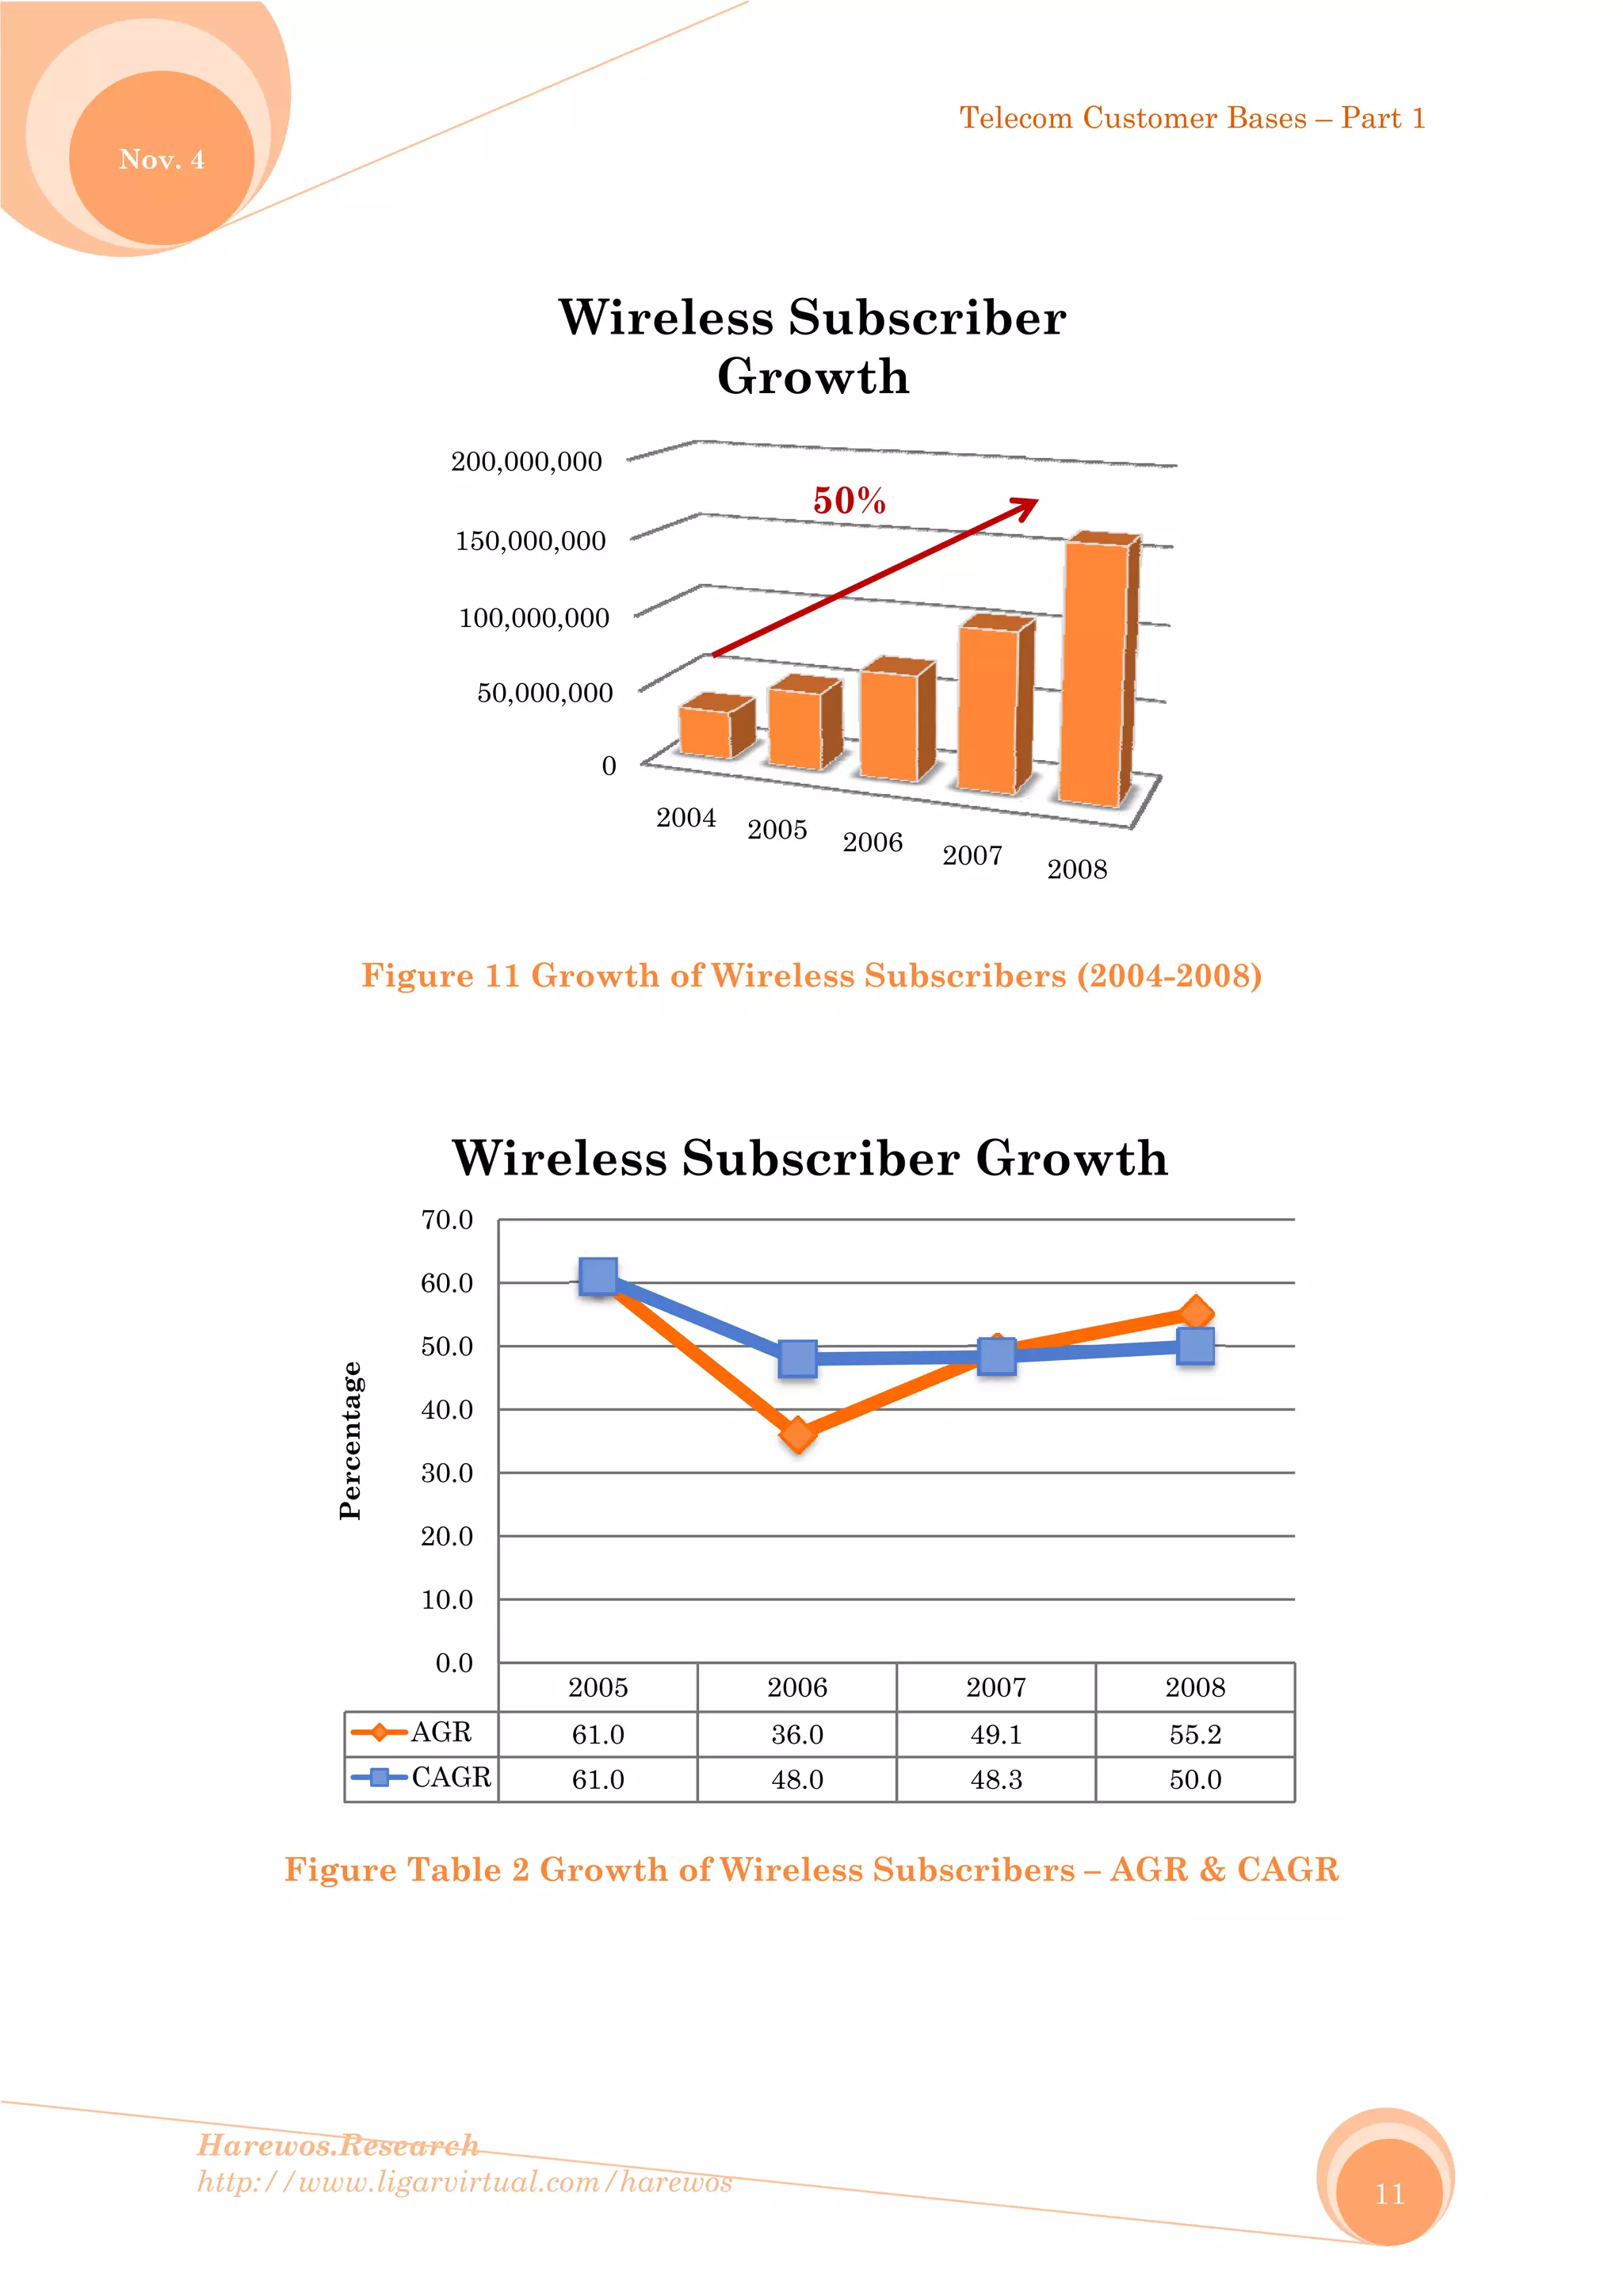
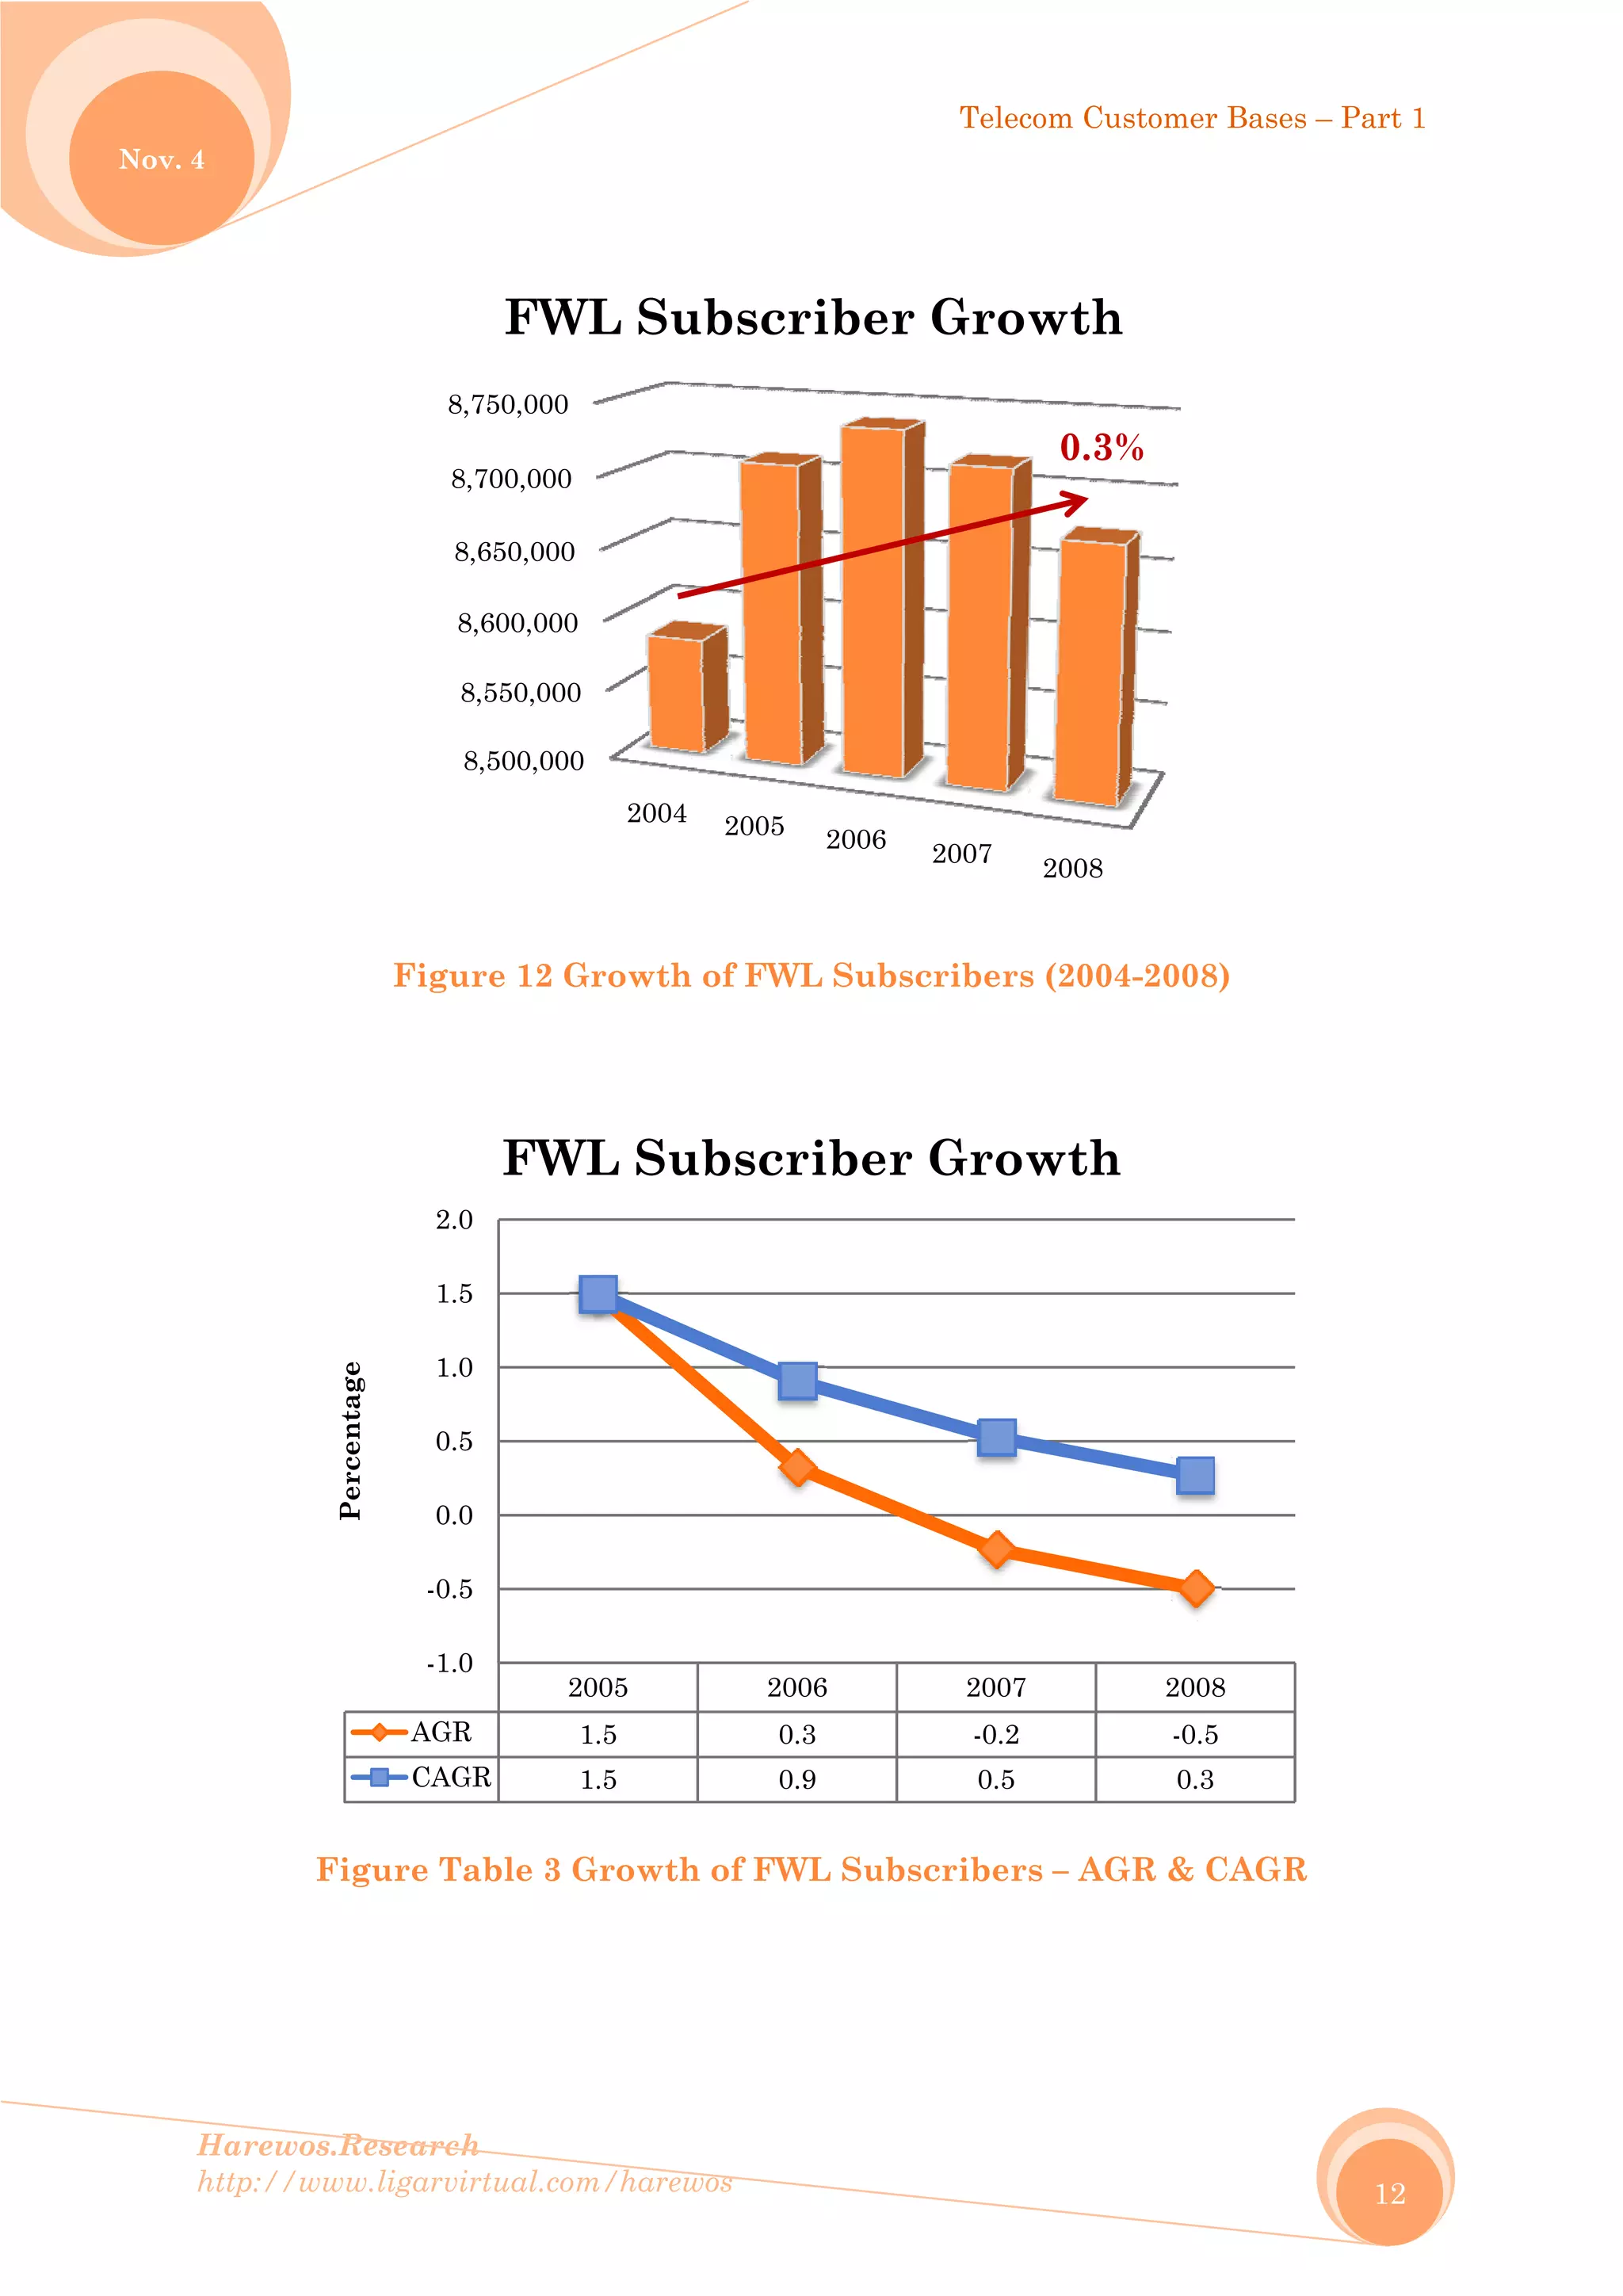
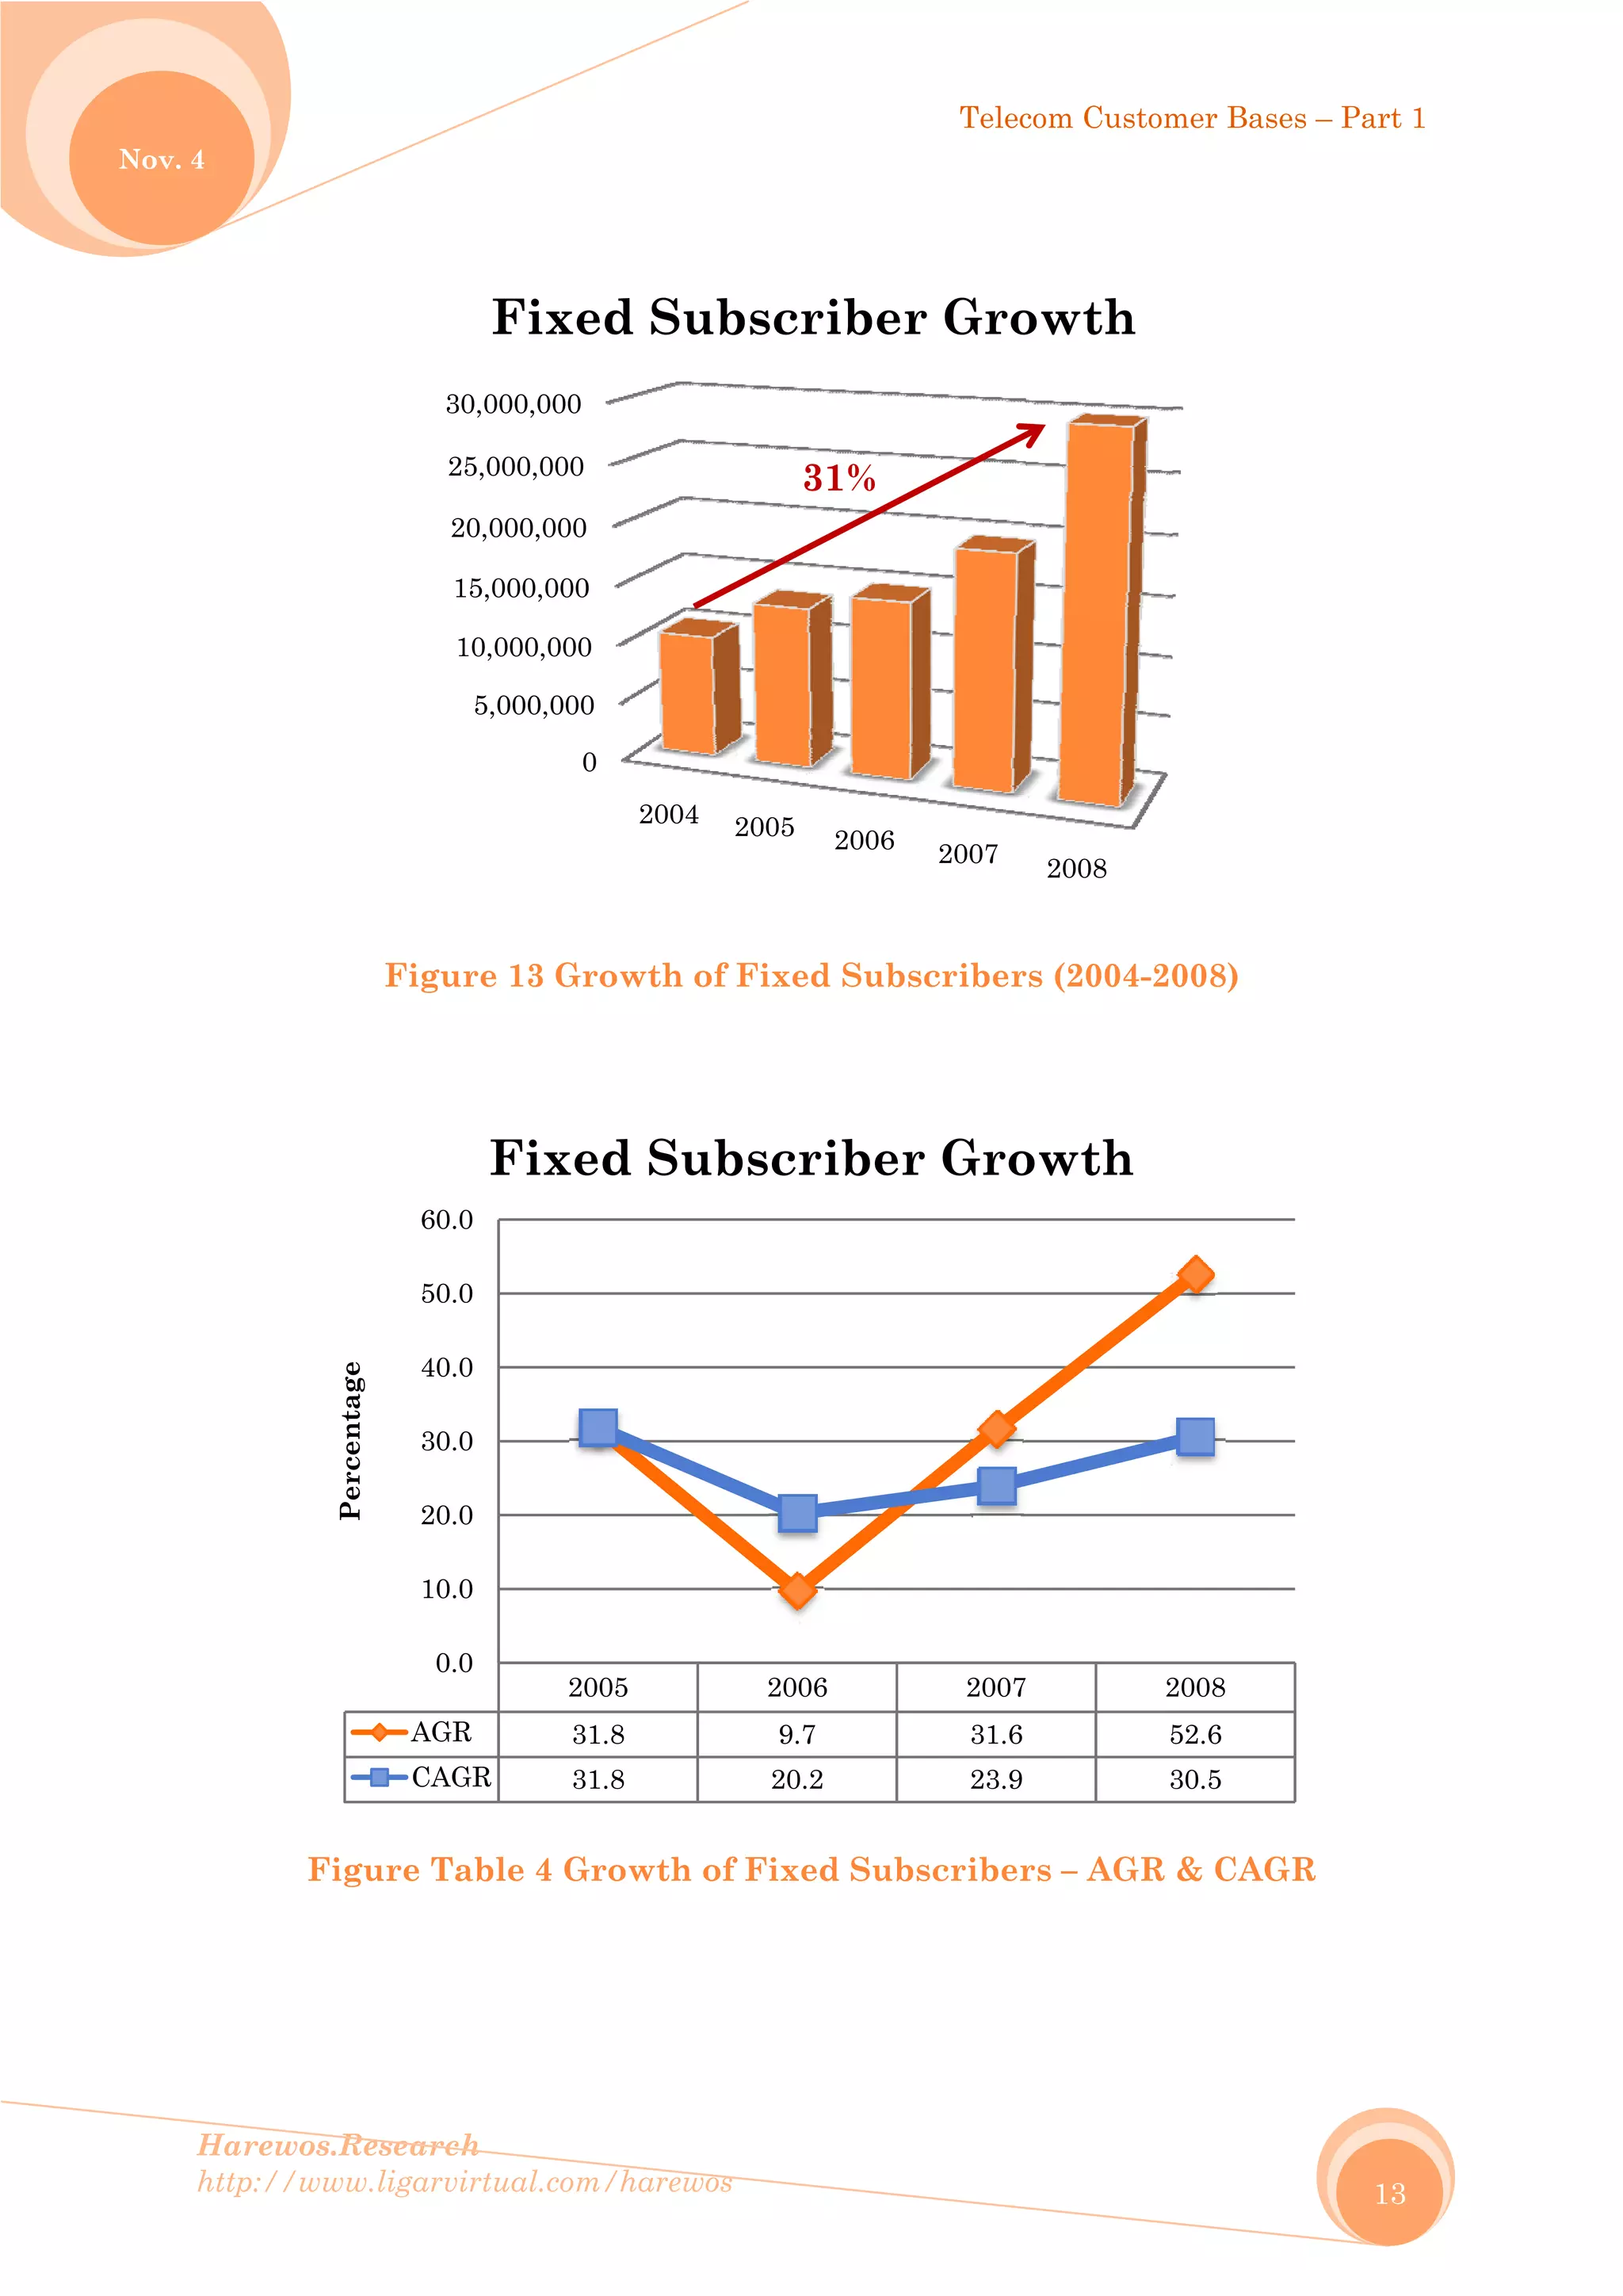
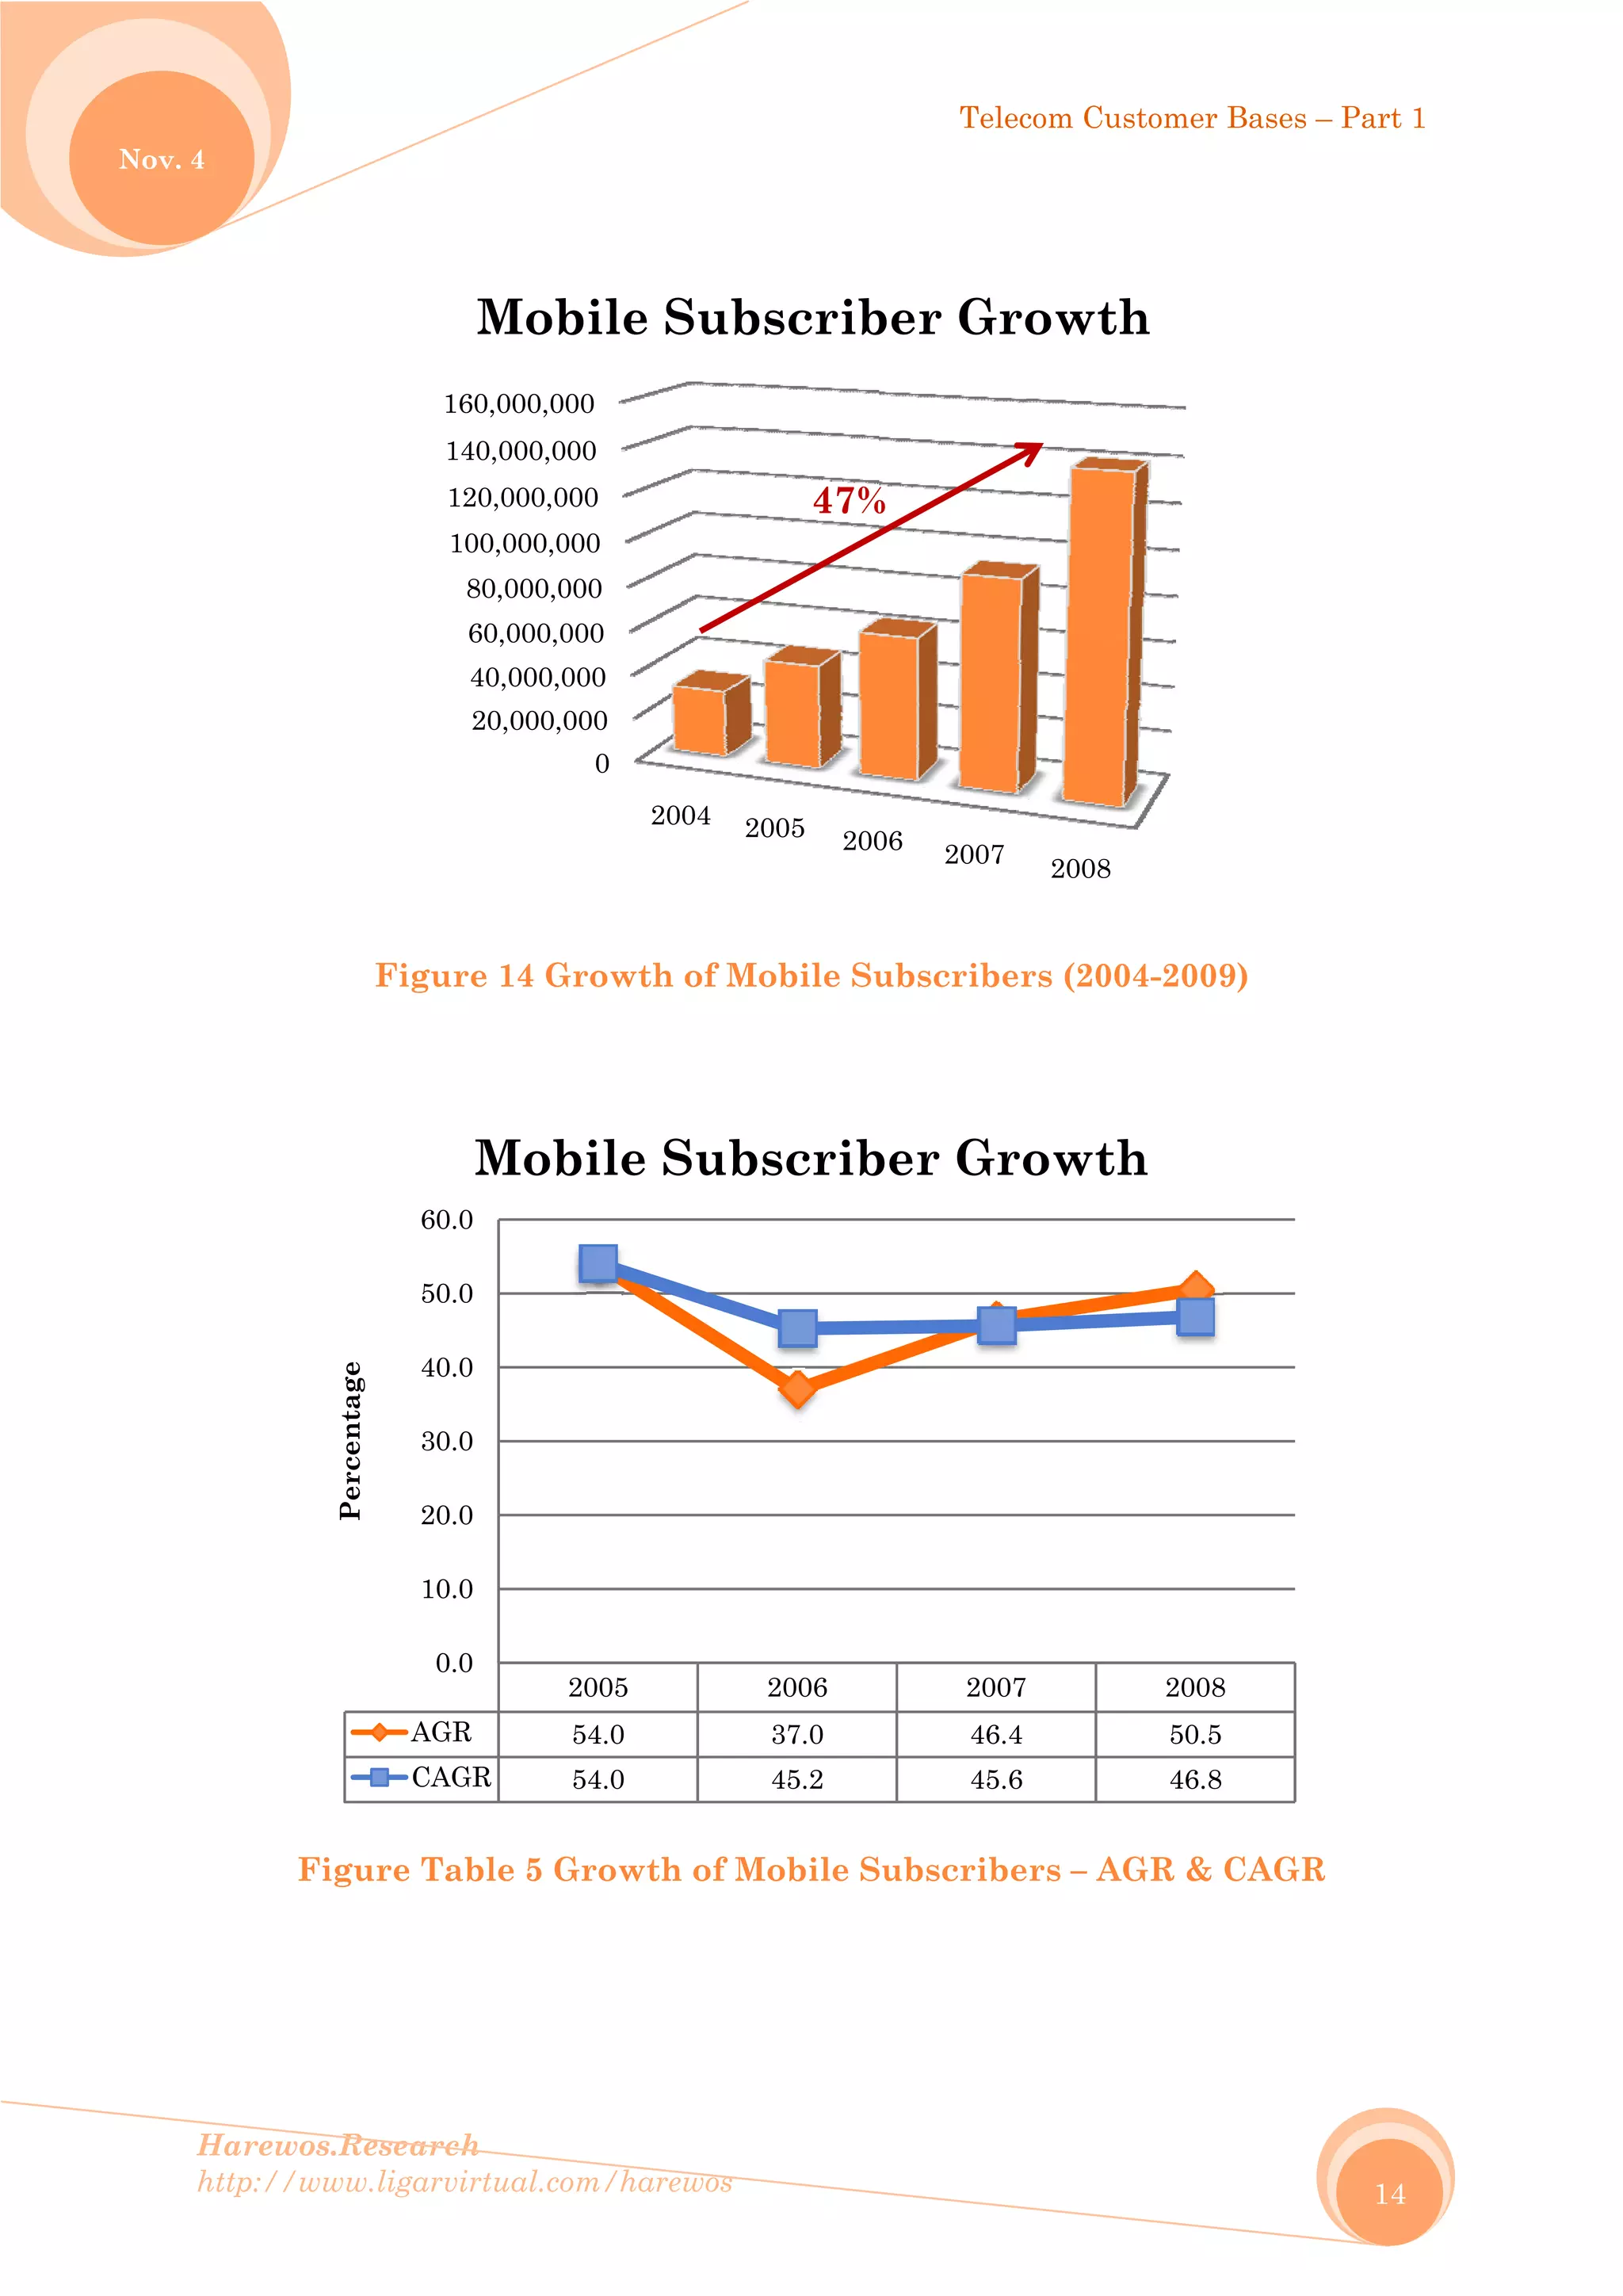
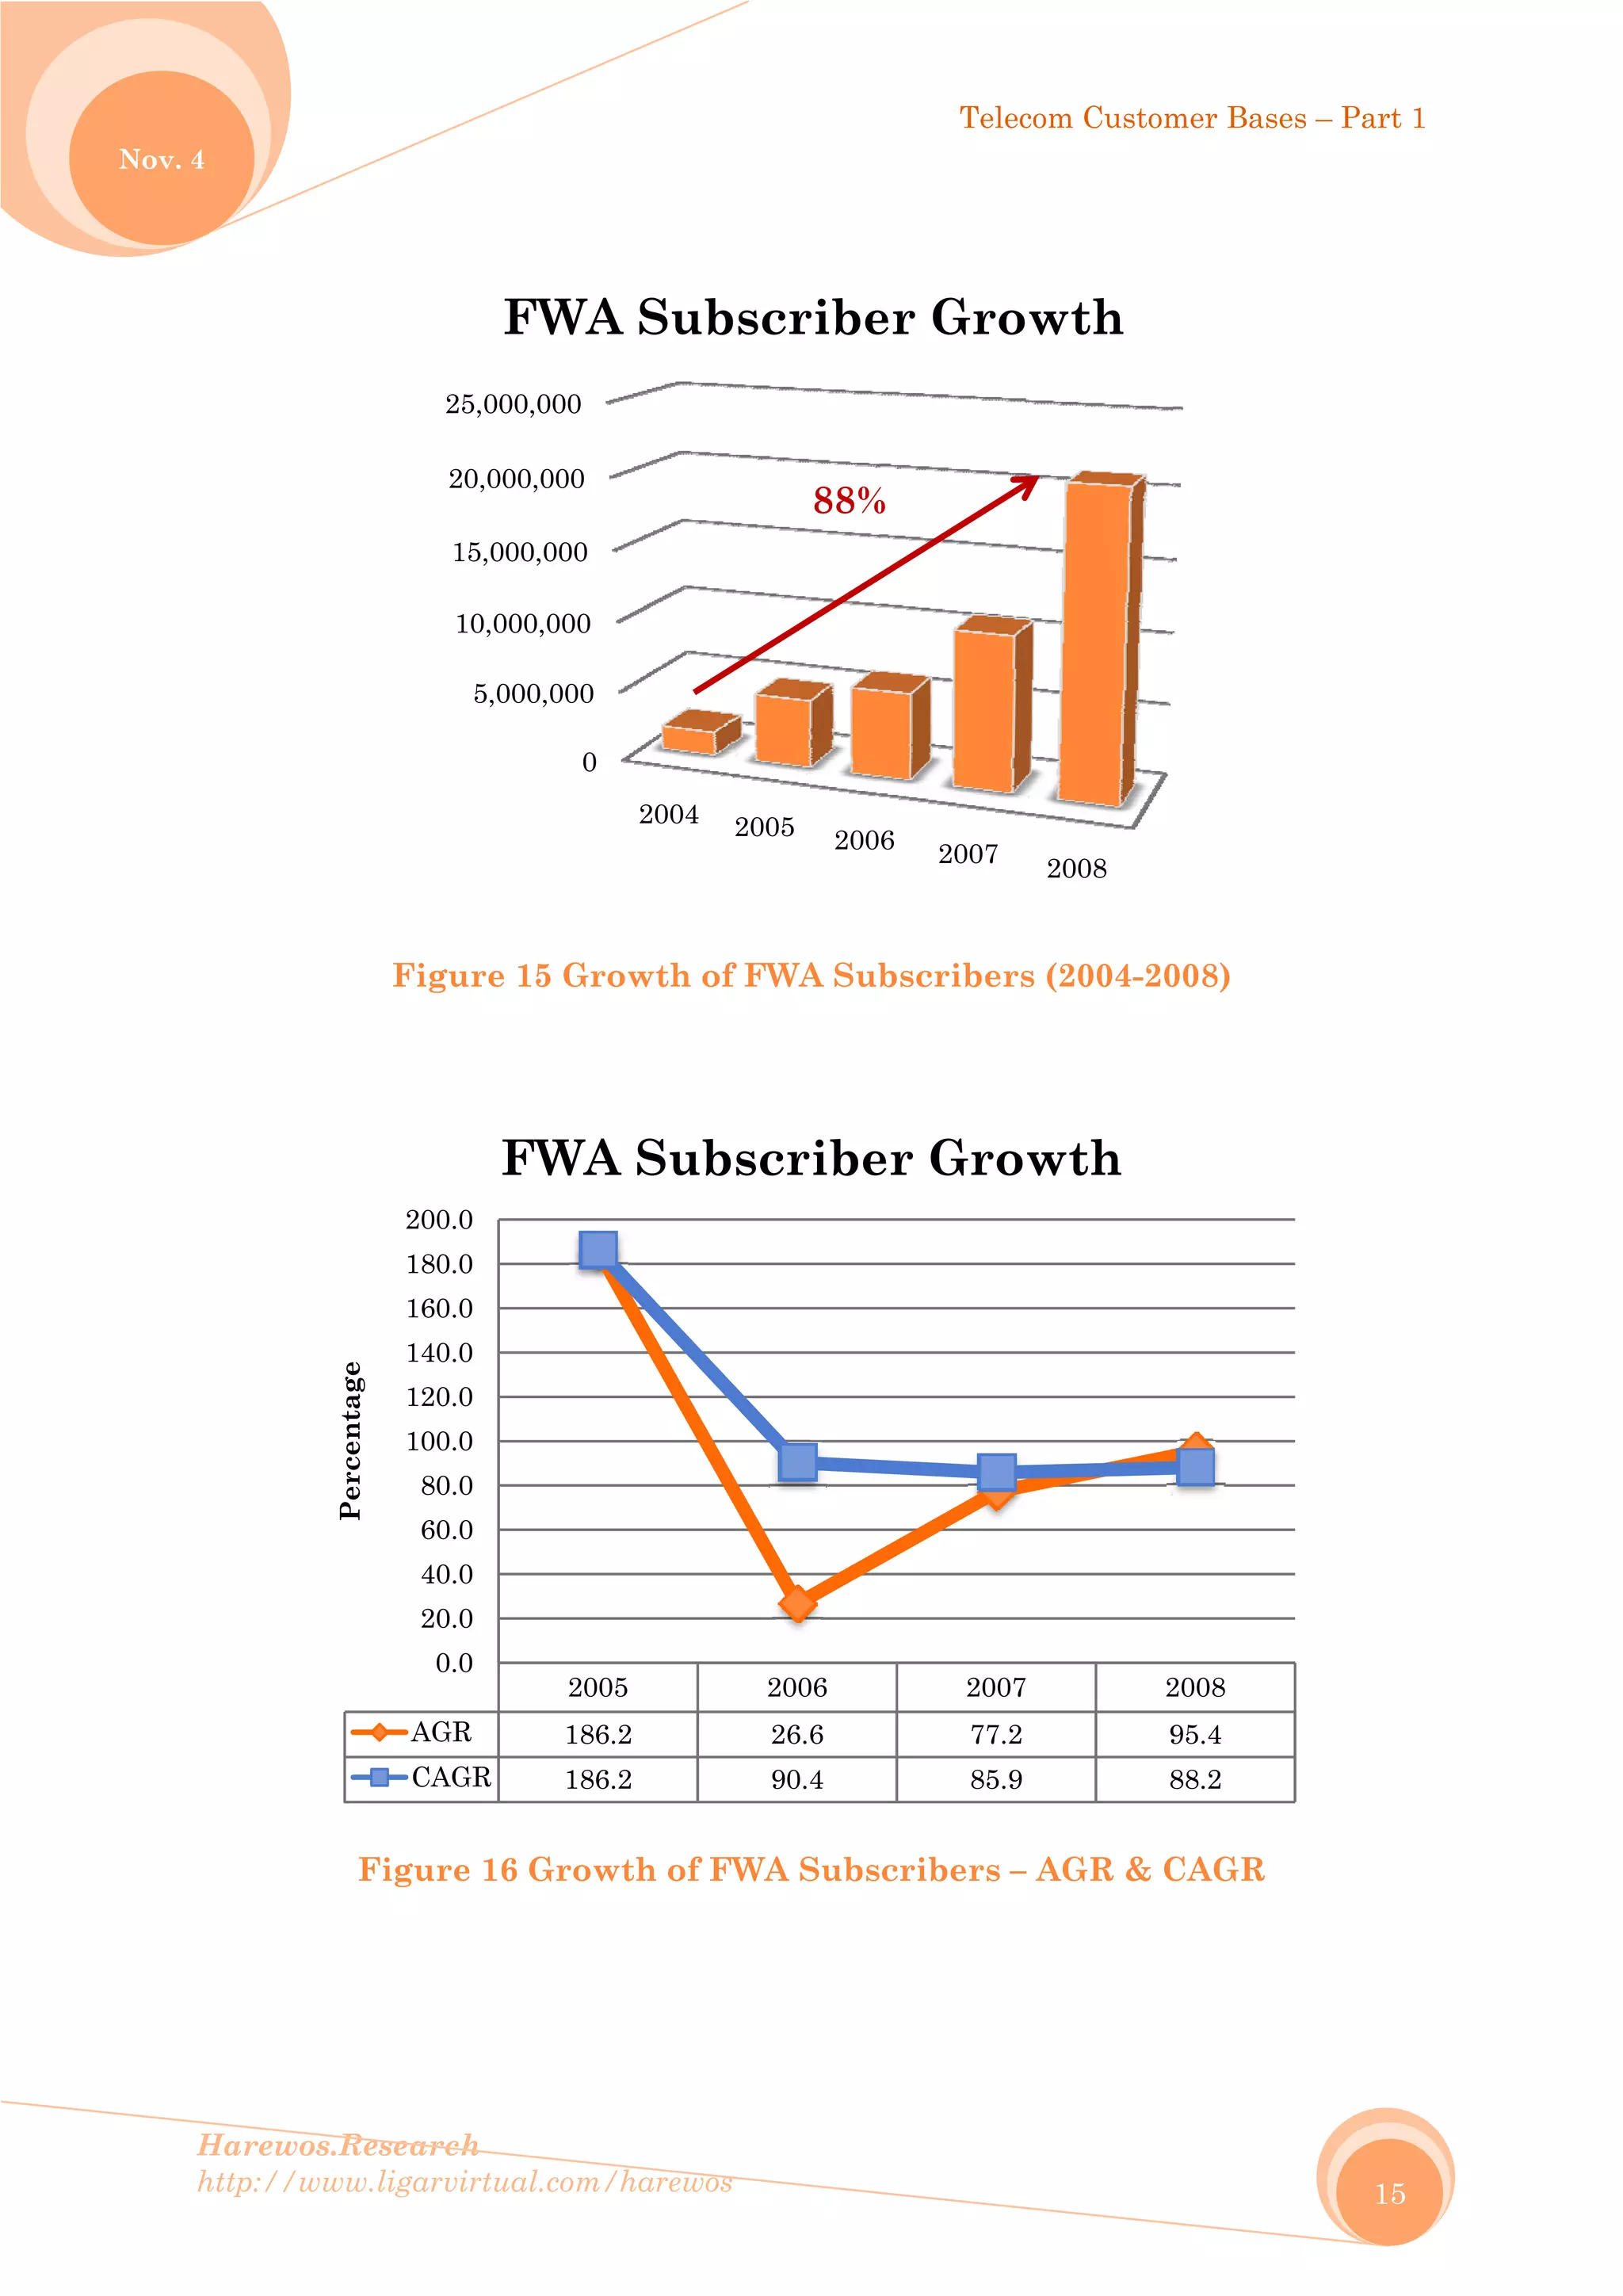
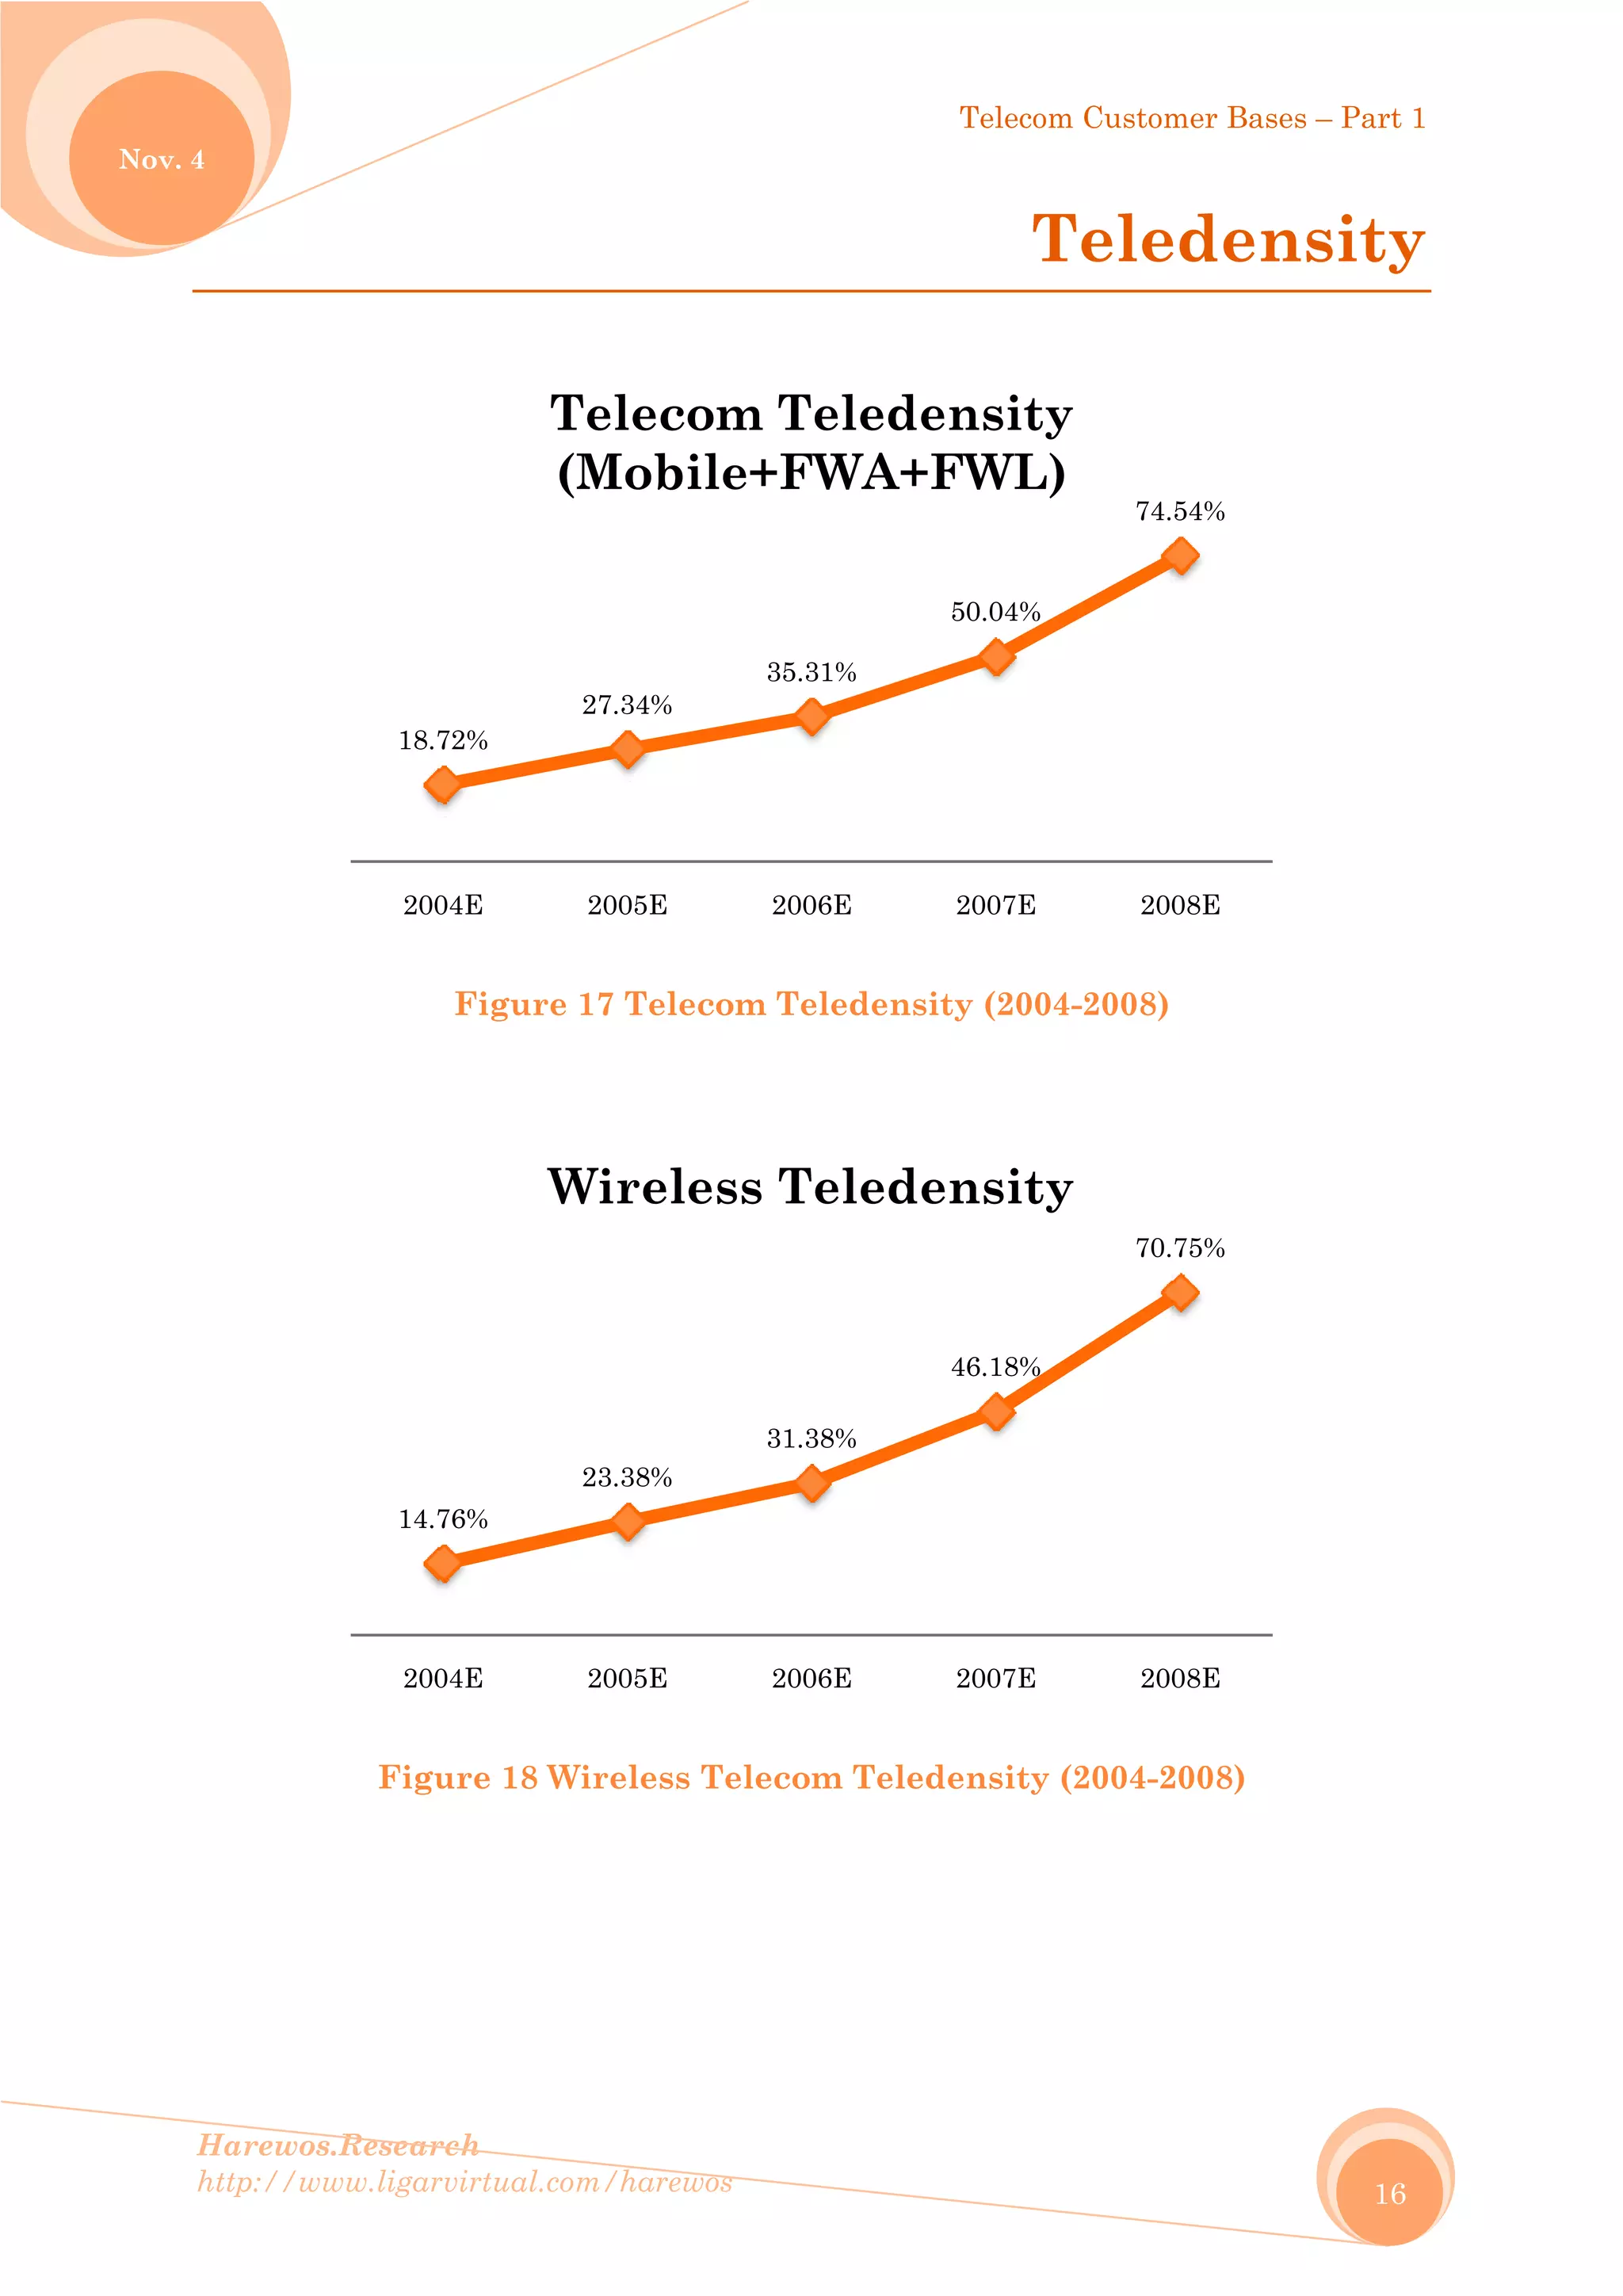
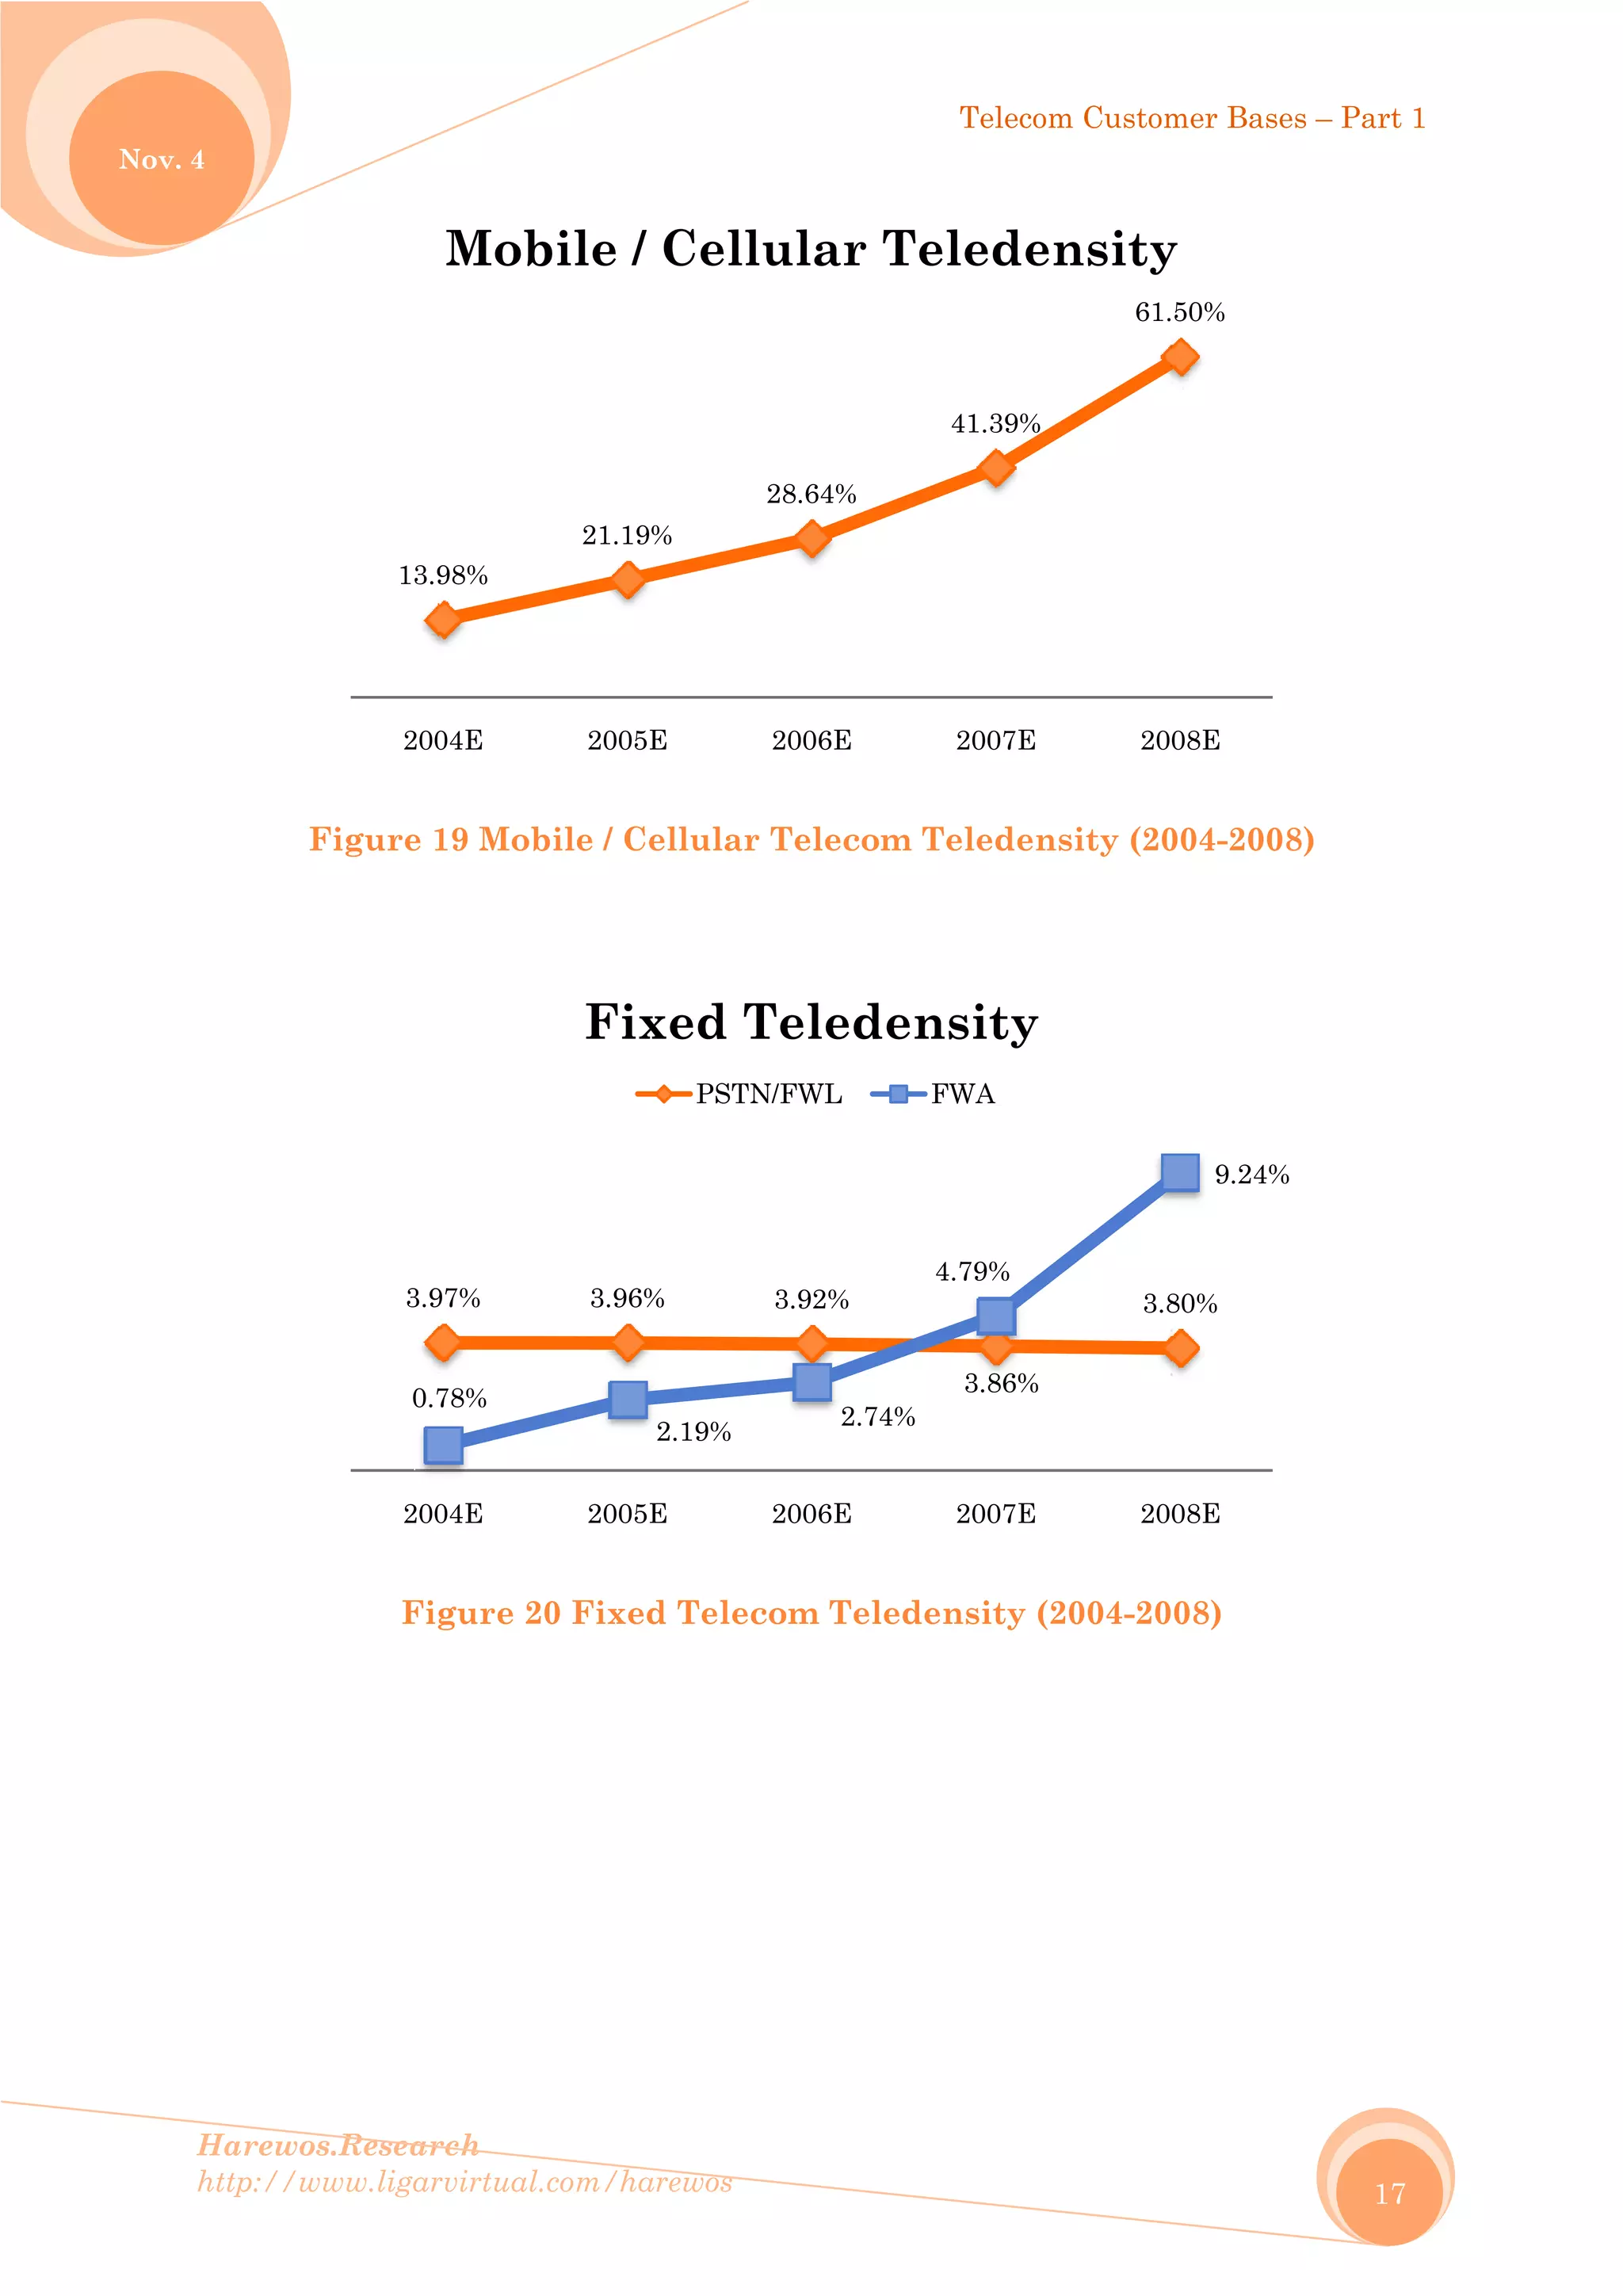
This document provides charts and tables summarizing telecom subscriber numbers and growth in Indonesia from 2004-2008. It includes data on fixed wireline, fixed wireless access, and mobile subscribers as well as breakdowns of wireline vs wireless and fixed vs mobile connections. Growth rates for total telecom subscribers and for specific types of connections like wireless and mobile are presented. Market shares of different connection types are shown in pie charts. Teledensity for total telecom and for wireless/mobile/fixed segments are also included.
This document contains tables and figures summarizing telecom customer bases in Indonesia from 2004-2008. It includes data on fixed wireline, fixed wireless access, mobile/cellular, and wireless subscribers. For each category, it provides total subscriber numbers and market shares for the major operators over this period.
Sample global automotive steer by-wire system market research report 2020 - copyCognitive Market Research
Cognitive Market Research provides detailed analysis of Automotive Steer-by-wire System Market in our recently published report titled, "Automotive Steer-by-wire System Market 2020" The market study focuses on industry dynamics including driving factors to provide the key elements fueling the current market growth. The report also identifies restraints and opportunities to identify high growth segments involved in the Automotive Steer-by-wire System market. Key industrial factors such as macroeconomic and microeconomic factors are studied in detail with help of PESTEL analysis in order to have a holistic view of factors impacting Automotive Steer-by-wire System market growth across the globe. Market growth is forecasted with the help of complex algorithms such as regression analysis, sentiment analysis of end-users, etc.
How to accelerate broadband/ICT use in Thailand ? by Takahiro KONO, Advisor on ICT Policy (JICA Expert), Ministry of Information and Communication Technology (MICT), Thailand
Get the speed, performance and reliability of
fiber for your communications and network
needs, even if your business doesn’t have
direct fiber access. With Fixed Wireless
Access, you have an alternative last-mile
and metro-area access solution as your
primary network, or as a redundancy solution to
complement your existing wireline network.
Fixed Wireless network leverages our
licensed, carrier-grade fixed wireless (LMDS)
spectrum covering more than 85 major
metropolitan markets across the United
States. Your business can take advantage
of our fixed wireless capabilities to directly
connect to the XO nationwide fiber
network without the additional costs and
time of deploying fiber directly to your business
locations.
Use Fixed Wireless network to support and
deliver a wide range of services directly to
your business locations at speeds ranging
from 10 Mbps to 1 Gbps. In addition,
you can support your business continuity
and network redundancy requirements with
Fixed Wireless Access as back-up network
to your fiber network.
DIFFERENCE BETWEEN 4G LTE & FIXED WIRELESS BROADBANDnathaniel Korley
4G is a mobile internet connection that operates at speeds between 100 Mbps and 1 Gbps over cellular networks or local Wi-Fi. It connects via a SIM card in a smartphone and allows internet access on the go but has coverage limitations. Fixed broadband is a high-speed home or office internet connection delivered via radio signals or fiber optic cables to a router, providing unlimited data through a consistent Wi-Fi network without usage caps but is stationary. The main differences between the two are that 4G is mobile but has coverage and speed restrictions while fixed broadband is stationary but offers faster, more reliable internet without usage limits.
This document provides statistics on traffic production measured in minutes of use (MoU) for the Indonesian telecom market from 2006 to 2008. It includes data on total MoU for all operators as well as individual data for the major operators Telkomsel, Indosat, Excelcomindo, Bakrie Telecom, Telkom fixed wireless access, and Telkom PSTN networks. The data is presented in tables and figures showing MoU totals, market share, and growth rates for each year.
This document provides charts and tables summarizing internet service market facts and numbers in Indonesia from 2004-2009. It includes data on legacy non-mobile subscribers, mobile intensive subscribers, and subscribers from major internet service providers like Telkom and First Media. Growth rates for total subscribers and major segments are presented. The document compares its own data to numbers reported by APJII, Indonesia's internet service association.
This document provides charts and tables summarizing the subscriber bases of major Indonesian telecom companies from 2004-2008. It includes data on Telkomsel, Telkom FWA, Indosat, Indosat FWA, Excelcomindo, Bakrie Telecom, Mobile-8 and several other wireless carriers. The data includes the annual subscriber numbers, annual growth rates, and compound annual growth rates over the 5-year period for cellular, fixed wireless, and total subscribers for each company. Portion charts are also included showing the breakdown of subscriber types for some companies in 2008.
UK Spectrum Policy Forum Report: UK Spectrum Usage & Demand - First EditiontechUK
The UK Spectrum Policy Forum, the industry-led sounding board to Government and Ofcom, has launched the first in a series of reports on UK Spectrum Usage and Demand.
Based on research from independent experts Real Wireless and drawing on the inputs of a panel of contributors for each sector, this report includes views on the importance of spectrum as a national resource from the space, utilities, business radio, meteorology and mobile industries.
The report can be downloaded from here: https://www.techuk.org/insights/reports/item/3773-uk-spectrum-usage-demand-first-edition
This document provides charts, tables, and figures summarizing 3G mobile telecommunications market data and infrastructure development in Indonesia from 2006-2009. It details subscriber and base station growth for the major mobile network operators Telkomsel, Indosat, XL, NTS, and HCPT over this period and includes market share information.
SummaryThis report provides an overview of the latest trends in the emerging Femtocell market ' Eur 875 million in revenues for Service Providers by 2013 - and examines how mass market deployment levels will be reached and what hurdles must first be overcome. It provides an analysis on roll out stra- tegies, Femtocell stan- dards, network connection methods and the scope for reduced operator costs and increased revenues....Key Questions' Which Femtocell trends and roll-out scenarios for 2013'' What are the region discrepancies'' What type of operators are the best positioned to deploy Femtocells' And what strategies to adopt'' What are the values of Femtocell perceived by service providers'' What are the values of Femtocell perceived by end-users'' Which issues still have to be overcome before mass Femtocell roll outs are possible'Database (Excel): World, Europe, North America, Asia Pacific - USA, Canada, France, Germany, Italy, Spain, UK, Japan, Malaysia, Singapore, South Korea, Taiwan
This document discusses considerations for introducing LTE technology into existing GSM-UMTS networks. It will take several years for LTE deployments to reach the scale of existing 2G and 3G networks, so operators need solutions to provide seamless service and mobility between network technologies during the transition. The document outlines various strategies for LTE deployment, including options for data-only, voice and data services. It also examines expectations around subscriber and operator experience, and analyzes potential solutions for interworking LTE with 2G-3G networks to support seamless service continuity.
This document provides data on ARPU (average revenue per user) trends for major mobile operators in Indonesia from 2004 to 2008. It includes ARPU figures and growth rates for the top operators: Telkomsel, Indosat, Excelcomindo, Telkom FWA, Bakrie Telecom and Mobile-8. Charts and tables show blended, postpaid and prepaid ARPU values over time for each operator as well as overall ARPU growth rates. The document aims to present key telecom market facts and numbers on ARPU, a key performance indicator, for the Indonesian mobile market during this period.
Cable_transmission wires_ Industry Analysis ReportSumit Arora
The document provides an industry analysis report of Sterlite Technologies. It discusses the size and growth of the cable and telecom industry in India. It analyzes Sterlite Technologies' competitors and provides details on their market share, revenues, costs, and growth. Additionally, it covers macro factors like regulatory environment, economic conditions, and substitutes that could impact the industry. Financial details on Sterlite Technologies and its peers are presented, including their balance sheets, revenues, margins and other metrics. A Porter's five forces analysis of the industry is also mentioned.
This document provides charts, tables, and figures summarizing the development of base transceiver stations (BTS) in the Indonesian telecom market from 2004-2008 for the major operators. It shows growth in total BTS installations over time as well as the market share of each operator. Specific data on the annual BTS installations and growth rates for Telkomsel, Indosat, Excelcomindo, Telkom, Bakrie Telecom, and Mobile-8 are presented.
This document provides statistics and charts on SMS production in the Indonesian telecom market from 2006 to 2008. It includes annual and average monthly/daily SMS production figures for the major operators Telkomsel, Indosat, Excelcomindo and Telkom FWA. It also provides estimates for SMS production from smaller operators and growth rates for total SMS production and for each individual operator over the period.
Kenya ICT sector statistics for 2011/2012.
The number of Internet subscribers in Kenya increased by 13.48 percent from 5.42 million to 6.15 million between September 1 and December 31 last year.
During the same period, the estimated number of Internet users rose to 17.38 million up from 14.30 million, representing an increase of 21.55 per cent.
This document defines traffic measurement requirements for digital telecommunications exchanges. It establishes a generic traffic measurement model based on entities, objects, and traffic flows. Key points:
1. Measurements are defined at different levels, including overall, selectable objects, services, control units, and call records.
2. Major services covered are basic telephone, ISDN, and Intelligent Network (IN) services.
3. A measurement consists of measurement set information, time information, and output routing/scheduling information.
Network Development & Statistics (Addendum A)EM Archieve
This document contains charts and tables summarizing the development of telecommunications networks in Indonesia from 2004-2008. It includes data on the number of installed base transceiver stations (BTS) for the major mobile network operators Telkomsel, Indosat, Excelcomindo, Bakrie Telecom, and Mobile-8. Tables also show the average number of subscribers per BTS, BTS per base station controller (BSC), and BTS per mobile switching center (MSC) for each year and operator.
Referenced in presentation, "The Seven Wonders of China's Mobile World"
http://www.slideshare.net/ckeikofunahashi/m-learncon-session-907-ckeikofunahashi
This document provides an industrial training report on Bharat Sanchar Nigam Limited (BSNL) submitted by Pramod Kumar Maurya. It includes an acknowledgment, introduction to the telecom industry and BSNL in India. It also covers various topics related to telephone exchanges like types of exchanges, switching equipment, telephone instruments, power plants and other abbreviations used in telephone exchanges.
The document provides a product description of the ZXMW NR8250 Digital Microwave Radio Transmission System. The NR8250 supports hybrid and native transmission of TDM and Ethernet services from 6 to 38 GHz, with features including adaptive coding and modulation, quality of service, protection switching, and Ethernet switching. It functions as both a point-to-point link and an aggregation node to maximize transmission capacity.
The document discusses competition in Spain's telecommunications sector. It begins by providing context on the evolution of telecommunications in Europe from monopolies to liberalization and the arrival of new technologies. It then examines Spain's telecommunications services supply across fixed line, mobile, fiber optic and emerging technologies. Next, it analyzes the competitive landscape among full service providers, multiservice operators, and specialized operators. It concludes by discussing industry trends and outlooks, including strategies by major operators like Telefonica.
Industrial Ethernet Cables Market Report 2020 Cognitive Market Research provides detailed analysis of Industrial Ethernet Cables Market in our recently published report titled, "Industrial Ethernet Cables Market 2020" The market study focuses on industry dynamics including driving factors to provide the key elements fueling the current market growth. The report also identifies restraints and opportunities to identify high growth segments involved in the Industrial Ethernet Cables market. Key industrial factors such as macroeconomic and microeconomic factors are studied in detail with help of PESTEL analysis in order to have a holistic view of factors impacting Industrial Ethernet Cables market growth across the globe. Market growth is forecasted with the help of complex algorithms such as regression analysis, sentiment analysis of end-users, etc.
This technical report summarizes the author's experience during a six-month internship at Nokia Siemens Networks in Lagos, Nigeria. The report covers topics such as the fundamentals of telecommunications, different telecommunication systems like fixed and mobile networks, and the architecture and implementation of GSM networks. It also describes projects undertaken at mobile network sites and learning experiences working with transmission equipment at Nokia Siemens Networks. The report aims to fulfill the requirements for the Student Industrial Work Experience Scheme (SIWES) as part of the author's undergraduate degree in electrical and electronics engineering.
The document discusses network planning tools and case studies for IP-based networks. It begins with an overview of research and education networks (RENs) and tier-1 internet service provider (ISP) networks. It then presents two case studies, one on quality of service deployment at a large ISP and another on network routing and dimensioning using linear programming. Network planning tools from various vendors are also surveyed. The document uses these examples to illustrate challenges in planning reliable, high-capacity networks and techniques for optimizing routing of traffic.
The document is a tutorial on dimensioning IP backbone networks. It discusses routing in IP networks, the need for traffic engineering and network planning to optimize resource usage and costs. It covers basics of network dimensioning such as transmission channels, optimization algorithms, integer linear programming formulations. Examples are provided on dimensioning telephone networks and IP networks to determine required link capacities and transmission equipment while satisfying traffic demands and constraints. The goal is to minimize total network construction and operation costs.
The document discusses broadband connectivity initiatives for Indonesia and outlines several key points:
1) Broadband connectivity in Indonesia consists of end user, access, aggregation, core and transport components as well as management systems and tools.
2) The Indonesian government's Broadband Merah-Putih (MP3EI) initiative aims to achieve 30% land coverage and serve 30% of the population by 2015 using a combination of wired and wireless technologies depending on location.
3) Achieving meaningful and affordable broadband connectivity across Indonesia's diverse regions will require a hybrid networking approach, minimizing capital expenditures, influencing pricing through strong leadership, and facilitating infrastructure sharing between telecom players and other utilities.
PT Eigen Network - Network Planning & OverviewEM Archieve
This document provides an overview of the PT. Eigen International Cable (EIC) network. The EIC will connect Jakarta to Singapore via Sumatra with approximately 2000 km of cable, including 500 km of submarine cable. The network configuration includes DWDM/OADM equipment along the route to provide an initial capacity of 120-200 Gbps. Cable landing stations and buildings will terminate both submarine and terrestrial cables.
Mobile Internet, Broadband & Data ServicesEM Archieve
This document provides charts and tables summarizing mobile internet, broadband, and data service subscriber numbers and market shares in Indonesia from 2007-2009. It focuses on three categories of subscribers - Mobile Internet Intensive (MI-I), Mobile Internet (MI), and Mobile Data (MD). For each year, the subscriber numbers and market shares of the major operators (Telkomsel, Indosat, Excelcomindo) are presented. Subscriber growth rates are also provided. The document aims to present facts and numbers on the Indonesian telecom market regarding these mobile internet and data services.
This document provides data on the BlackBerry services market in Indonesia between Q1 2008 and Q4 2009 (estimated). It includes figures and tables showing trends in the subscriber base, market share, growth, and bandwidth usage for the major mobile operators Telkomsel, Indosat, and Excelcomindo. The summary highlights key findings such as BlackBerry subscribers growing from 83,000 in Q4 2008 to an estimated 710,000 in Q4 2009, with Telkomsel maintaining the largest market share between 38-42% over this period.
Network Development & Statistics (Addendum B)EM Archieve
This document provides charts and tables summarizing the network capacity and utilization of various telecom operators in Indonesia from 2006 to 2008. It includes data on mobile, fixed wireless access (FWA), and fixed wireless local loop (FWL) networks. The key operators like Telkomsel, Indosat, Excelcomindo and others are shown along with their total network capacity, number of subscribers, and capacity utilization percentage each year. Tables and figures present this data individually for each technology and operator over the three-year period.
This document provides statistics on the development of mobile networks in Indonesia from 2004-2008, including the number of mobile switching centers (MSCs) and base station controllers (BSCs) deployed by the five main mobile operators - Telkomsel, Indosat, Excelcomindo, Bakrie Telecom, and Mobile-8. It contains 13 figures and 12 tables presenting numbers on infrastructure and subscribers for each year and operator over this period.
The Ipsos - AI - Monitor 2024 Report.pdfSocial Samosa
According to Ipsos AI Monitor's 2024 report, 65% Indians said that products and services using AI have profoundly changed their daily life in the past 3-5 years.
Beyond the Basics of A/B Tests: Highly Innovative Experimentation Tactics You...Aggregage
This webinar will explore cutting-edge, less familiar but powerful experimentation methodologies which address well-known limitations of standard A/B Testing. Designed for data and product leaders, this session aims to inspire the embrace of innovative approaches and provide insights into the frontiers of experimentation!
ViewShift: Hassle-free Dynamic Policy Enforcement for Every Data LakeWalaa Eldin Moustafa
Dynamic policy enforcement is becoming an increasingly important topic in today’s world where data privacy and compliance is a top priority for companies, individuals, and regulators alike. In these slides, we discuss how LinkedIn implements a powerful dynamic policy enforcement engine, called ViewShift, and integrates it within its data lake. We show the query engine architecture and how catalog implementations can automatically route table resolutions to compliance-enforcing SQL views. Such views have a set of very interesting properties: (1) They are auto-generated from declarative data annotations. (2) They respect user-level consent and preferences (3) They are context-aware, encoding a different set of transformations for different use cases (4) They are portable; while the SQL logic is only implemented in one SQL dialect, it is accessible in all engines.
#SQL #Views #Privacy #Compliance #DataLake
State of Artificial intelligence Report 2023kuntobimo2016
Artificial intelligence (AI) is a multidisciplinary field of science and engineering whose goal is to create intelligent machines.
We believe that AI will be a force multiplier on technological progress in our increasingly digital, data-driven world. This is because everything around us today, ranging from culture to consumer products, is a product of intelligence.
The State of AI Report is now in its sixth year. Consider this report as a compilation of the most interesting things we’ve seen with a goal of triggering an informed conversation about the state of AI and its implication for the future.
We consider the following key dimensions in our report:
Research: Technology breakthroughs and their capabilities.
Industry: Areas of commercial application for AI and its business impact.
Politics: Regulation of AI, its economic implications and the evolving geopolitics of AI.
Safety: Identifying and mitigating catastrophic risks that highly-capable future AI systems could pose to us.
Predictions: What we believe will happen in the next 12 months and a 2022 performance review to keep us honest.
Analysis insight about a Flyball dog competition team's performanceroli9797
Insight of my analysis about a Flyball dog competition team's last year performance. Find more: https://github.com/rolandnagy-ds/flyball_race_analysis/tree/main
STATATHON: Unleashing the Power of Statistics in a 48-Hour Knowledge Extravag...sameer shah
"Join us for STATATHON, a dynamic 2-day event dedicated to exploring statistical knowledge and its real-world applications. From theory to practice, participants engage in intensive learning sessions, workshops, and challenges, fostering a deeper understanding of statistical methodologies and their significance in various fields."
1. Telecom Customer
Bases – Part 1
Indonesian Telecom Market Facts and
Numbers: Charts & Tables
2004-2008
[HR.CTD001.V1U1-2009]
Dr.-Ing. Eueung Mulyana @ Harewos Research
11/4/2009
http://www.ligarvirtual.com/harewos
2. Telecom Customer Bases – Part 1
Harewos.Research
http://www.ligarvirtual.com/harewos
Nov. 4
2
Contents
List of Figures & Tables........................................................................................................ 3
FWL vs. FWA vs. Mobile....................................................................................................... 4
Wireline vs. Wireless............................................................................................................. 6
Fixed vs. Mobile..................................................................................................................... 8
Growth ................................................................................................................................. 10
Teledensity........................................................................................................................... 16
Abbreviations & Notes ........................................................................................................ 18
3. Telecom Customer Bases – Part 1
Harewos.Research
http://www.ligarvirtual.com/harewos
Nov. 4
3
List of Figures & Tables
Figure 1 Telecom Subscribers – FWL, FWA & Mobile (2004-2008) ................................... 4
Figure 2 Market Share of Telecom Subscribers by Type (2004-2008)................................ 5
Figure 3 Market Share of Telecom Subscribers by Type at 2008E .................................... 5
Figure 4 Telecom Subscribers – Wireline & Wireless (2004-2008)..................................... 6
Figure 5 Portion of Wireless Subscribers (2004-2008) ........................................................ 7
Figure 6 Market Share of Subscribers – Wireline & Wireless (2004-2008) ....................... 7
Figure 7 Telecom Subscribers – Fixed & Mobile (2004-2008)............................................. 8
Figure 8 Portion of Mobile Subscribers (2004-2008) ........................................................... 9
Figure 9 Market Share of Subscribers – Mobile & Fixed (2004-2008) ............................... 9
Figure 10 Growth of Telecom Subscribers – All (2004-2008)............................................ 10
Figure 11 Growth of Wireless Subscribers (2004-2008).................................................... 11
Figure 12 Growth of FWL Subscribers (2004-2008).......................................................... 12
Figure 13 Growth of Fixed Subscribers (2004-2008)......................................................... 13
Figure 14 Growth of Mobile Subscribers (2004-2009)....................................................... 14
Figure 15 Growth of FWA Subscribers (2004-2008).......................................................... 15
Figure 16 Growth of FWA Subscribers – AGR & CAGR................................................... 15
Figure 17 Telecom Teledensity (2004-2008) ...................................................................... 16
Figure 18 Wireless Telecom Teledensity (2004-2008)....................................................... 16
Figure 19 Mobile / Cellular Telecom Teledensity (2004-2008).......................................... 17
Figure 20 Fixed Telecom Teledensity (2004-2008)............................................................ 17
Table 1 Number of Telecom Subscribers (2004-2008) ......................................................... 4
Table 2 Percentage of Telecom Subscribers (2004-2008) .................................................... 4
Table 3 Number of Subscribers – Wireline & Wireless (2004-2008) .................................. 6
Table 4 Percentage of Subscribers – Wireline & Wireless (2004-2008).............................. 6
Table 5 Number of Subscribers – Fixed & Mobile (2004-2008) .......................................... 8
Table 6 Percentage of Subscribers – Fixed & Mobile (2004-2008)...................................... 8
Figure Table 1 Growth of Subscribers – All (AGR & CAGR)............................................ 10
Figure Table 2 Growth of Wireless Subscribers – AGR & CAGR..................................... 11
Figure Table 3 Growth of FWL Subscribers – AGR & CAGR........................................... 12
Figure Table 4 Growth of Fixed Subscribers – AGR & CAGR.......................................... 13
Figure Table 5 Growth of Mobile Subscribers – AGR & CAGR........................................ 14
4. No
Harew
http://
ov. 4
F
PSTN/FW
FWA
Mobile
PSTN/FW
FWA
Mobile
1
1
1
1
wos.Resear
/www.ligar
Figure 1 T
2
WL
3
Tab
WL
Table
0
20,000,000
40,000,000
60,000,000
80,000,000
100,000,000
120,000,000
140,000,000
160,000,000
rch
rvirtual.com
Telecom S
2004E
8,582,228
1,684,113
30,250,415
le 1 Num
2004E
21.2
4.2
74.7
e 2 Percen
0
0
0
0
0
PSTN/
m/harewos
FW
Subscribe
2005E
8,710,3
4,819,6
46,587,3
mber of Te
2005E
14.5
8.0
77.5
ntage of T
/FWL
All O
L vs.
ers – FWL
20
385 8
629 6
371 63
elecom Su
20
1
8
Telecom S
FWA
Opera
Telec
. FWA
L, FWA &
006E
8,738,343
6,102,137
3,803,108
ubscriber
006E
11.1
7.8
81.1
Subscrib
Mo
ators
com Custom
A vs.
& Mobile (
2007E
8,717,7
10,811,4
93,387,0
rs (2004-2
2007E
7.7
9.6
82.7
ers (2004
obile
mer Bases –
. Mob
(2004-200
20
760 8
479 21
019 140
2008)
20
5
1
8
4-2008)
– Part 1
4
bile
8)
008E
8,674,228
,124,057
0,548,229
008E
5.1
12.4
82.5
2004E
2005E
2006E
2007E
2008E
5. No
Harew
http://
ov. 4
Fig
F
MarketPercentage
wos.Resear
/www.ligar
gure 2 Ma
igure 3 M
0.0
10.0
20.0
30.0
40.0
50.0
60.0
70.0
80.0
90.0
2
MarketPercentage
rch
rvirtual.com
arket Sha
Market Sh
2004E 2
Tele
m/harewos
are of Tel
hare of Te
2005E 2
All O
Mobile
83%
ecom M
lecom Sub
elecom Su
006E 20
Opera
PSTN/F
5%
Marke
2008E
Telec
bscribers
ubscribe
007E 20
ators
FWL
%
FWA
12%
et by T
E
com Custom
s by Type
rs by Typ
008E
Type
mer Bases –
e (2004-20
pe at 2008
PSTN/FW
FWA
Mobile
– Part 1
5
008)
8E
WL
6. No
Harew
http://
ov. 4
F
Wireline
Wireless
Ta
Wireless
Wireline
Tab
1
1
1
1
1
wos.Resear
/www.ligar
Figure 4 T
2
e
s 3
able 3 Nu
2
s
e
ble 4 Perc
0
20,000,000
40,000,000
60,000,000
80,000,000
100,000,000
120,000,000
140,000,000
160,000,000
180,000,000
rch
rvirtual.com
Telecom S
2004E
8,582,228
31,934,528
umber of
2004E
78.8
21.2
centage o
0
0
0
0
0
0
W
m/harewos
W
Subscribe
2005E
8,710,3
51,407,0
Subscrib
2005E
85.5
14.5
of Subscr
Wireline
All O
Wire
ers – Wir
20
385 8
000 69
bers – Wir
20
8
1
ibers – W
Opera
Telec
eline
eline & W
006E
8,738,343
9,905,245
reline & W
006E
88.9
11.1
Wireline &
Wireless
ators
com Custom
vs. W
Wireless (
2007E
8,717,7
104,198,4
Wireless (
2007E
92.3
7.7
& Wireles
mer Bases –
Wirel
(2004-2008
20
760 8
498 161
(2004-200
20
9
5
s (2004-20
– Part 1
6
less
8)
008E
8,674,228
,672,286
08)
008E
94.9
5.1
008)
2004E
2005E
2006E
2007E
2008E
7. No
Harew
http://
ov. 4
Figur
wos.Resear
/www.ligar
Figu
re 6 Mark
78.
2004
rch
rvirtual.com
ure 5 Port
ket Share
.8
4E 2
W
Te
W
m/harewos
tion of W
e of Subsc
85.5
2005E
Wireles
W
lecom
Wirelin
Wireless Su
cribers –
88.9
2006E
ss Port
Wir
9
Wireline
5%
m Mark
ne vs. W
Telec
ubscriber
Wireline
92.3
2007E
tion (%
reless
95%
ket 200
Wirele
com Custom
rs (2004-2
e & Wirele
3 9
E 20
%)
08E
ss
mer Bases –
2008)
ess (2004-
94.9
008E
– Part 1
7
-2008)
8. No
Harew
http://
ov. 4
Fixed
Mobile
Fixed
Mobile
T
1
1
1
1
wos.Resear
/www.ligar
Figure 7
2
1
3
Table 5 N
2
Table 6 Pe
0
20,000,000
40,000,000
60,000,000
80,000,000
100,000,000
120,000,000
140,000,000
160,000,000
rch
rvirtual.com
7 Telecom
2004E
10,266,341
30,250,415
Number o
2004E
25.3
74.7
ercentage
0
0
0
0
0
m/harewos
m Subscr
2005E
13,530,0
46,587,3
of Subscr
2005E
22.5
77.5
e of Subs
Fixed
All O
F
ribers – F
20
014 14
371 63
ribers – F
20
1
8
scribers –
Opera
Telec
Fixe
ixed & M
006E
4,840,480
3,803,108
Fixed & M
006E
18.9
81.1
– Fixed &
Mobile
ators
com Custom
d vs.
Mobile (20
2007E
19,529,2
93,387,0
Mobile (20
2007E
17.3
82.7
Mobile (
mer Bases –
. Mob
04-2008)
20
239 29
019 140
004-2008)
20
1
8
2004-2008
– Part 1
8
bile
008E
9,798,285
0,548,229
008E
17.5
82.5
8)
2004E
2005E
2006E
2007E
2008E
9. No
Harew
http://
ov. 4
Fig
wos.Resear
/www.ligar
Fig
gure 9 Ma
74.
2004
rch
rvirtual.com
ure 8 Por
arket Sha
.7
4E 2
M
Te
m/harewos
rtion of M
are of Sub
77.5
2005E
Mobile
Mobile
83%
lecom
Mobi
Mobile Su
bscribers
81.1
2006E
e Porti
m Mark
le vs. F
Telec
ubscriber
s – Mobile
82.7
2007E
ion (%
Fixed
17%
ket 200
Fixed
com Custom
rs (2004-2
e & Fixed
7 8
E 20
%)
08E
mer Bases –
008)
d (2004-20
82.5
008E
– Part 1
9
008)
10. No
Harew
http://
ov. 4
wos.Resear
/www.ligar
Figure
Figure
AG
CA
0
10
20
30
40
50
60
Percentage
rch
rvirtual.com
10 Growt
Table 1 G
50,000,00
100,000,00
150,000,00
200,000,00
T
20
GR 4
AGR 4
0.0
0.0
0.0
0.0
0.0
0.0
0.0
Telec
m/harewos
th of Tele
Growth o
0
00
00
00
0
2004
Telecom
G
005
8.2
8.2
com Su
ecom Sub
f Subscri
2005 200
m Sub
Growth
43%
2006
30.7
39.2
ubscrib
Telec
bscribers
ibers – Al
06 2007
bscribe
h
%
2007
43.5
40.6
ber Gr
com Custom
G
– All (200
ll (AGR &
2008
er
2
5
4
rowth
mer Bases –
Grow
04-2008)
& CAGR)
2008
50.9
43.1
– Part 1
10
wth
11. No
Harew
http://
ov. 4
F
wos.Resear
/www.ligar
Figu
Figure Ta
AG
CA
0
10
20
30
40
50
60
70
Percentage
rch
rvirtual.com
re 11 Gro
able 2 Gro
50,000,00
100,000,00
150,000,00
200,000,00
W
20
GR 6
AGR 6
0.0
0.0
0.0
0.0
0.0
0.0
0.0
0.0
Wirel
m/harewos
owth of W
owth of W
0
00
00
00
0
2004
Wireles
G
005
1.0
1.0
less Su
Wireless S
Wireless S
2005 200
ss Sub
Growth
50%
2006
36.0
48.0
ubscrib
Telec
Subscribe
Subscribe
06 2007
bscribe
h
%
2007
49.1
48.3
ber Gr
com Custom
ers (2004-
ers – AGR
2008
er
2
5
5
rowth
mer Bases –
-2008)
R & CAGR
2008
55.2
50.0
– Part 1
11
R
12. No
Harew
http://
ov. 4
wos.Resear
/www.ligar
Fig
Figure T
AG
CA
-1
-0
0
0
1
1
2
Percentage
rch
rvirtual.com
gure 12 G
Table 3 G
8,500,000
8,550,000
8,600,000
8,650,000
8,700,000
8,750,000
FW
20
GR 1
AGR 1
1.0
0.5
0.0
0.5
1.0
1.5
2.0
FW
m/harewos
Growth of
Growth of
2004 2
WL Sub
005
1.5
1.5
WL Sub
f FWL Sub
f FWL Su
2005 2006
scribe
2006
0.3
0.9
scribe
Telec
bscribers
ubscriber
6
2007
er Gro
2007
-0.2
0.5
er Gro
com Custom
s (2004-20
rs – AGR &
2008
wth
0.3%
2
wth
mer Bases –
008)
& CAGR
2008
-0.5
0.3
– Part 1
12
13. No
Harew
http://
ov. 4
wos.Resear
/www.ligar
Fig
Figure T
AG
CA
0
10
20
30
40
50
60
Percentage
rch
rvirtual.com
ure 13 Gr
Table 4 G
0
5,000,000
10,000,000
15,000,000
20,000,000
25,000,000
30,000,000
Fixe
20
GR 3
AGR 3
0.0
0.0
0.0
0.0
0.0
0.0
0.0
Fixe
m/harewos
rowth of
Growth of
0
0
0
0
2004
ed Sub
005
1.8
1.8
ed Sub
Fixed Su
f Fixed Su
2005 200
bscribe
31%
2006
9.7
20.2
bscribe
Telec
ubscriber
ubscriber
6
2007
er Gro
2007
31.6
23.9
er Gro
com Custom
rs (2004-20
rs – AGR
2008
owth
2
5
3
owth
mer Bases –
008)
& CAGR
2008
52.6
30.5
– Part 1
13
14. No
Harew
http://
ov. 4
wos.Resear
/www.ligar
Figu
Figure T
AG
CA
0
10
20
30
40
50
60
Percentage
rch
rvirtual.com
ure 14 Gr
Table 5 Gr
20,000,00
40,000,00
60,000,00
80,000,00
100,000,00
120,000,000
140,000,000
160,000,000
Mob
20
GR 5
AGR 5
0.0
0.0
0.0
0.0
0.0
0.0
0.0
Mob
m/harewos
rowth of M
rowth of
0
00
00
00
0
0
0
0
0
2004
ile Sub
005
4.0
4.0
ile Sub
Mobile Su
Mobile S
2005 200
bscrib
47%
2006
37.0
45.2
bscrib
Telec
ubscriber
ubscribe
06 2007
ber Gro
%
2007
46.4
45.6
ber Gro
com Custom
rs (2004-2
ers – AGR
2008
owth
2
5
4
owth
mer Bases –
2009)
R & CAGR
2008
50.5
46.8
– Part 1
14
R
15. No
Harew
http://
ov. 4
wos.Resear
/www.ligar
Fig
Figur
AG
CA
0
20
40
60
80
100
120
140
160
180
200
Percentage
rch
rvirtual.com
gure 15 G
re 16 Gro
0
5,000,000
10,000,000
15,000,000
20,000,000
25,000,000
FWA
20
GR 18
AGR 18
0.0
0.0
0.0
0.0
0.0
0.0
0.0
0.0
0.0
0.0
0.0
FWA
m/harewos
Growth of
owth of FW
0
0
0
0
2004
WA Sub
005
86.2
86.2
A Sub
f FWA Sub
WA Subs
2005 200
bscribe
88%
2006
26.6
90.4
scribe
Telec
bscribers
cribers –
6
2007
er Gro
%
2007
77.2
85.9
er Gro
com Custom
s (2004-20
– AGR & C
2008
wth
2
9
8
wth
mer Bases –
008)
CAGR
2008
95.4
88.2
– Part 1
15
16. No
Harew
http://
ov. 4
wos.Resear
/www.ligar
Figu
18.7
200
14.7
200
rch
rvirtual.com
Figure 1
ure 18 Wi
72%
2
04E
T
(M
76%
2
04E
W
m/harewos
17 Teleco
ireless Te
27.34%
2005E
elecom
Mobile
23.38%
2005E
Wireles
om Telede
elecom Te
35.31%
2006E
m Tele
e+FWA
31.38%
2006E
ss Tele
Telec
ensity (20
eledensit
50.04%
2007E
edensit
A+FWL
46.18%
2007E
edensit
com Custom
Tele
004-2008)
ty (2004-2
%
74.
E 200
ty
L)
%
70.
E 200
ty
mer Bases –
edens
2008)
54%
08E
75%
08E
– Part 1
16
sity
17. No
Harew
http://
ov. 4
wos.Resear
/www.ligar
Figure 1
Fig
13.9
200
3.9
0.7
200
rch
rvirtual.com
19 Mobile
gure 20 F
98%
2
04E
Mobil
97%
78%
04E
F
m/harewos
e / Cellula
Fixed Tele
21.19%
2005E
le / Cel
3.96%
2.19%
2005E
Fixed
PST
ar Teleco
ecom Tel
28.64%
2006E
llular
3.92%
2.7
2006E
Teled
TN/FWL
Telec
m Telede
ledensity
41.39%
2007E
Telede
3.86%
4%
4.79%
2007E
density
FWA
com Custom
ensity (20
(2004-20
%
61.
E 200
ensity
%
3.8
E 200
y
mer Bases –
004-2008)
08)
50%
08E
y
80%
9.24%
08E
– Part 1
17
18. Telecom Customer Bases – Part 1
Harewos.Research
http://www.ligarvirtual.com/harewos
Nov. 4
18
Abbreviations & Notes
AGR Annual Growth Rate
CAGR Compound Annual Growth Rate
2008E At the end of year 2008
FWA Fixed Wireless Access
(Limited Mobile Service)
FWL Fixed Wire-Line
(PSTN – Public Switched Telephone Network)