Downloaded 168 times


![Some definitions
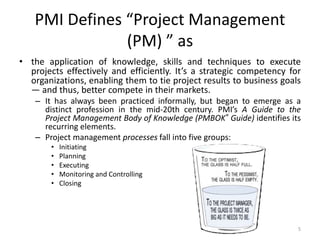
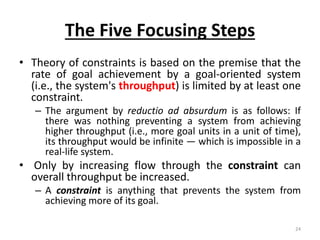
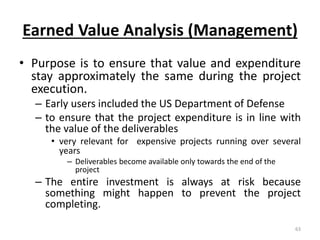
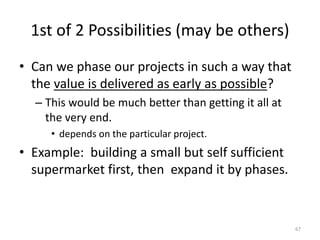
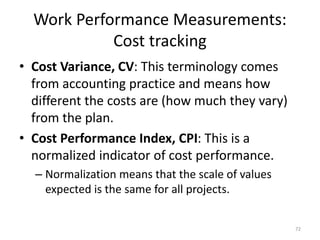
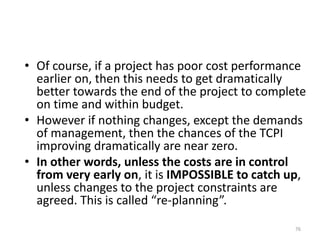
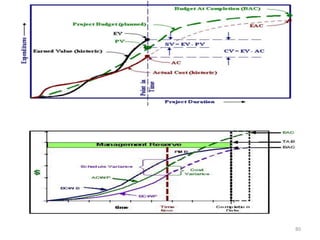
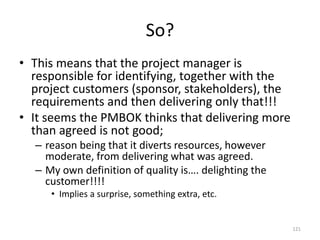
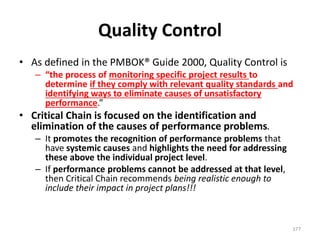
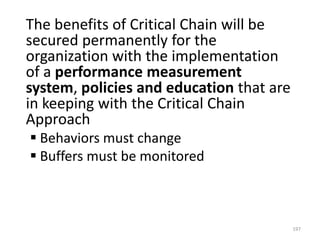
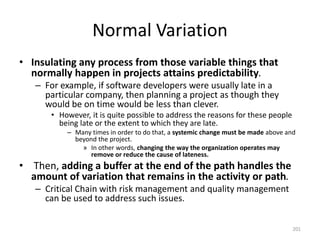
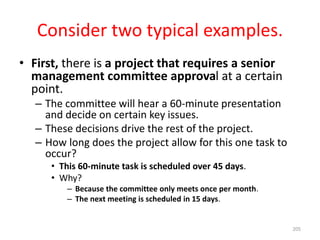
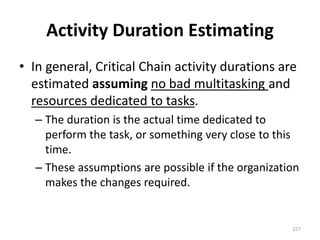
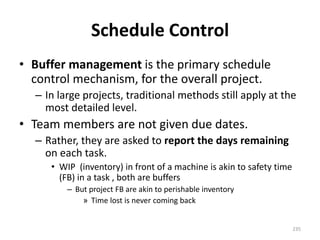
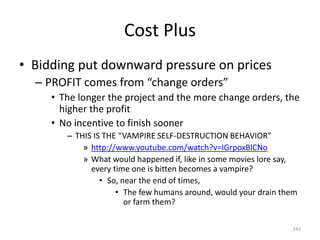
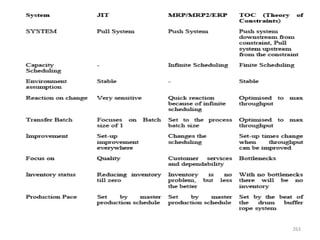
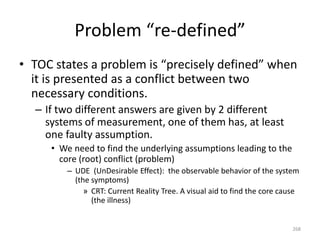
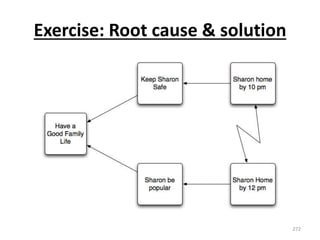
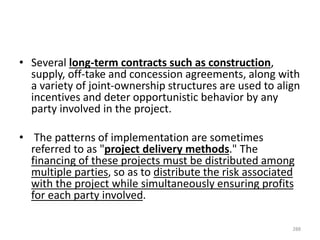
• Estimate (of costs) at Completion, EAC: the
total by how much do you think you spend at
the end of the project.
– Everything we have spent until now (Actual Costs,
AC) + our Estimate [of the remaining costs] to
Complete the project, ETC
• Variance at Completion, VAC= BAC –EAC
– by how much do you think you will be over or
under budget at the end of the project
81](https://image.slidesharecdn.com/presentationcritical-coursehere-140613085233-phpapp01/85/My-MBA-Course-on-Project-Quality-Management-81-320.jpg)

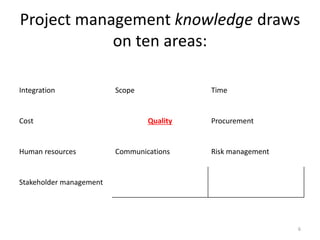
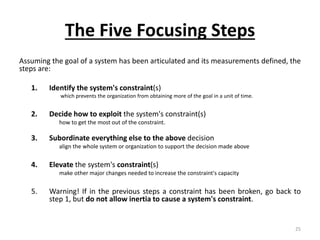
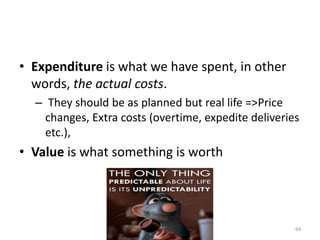
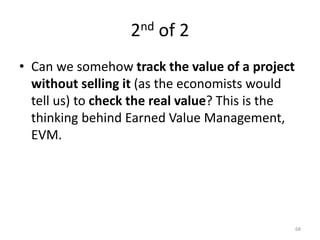
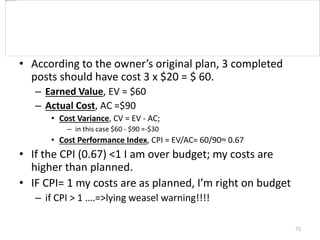
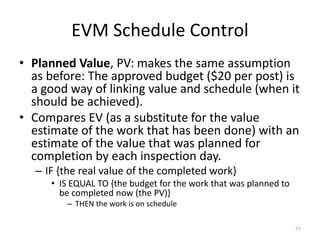
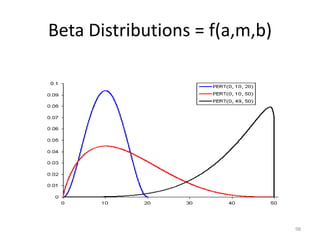
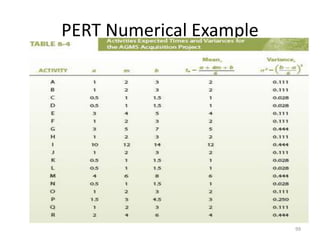
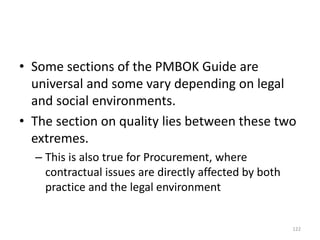
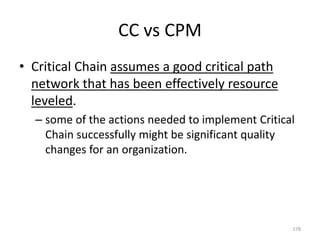
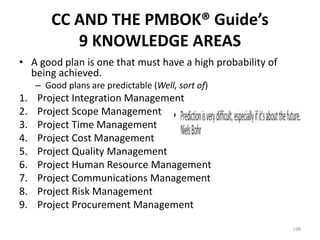
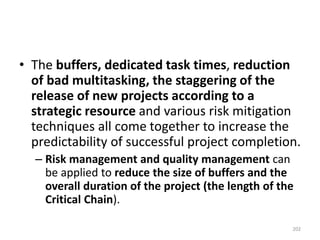
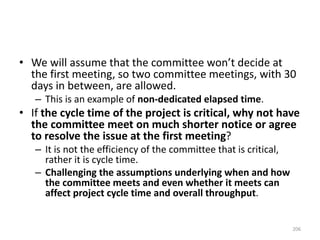
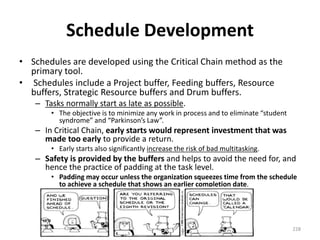
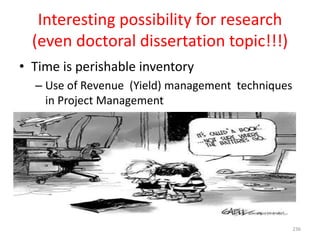
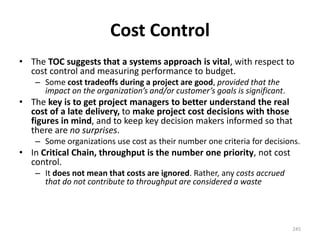
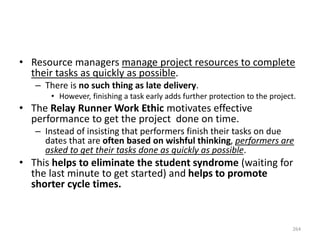
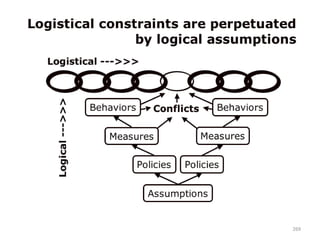
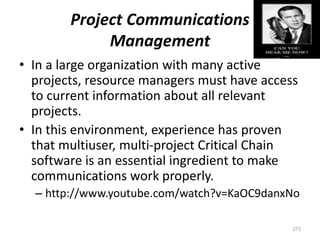
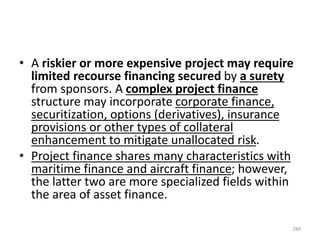
![The duration of an activity is therefore
assumed to have a beta probability
distribution in PERT analysis. Following this
distribution, the expected activity time, te =
(a+4m+b)/6, and the variance of the activity
completion time, σ2 =[(b-a)/6]2 can be
obtained.
97](https://image.slidesharecdn.com/presentationcritical-coursehere-140613085233-phpapp01/85/My-MBA-Course-on-Project-Quality-Management-97-320.jpg)


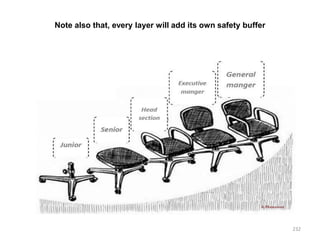


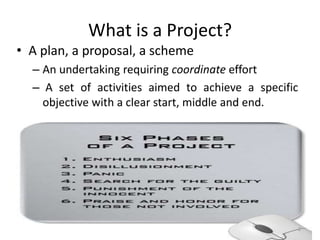
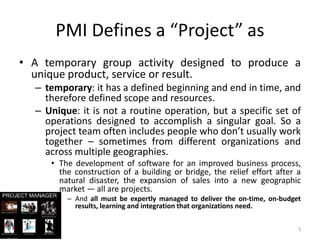
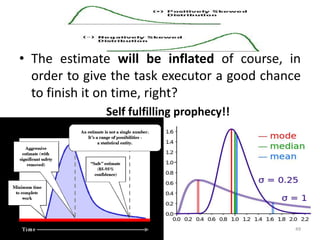
This document provides an overview of project management concepts. It defines a project as a temporary group activity with a defined beginning and end, designed to produce a unique product or service. Project management is the application of knowledge and skills to execute projects effectively and efficiently. It discusses key project management processes like initiating, planning, executing, monitoring and controlling, and closing. It also notes that project estimates tend to be inflated and based on worst-case scenarios rather than true task durations. Overall, the document introduces some foundational concepts in project management.