This report analyzes 2011 UK Census data on the Muslim population in Britain. It is divided into sections on demographic details, civic issues, inequalities, labor market/education issues. Some key findings include:
- The Muslim population grew significantly between 2001-2011, with large concentrations in several major cities.
- Muslims show higher levels of poverty and poorer health outcomes compared to other groups.
- Educational attainment among Muslims has improved but many still face barriers in the labor market, with higher rates of economic inactivity.
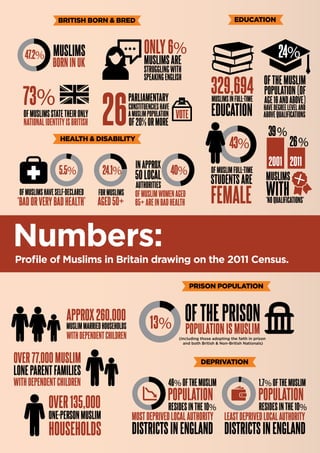
- The report aims to provide a detailed statistical profile of British Muslims using census data, to inform representation efforts and identify areas needing further research.


![23British Muslims in Numbers: Demographic Detail
The increase in the Muslim population is
consistent with other faith groups and
migration patterns. For example, the Hindu
population has increased by 48% between
2001 and 2011. Immigrants have a younger
age profile and hence are more likely to start
families – for example Poland is the most
common country of birth for non-UK born
mothers in Britain (20,495 babies in 2011).
Immigration into the UK tends to
be of young adults, adding to the
productive workforce. A growing
child population results as most
new migrants are of the age to start families.
Not until many years later will those who
immigrated become elderly and suffer
significant numbers of deaths. Thus for
many decades the population will grow due
to the number of births exceeding the
number of deaths, among the families with
a parent or grandparent who migrated to
the UK.
Ludi Simpson (2013), What makes ethnic
populations grow? Age structures and
immigration. ESRC Centre on Dynamics of
Ethnicity (CoDE).
http://www.ethnicity.ac.uk/medialibrary/
briefings/dynamicsofdiversity/what-makes-
ethnic-group-populations-grow-age-
structures-and-immigration.pdf
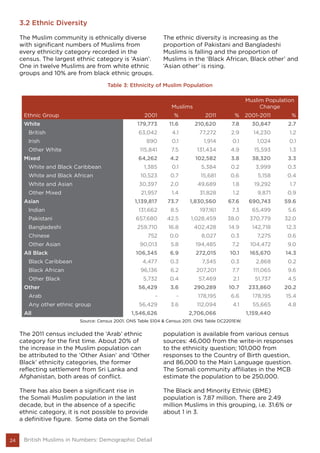
The growth in the Muslim population between
2001 and 2011 is a consequence of various
factors:
1. An age profile skewed to the younger age
bands raising children, the proportion of
females in the age band of higher fertility
and more people being born than dying.
2. Immigration from Somalia, Iraq and
Afghanistan – mainly economic migrants or
refugees.
3. Traditions of larger families in some ethnic
groups.
4. Better response to the religion question
and possibilities of undercounting in 2001.
5. Adoption of the Muslim faith.
Observations
• The increase in the Muslim population since
the last census has prompted alarmist
coverage in some sections of the media.
For example an article published by The
Telegraph included the comment, ‘it feels
as if they [Muslims] are taking over’.3
Responsible voices are needed in media
and political circles to explain the factors
responsible for the demographic profile
and its transient nature. A section of the
society comprising 1 in 20 of persons in the
overall population can hardly ‘take over’.
• With 53% of Muslims born outside Britain,
these family and other connections
present a strategic opportunity for the
nation, particularly in promoting economic
links and trade. As remarked by the
Prime Minister at the 9th World Islamic
Economic Forum held in London: ‘we are
in a global race for our economic future’.
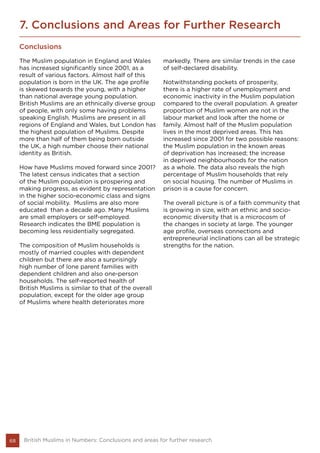
The MCB publication The Muslim Pound
(2014) notes, ‘Muslim connections from
the Atlantic to the Pacific have helped
Britain facilitate trade to new and emerging
markets. And with this globalised Muslim
community, British Muslims join fellow
countrymen in providing a world-class
workforce’.
End Notes
1. Nomis official labour market statistics. Office for
National Statistics. www.nomisweb.co.uk
2. Due to a change in some Country of Birth categories,
not all respondents from 2001 are included in Table 2.
3. Jane Kelly (2013), ‘I feel like a stranger where I live’,
The Telegraph, 29 January.](https://image.slidesharecdn.com/mcbcensusreport2015-150420165635-conversion-gate01/85/Muslim-Study-by-MCB-23-320.jpg)
![27British Muslims in Numbers: Demographic Summary
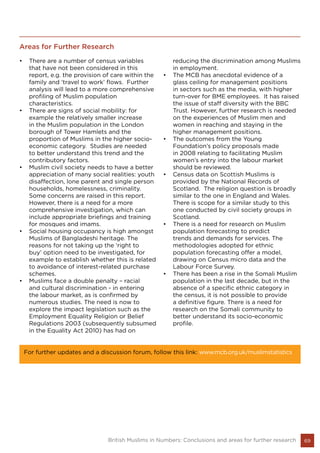
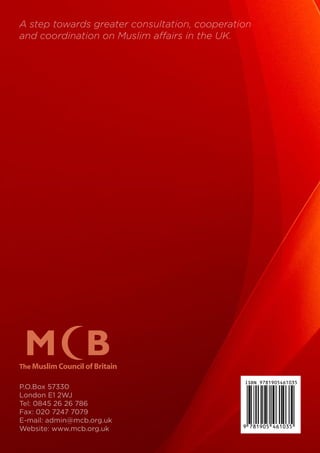
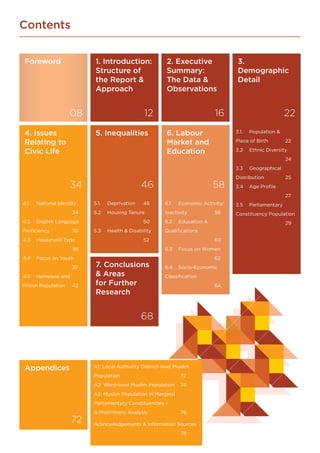
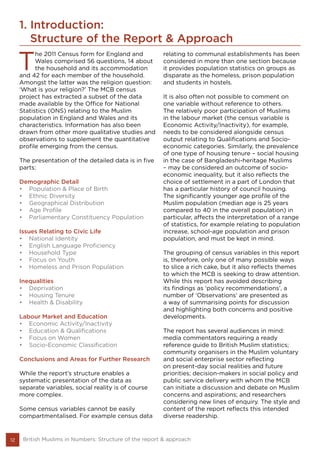
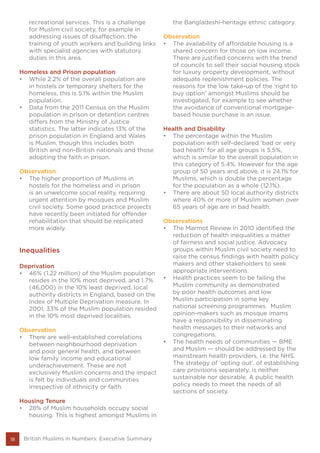
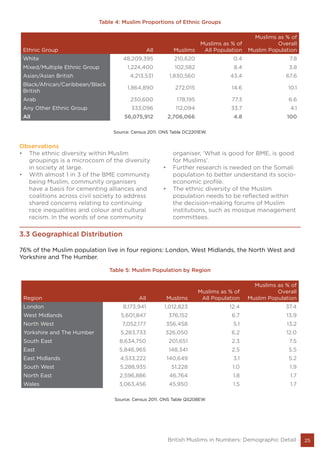
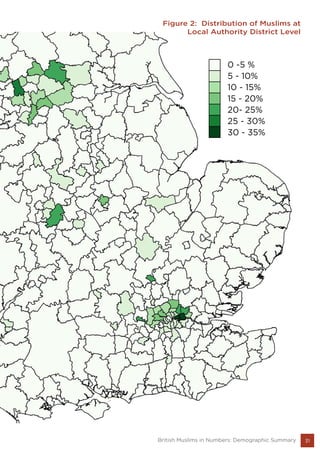
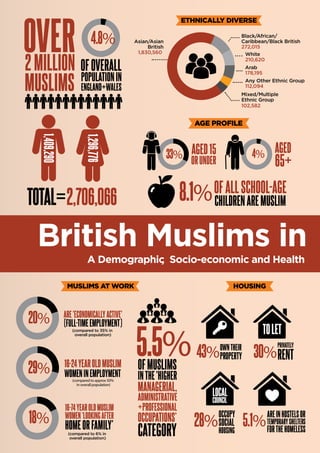
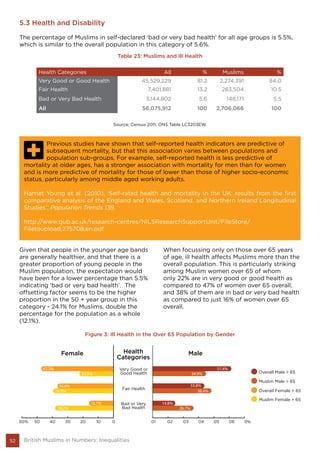
3.4 Age Profile
The Muslim population, in common with the
Black and Minority Ethnic (BME) population,
has a different age profile to the rest of the
population. It is younger than the overall
population with a much greater proportion
of age 15 years or under, and a much smaller
proportion over 65 than in the overall
population. 33% of the Muslim population
was aged 15 years or under in 2011 compared
to 19% of the overall population; only 4% of
Muslims were aged 65 or over compared to
16% of the overall population.
Figure 1: Overall Population and Muslim Population Age Profile
The median age of the Muslim population is 25 years, compared to the overall population’s
median age of 40 years.
Neighbourhood residential integration is increasing: segregation, the extent to which
an ethnic group is evenly spread across neighbourhoods, has decreased within most
local authority districts of England and Wales, for all ethnic minority groups. [...]
Increasing residential mixing in inner and outer London and major urban centres is
the dominant pattern of change in segregation. In outer London, for example, segregation
decreased by 12% for the Bangladeshi ethnic group [...]. Segregation has decreased in
metropolitan districts for all ethnic groups except White British.
Gemma Catney (2013), Has neighbourhood ethnic segregation decreased? ESRC Centre on
Dynamics of Ethnicity (CoDE).
http://www.ethnicity.ac.uk/medialibrary/briefingsupdated/has-neighbourhood-ethnic-
segregation-decreased.pdf
65+
25-64
16-24
5-15
0-4
16%
Age
53% 48%
15%12%
13%
6% 12%
21%
4%](https://image.slidesharecdn.com/mcbcensusreport2015-150420165635-conversion-gate01/85/Muslim-Study-by-MCB-27-320.jpg)
![28 British Muslims in Numbers: Demographic Summary
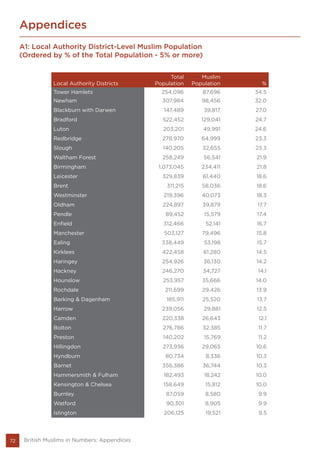
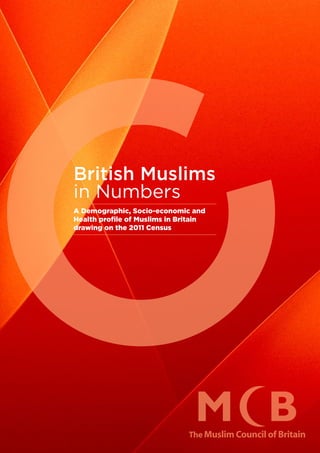
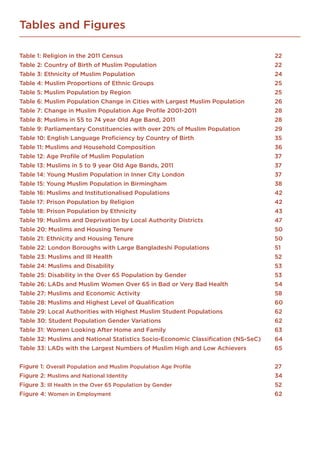
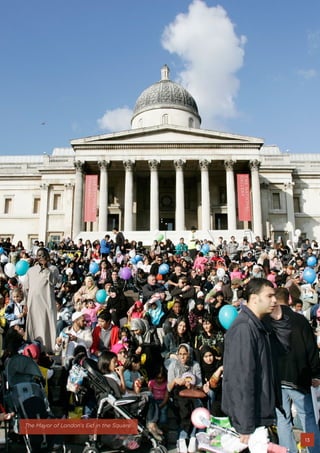
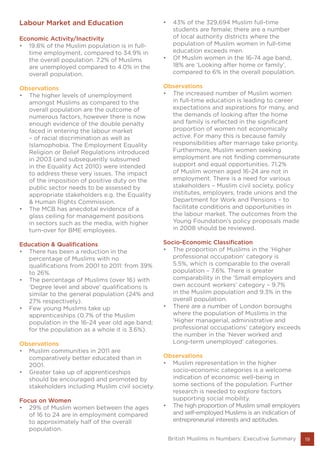
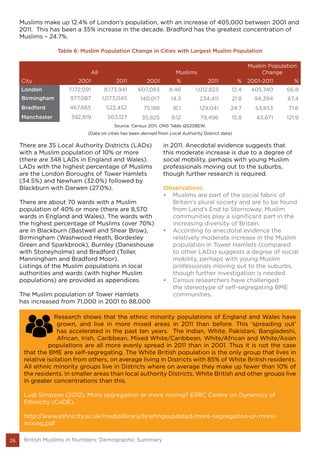
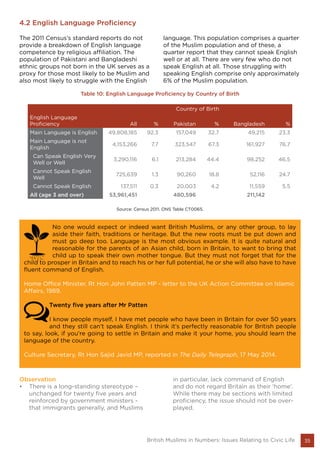
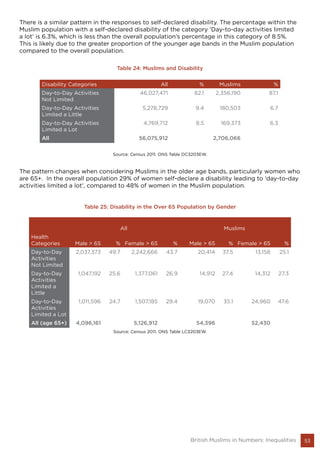
A comparison of the Muslim population
between 2001 and 2011 indicates that while
there have been significant increases in the
Muslim population at all ages the population
does seem to be getting older overall: the 25-
64 age group seeing the biggest gain in both
absolute numbers (604,222) and in their share
of the overall Muslim population (from 44.3%
to 47.7%), and the 16-24 age group seeing
the biggest fall in their share of the Muslim
population (from 18.2% to 15.3%). This along
with the growth in the 0-4 age group suggests
that the Muslim population is increasingly
shifting from school age towards young and
middle-aged adults.
In a decade from now there will be
approximately 190,000 Muslims in the 65
to 84 year old age band, based on a simple
extrapolation of the population in the 55 to
74 year old age band in 2011, not taking into
account mortality and emigration.
Table 8: Muslims in 55 to 74 year old Age Band,
2011
Age Group Muslims
Muslims as % of
Overall
Muslim Population
55 - 59 75,000 2.8
60 - 64 46,890 1.7
65 - 69 33,457 1.2
70 - 74 33,742 1.2
189,089
Table 7: Change in Muslim Population Age Profile 2001-2011
Muslims
Muslim Population
Change
Age Group 2001 % 2011 % 2001-2011 %
0 - 4 176,264 11.4 317,952 11.7 141,688 80.4
5 -15 346,596 22.4 577,185 21.3 230,589 66.5
16 - 24 281,628 18.2 414,245 15.3 132,617 47.1
25 - 64 685,636 44.3 1,289,858 47.7 604,222 88.1
65+ 56,502 3.7 106,826 3.9 50,324 89.1
All 1,546,626 2,706,066 1,159,440
Source: Census 2001. ONS Table S149 & Census 2011. ONS Table DC2107EW.
[…] a Muslim lady had a far more negative experience when she moved into the home.
Despite requiring a strict halal diet, some carers were caught feeding this lady non-halal
meat. When these carers were questioned about the food, they said that this lady’s
dementia was so severe she wouldn’t know what she was being given, and had been
willing to eat it so it made no difference. Moreover, with the exception of one carer who was
from the same cultural background as this lady, no others were able to correctly assist her to
dress in a manner befitting her cultural and religious heritage... Often a person with dementia
cannot fight back against this, demand better or indeed remove themselves from what has to
be considered a form of abuse, hence why we need a far greater emphasis on these elements
of care.
Beth Britton (2013), Keep the Faith. D4Dementia Blog.
http://d4dementia.blogspot.co.uk/2013/07/keep-faith.html
Source: Census 2011. ONS Table DC2107EW.](https://image.slidesharecdn.com/mcbcensusreport2015-150420165635-conversion-gate01/85/Muslim-Study-by-MCB-28-320.jpg)


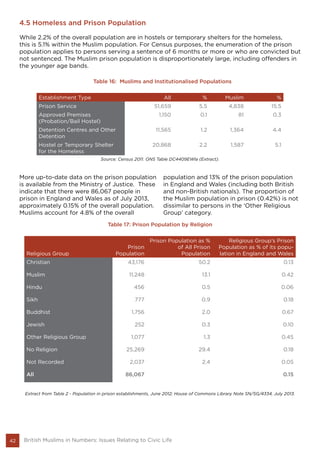
![34 British Muslims in Numbers: Issues Relating to Civic Life
4. Issues Relating to Civic Life
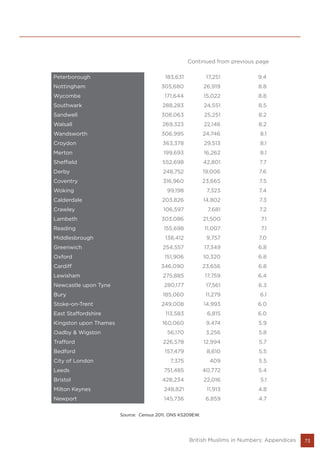
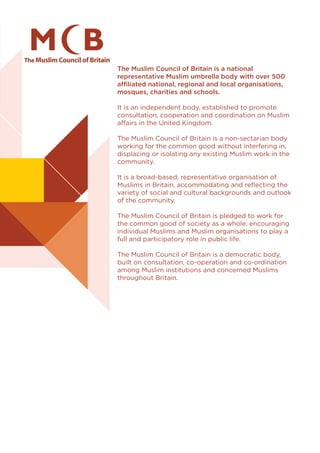
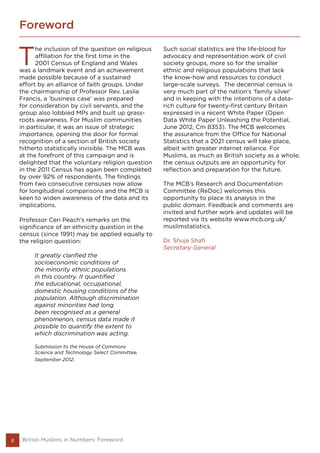
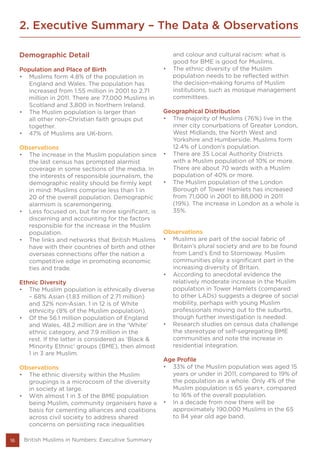
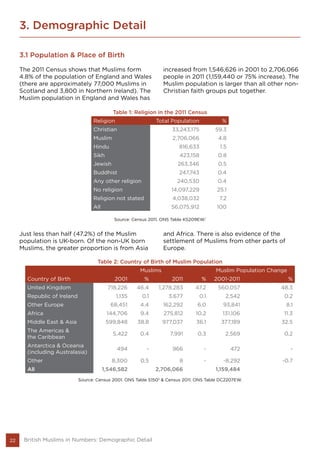
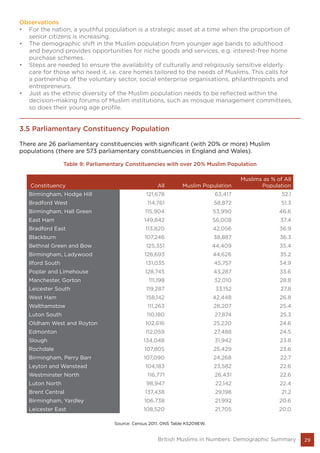
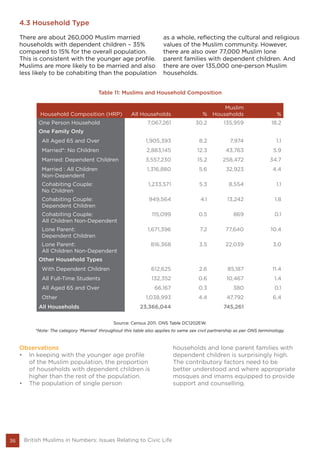
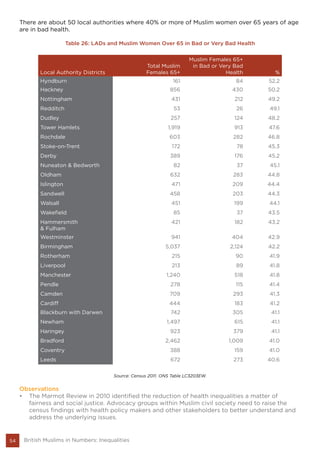
4.1 National Identity
Despite more than half of the Muslim
population being born outside the UK, 73%
of the Muslim population consider British
to be their only national identity. This is
midway between other non-Christian faith
communities of Asian heritage: 66% of Hindus
and 81% of the Sikh population also respond
similarly.
Responses to a question on identity and belonging
I really have no confusion about my identity whatsoever […] I am completely British.
Yes, I have ethnic roots from Pakistan but I do not feel Pakistani at all. I haven’t been
back for a long time. [...] I am certain that my home is Britain, and this is where I belong.
Nabila, 32 years old.
Sundas Ali (2013), Identities and Sense of Belonging of Muslims in Britain: Using Survey
Data, Cognitive Survey Methodology, and In-Depth Interviews. DPhil Thesis. Department of
Sociology, University of Oxford, April 2013.
[...] The value of donations by British Muslims to Muslim and non-Muslim causes
via JustGiving increased from £116,000 in 2010 to £200,000 in 2012 [...] JustGiving
commissioned ICM Research to undertake an online survey of 4,000 adults between
22 and 27 June 2013, which suggested that Muslims gave more than twice as much per
capita to charity last year as the average Briton (£371 versus £165).
Justgiving. Ramadan donations cause spike in digital giving: British Muslims take Zakat
donations online.
http://www.justgiving.com/en/SharedMedia/press-releases/Ramadan%20donations%20
cause%20spike%20in%20digital%20giving.pdf
Other Identity and at least one UK Identity
Other Identity Only
Irish Identity
British Only Identity (And/or at least one UK Identity)
Figure 2: Muslims and National Identity
Observation
• The Census finding on national identity is
consistent with other studies and academic
research, including the recent YouGov poll
that found 63% of British Muslims were
proud of being British.1
• The overwhelming majority of Muslims see
their foremost national identity as ‘British’.
They also have family and cultural links
globally. Both these elements find expression
in the national tradition of charity giving,
both for non-Muslim and Muslim causes.
End Notes
1. YouGov poll conducted for Islamic Relief, June 2014:
http://www.islamic-relief.org.uk/news/press-releases/
yougov-poll-ramadan-muslims-british-values-islamic-
relief-government-funding/](https://image.slidesharecdn.com/mcbcensusreport2015-150420165635-conversion-gate01/85/Muslim-Study-by-MCB-34-320.jpg)
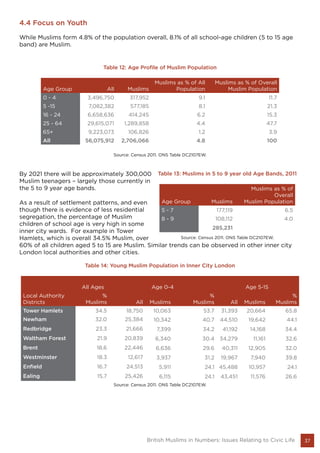
![38 British Muslims in Numbers: Issues Relating to Civic Life
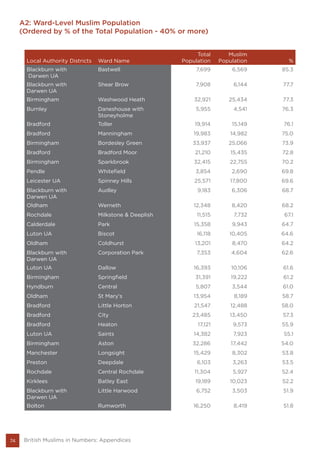
In Birmingham many wards have young Muslim populations making up more than 80% of the
school age population. For example, while Muslims make up 7% of the population of West
Midlands, in the Washwood Heath ward in Birmingham 86% of all children aged between 5 to 15
years are Muslim.
Table 15: Young Muslim Population in Birmingham
All Ages Age 0-4 Age 5-15
Ward % Muslims All Muslims % Muslims All Muslims % Muslims
Washwood Heath 77.3 3,520 2,935 83.4 7650 6547 85.6
Bordesley Green 73.9 3,660 2,979 81.4 7798 6531 83.8
Sparkbrook 70.2 3,282 2,670 81.4 6715 5526 82.3
Springfield 61.2 3,012 2,261 75.1 6020 4510 74.9
Aston 54.0 3,190 2,109 66.1 6046 4173 69.0
Lozells and East
Handsworth
48.9 2,874 1,750 60.9 6012 3749 62.4
Nechells 43.5 3,322 2,086 62.8 5677 3710 65.4
Hodge Hill 41.5 2,657 1,562 58.8 5363 3136 58.5
South Yardley 33.6 2,898 1,427 49.2 5320 2638 49.6
Source: Census 2011. ONS Table DC2107EW.
Given the gap […] between
the official lack of educational
recognition of Britain’s second
faith and its seminal importance to the
lives and identities of many young British
Muslims, it is perhaps unsurprising that
both national statistics and qualitative
academic research suggest that British
Muslim adolescent males are not fulfilling
their educational potential in core
subjects and in foundation subjects such
as history. The factors in the educational
under-attainment of young British
Muslim males are complex. Researchers
have referred variously to overcrowded
housing, the relative absence of parental
English language skills in some Muslim
communities, low levels of parental
engagement with mainstream schools,
low teacher expectations, the curricular
removal of Islam from the school learning
environment, and racism and anti-Muslim
prejudice as contributory factors.
Matthew Wilkinson (2014), ‘Helping
Muslim boys succeed: the case for history
education’, The Curriculum Journal, 25
(3): 396-431.
TheMuslimCouncilofBritain(MCB)
today noted its serious concern at
the conduct and outcome of the
Ofsted investigation into state
schools in Birmingham. The investigations
wereorderedbytheDepartmentforEducation
following the circulation of what is widely
believed to be a fake dossier titled “Trojan
Horse” outlining a plot of a ‘Muslim takeover
of schools’ […]. With Ofsted giving these
schools favourable reports in previous years,
how have the criteria changed to warrant
such a dramatic change? It seems that these
schools have now been downgraded on new
assessment criteria – preparing pupils for life
in modern Britain. Many are concerned that
this new benchmark is being arbitrarily and
inconsistently applied. The Ofsted report
has highlighted issues of governance. If
there are irregularities, then of course these
should be looked at. But to conflate them
with issues of security and extremism is a
dangerous approach […]. For the avoidance
of any doubt, let us be clear on where the
MCB stands on education in our schools. We
call for an inclusive education, and we call for
fairness, not favours.
MCB Press Release, 9 June 2014.](https://image.slidesharecdn.com/mcbcensusreport2015-150420165635-conversion-gate01/85/Muslim-Study-by-MCB-38-320.jpg)
![39British Muslims in Numbers: Issues Relating to Civic Life
What is clear is that mainstream youth work as we know it is facilitated by a myriad
of agencies […] this infrastructure is far from representative of Muslim youth
concerns […] The question for the Muslim community is not one of whether the
infrastructure is diverse enough […] but what supports it, informs it, trains people
in it and provides critique over the dimensions of quality of practice, equality and
participation. The emergence of a Muslim youth work degree at the University of Chester was
one such opportunity, and its closure is a real loss of opportunity.
Muhammad G. Khan (2013), Young Muslims, Pedagogy and Islam. Bristol: Policy Press.
We agree that the quality of careers provision is vital if it is to help young people
effectively […] face-to-face support should be secured where it is the most suitable
support for young people to make successful transitions, particularly for those from
disadvantaged backgrounds or those who have special educational needs, learning
difficulties or disabilities […] The report emphasises top-down accountability and
calls for Ofsted to play a stronger role in inspecting the quality of careers provision.
House of Commons Education Committee (2013), Careers Guidance for Young People: The
impact of the new duty on schools: government response to the Committee’s Seventh Report
of Session 2012–13. The Stationery Office.
http://www.publications.parliament.uk/pa/cm201213/cmselect/cmeduc/1078/1078.pdf
Observations
• There are many stakeholders rightly
concerned with the well-being and
educational potential of Muslim and BME
youth. The need of the hour is to address
issues such as underachievement, low
teacher expectations, high rates of student
exclusions, racism and Islamophobia,
lack of role models and levels of parental
involvement. Events such as the Trojan
Horse affair have unfortunately only served
to dishearten Muslim educationalists and
community organisers seeking the best for
local children.
• With public sector cuts in youth services,
there will be a reduced safety net in terms
of counselling services and provision of
recreational services. This is a challenge
for Muslim civil society, for example in
addressing issues of disaffection, the
training of youth workers and building links
with specialist agencies with statutory
duties in this area.
• Research has suggested that the lack
of good careers advice may particularly
disadvantage young people from low-
income backgrounds and from some ethnic
minority groups, including those where
there is a lot of self-employment.](https://image.slidesharecdn.com/mcbcensusreport2015-150420165635-conversion-gate01/85/Muslim-Study-by-MCB-39-320.jpg)
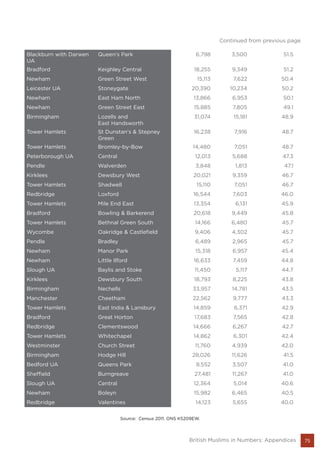
![43British Muslims in Numbers: Issues Relating to Civic Life
Table 18: Prison Population by Ethnicity
Ethnic Categories All Prisoners %
Muslim
Prisoners %
White 61,867 71.9 1,535 13.6
Mixed 3,159 3.7 889 7.9
Asian or Asian British 6,335 7.4 4,550 40.5
Black or Black British 11,281 13.1 3,528 31.4
Chinese or Other Ethnic Group 960 1.1 314 2.8
Not Stated 137 0.2 38 0.3
Unrecorded 2,308 2.7 394 3.5
All 86,048 11,248
Extract from Table A1.24, Offender management caseload statistics 2012.
Muslims of ‘Asian or Asian British’ ethnicity
who comprise 68% of the overall Muslim
population form 41% of the Muslim prison
population. Muslims of the ‘Black or Black
British’ ethnicity comprising 10% of the overall
Muslim population, form 31% of the Muslim
prison population. It would therefore be wrong
to generalise that Muslims in detention are
predominantly of Asian ethnicity. Since the
Stephen Lawrence inquiry there has been
greater awareness of the over-representation
of African Caribbean young men in prison,
with contributory factors such as an
institutionally racist criminal justice system;
there are however broader issues of social
disadvantage at play as well.1
The Date Palm Project (DPP) is an 8-bed supported housing project in the London
Borough of Brent. The project will accommodate and support select, young, Muslim
prison leavers, help them readjust to life outside of prison, assist their rehabilitation
and break the cycle of reoffending whilst providing specialised mentoring and
career development all delivered within an Islamic household environment. The DPP focuses
on prison leavers who have decided to make a change.
The Date Palm Project (DPP), Better Community Business Network: The Professional Business
Networking & Charitable Forum.
http://www.bcbn.org.uk/date-palm-project.html
[...] It is vital that the new community rehabilitation companies engage with
community organisations and support the development of social capital which in
turn can facilitate positive resettlement outcomes for young Black and Muslim men
and their communities. [...] One organisation we visited whose main client group was
Muslim offenders, was addressing the stigma attached to offending and the resulting
rejection of offenders. They are working with the local mosques, communities and families to
remind them of the importance of forgiveness as an Islamic concept. They organised visits for
groups of Imams to the local prisons [...]
The Young Review (2014), Improving Outcomes for Young Black/Muslim men in the Criminal
Justice System.
http://www.youngreview.org/sites/default/files/clinks_young-review_report_dec2014.pdf
Observation
• The higher proportion of Muslims in
hostels for the homeless and in prison is an
unwelcome social reality, requiring urgent
attention by mosques and Muslim civil society.
Research is needed to understand factors
contributing to criminality and recidivism.
End Notes
1. See report: Runnymede Perspectives (2012),
Criminal Justice vs Racial Justice: Minority ethnic
overrepresentation in the criminal justice system.
http://www.runnymedetrust.
org/uploads/publications/pdfs/
CriminalJusticeVRacialJustice-2012.pdf](https://image.slidesharecdn.com/mcbcensusreport2015-150420165635-conversion-gate01/85/Muslim-Study-by-MCB-43-320.jpg)


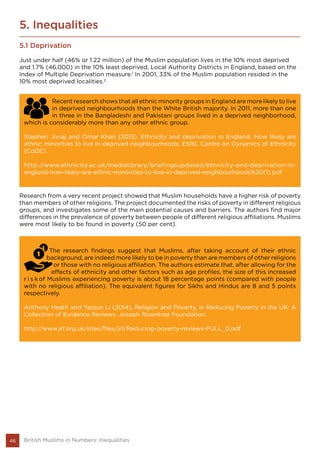
![End Notes
1. The Index of Multiple Deprivation 2010 (IMD 2010) identifies neighbourhood concentrations of multiple
deprivation. The term multiple deprivation refers to seven dimensions: income, employment, health, education,
barriers to housing and services, crime, and living environment. More than half of all Muslims in Britain live in the
most deprived 20% of small areas, known as Lower Super Output Area level (LSOA) in ONS Geography; 5% of
Muslims live in the least deprived small areas.
2. Review of the Evidence Base on Faith Communities. Research by the Mercia Group: Professor James Beckford,
University of Warwick. Report prepared for the Office of the Deputy Prime Minister, 2006. Direct comparability
of geographies used in IMD reporting in 2001 and 2011 has proven difficult.
48 British Muslims in Numbers: Inequalities
Observation
• A large proportion of the Muslim population, like the BME population, live in the poorer,
deprived neighbourhoods. There are well-established correlations between neighbourhood
deprivation and poor general health, or between low family income and educational
underachievement. These are not exclusively Muslim concerns and the impact is felt by
individuals and communities irrespective of ethnicity or faith.
It has been found that
neighbourhood socioeconomic
status may have different
health outcomes. […]
both individual and neighbourhood
deprivation increased the risk of
poor general and mental health. […]
It was found that living in a deprived
neighbourhood might have the most
negative health effects on poorer
individuals, possibly because they are
more dependent on collective resources
in the neighbourhood.
Mai Stafford and Michael Marmot (2002),
‘Neighbourhood deprivation and health:
does it affect us all equally?’ International
Journal of Epidemiology, 32 (3): 357-366.
http://ije.oxfordjournals.org/
content/32/3/357.full
The proportion of good or
outstanding schools in the most
deprived areas is 20 percentage
points lower than in the least
deprived areas. Moreover, the proportion of
outstanding schools in the least deprived
areas is nearly double that found in the
‘deprived’ and ‘most deprived’ communities.
Ofsted Report (2013), Unseen Children
– Access and Achievement 20 years on.
Evidence Report.
https://www.gov.uk/government/uploads/
system/uploads/attachment_data/
file/379157/Unseen_20children_20-_20acce
ss_20and_20achievement_2020_20years_2
0on.pdf](https://image.slidesharecdn.com/mcbcensusreport2015-150420165635-conversion-gate01/85/Muslim-Study-by-MCB-48-320.jpg)


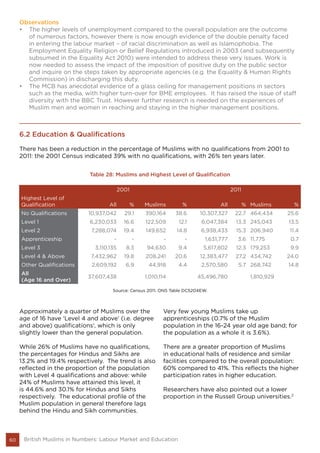
![58 British Muslims in Numbers: Labour Market and Education
6. Labour Market and Education
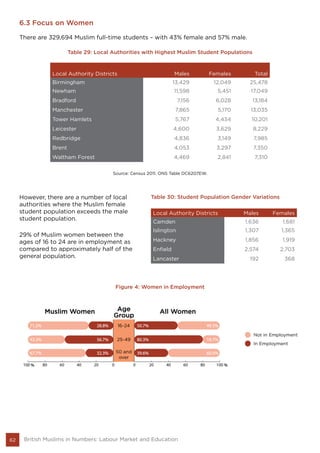
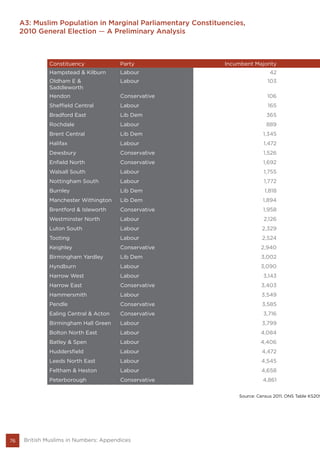
6.1 Economic Activity/Inactivity
1 in 5 (19.8%) of the Muslim population is in full-time employment, compared to more than 1 in 3
of the general population (16-74 years old).
Table 27: Muslims and Economic Activity
All % Muslims %
Economically Active
In Employment
Employee: Part-Time 5,701,111 12.5 236,206 13.0
Employee: Full-Time 15,858,791 34.9 358,413 19.8
Self-Employed: Part-time 1,220,761 2.7 71,452 3.9
Self-Employed: Full-time 2,823,552 6.2 99,466 5.5
Full-Time Students 1,077,353 2.4 65,759 3.6
Unemployed
Unemployed
(Excluding Full-Time Students)
1,802,620 4.0 130,553 7.2
Full-Time Students 334,167 0.7 37,801 2.1
Economically Inactive
Retired 9,713,808 21.4 104,959 5.8
Student (Including Full-Time Students) 2,397,348 5.3 240,248 13.3
Looking After Home or Family 1,796,520 3.9 247,729 13.7
Long-Term Sick or Disabled 1,783,292 3.9 93,179 5.1
Other 987,457 2.2 125,164 6.9
All (ages 16-74) 45,496,780 1,810,929
Source: Census 2011. ONS Table DC6205EW.
Excluding students, the rate of unemployment for Muslims is nearly double that of the general
population (7.2% compared to 4.0%).
Cultural penalties, almost entirely those suffered by Muslims, exacerbate the
ethnic penalty in undermining the employability of minorities (though more
so for Muslims from some ethnic origins than others). These findings lend
firm support to the previous studies focusing on religious disadvantage in the
British labour market [...] Muslims, particularly those without qualifications, were by far the
most affected by growing unemployment in this [post 2007-recession] period.
Nabil Khattab and Ron Johnston (2014), ‘Ethnic and religious penalties in a changing British
labour market from 2002 to 2010: the case of unemployment’, Environment and Planning A
2013, 45: 1358-1371.](https://image.slidesharecdn.com/mcbcensusreport2015-150420165635-conversion-gate01/85/Muslim-Study-by-MCB-58-320.jpg)
![This study by the Centre for Studies of Arab and Muslim Issues (CSAMI) attempted
to explore the experiences of British Arab Muslims attaining employment in the UK
and their experiences within the workplace […]. Just over half the sample admitted
to having a negative experience attaining employment and within the workplace.
This negativity was often attributed to their religion.
Centre for Studies of Arab & Muslim Issues (2014), British Arab Muslim experiences attaining
employment and their experiences in the workplace.
The results demonstrate a strong ‘Muslim penalty’ for both women and men from
different ethnic groups with respect to economic activity and unemployment.
Anthony Heath and Jean Martin (2012), ‘Can religious affiliation explain ‘ethnic’ inequalities in
the labour market?’ Ethnic and Racial Studies 36 (6): 1005-27.
Researchers commissioned by the Department for Work and Pensions sent nearly
3,000 applications for 987 vacancies under false identities, using the names Nazia
Mahmood, Mariam Namagembe and Alison Taylor. Each had similar experiences
and qualifications, and had British education and work histories. They found that an
applicant who appeared to be white would send nine applications before receiving a positive
response of either an invitation to an interview or an encouraging telephone call. Minority
candidates with the same qualifications and experience had to send 16 applications before
receiving a similar response.
Rajeev Syal (2009), Undercover job hunters reveal huge race bias in Britain’s workplaces. The
Observer, 18 October.
http://www.theguardian.com/money/2009/oct/18/racism-discrimination-employment-
undercover
[BBC] Five Live mounted an undercover survey lasting ten months in which dummy
CVs were sent out to a wide range of companies in response to recruitment
advertisements. Five Live produced CVs for six fictional candidates - Abu Olasemi,
Fatima Khan, Jenny Hughes, John Andrews, Nasser Hanif and Yinka Olatande. All the fictitious
applicants were the same standard in terms of qualifications and experience but were written
and presented differently to increase their authenticity to recruiters. But while 23 per cent of
the white candidates’ applications were invited for interview, only 13 and 9 per cent respectively
were successful from the Black African and Muslim candidates.
BBC (2004), Five Live survey suggests ethnic minority applicants still discriminated against in
UK job market. Press Releases.
http://www.bbc.co.uk/pressoffice/pressreleases/stories/2004/07_july/12/minorities_survey.shtml
59British Muslims in Numbers: Labour Market and Education
Research shows that Muslims tend to experience an additional disadvantage above their ethnic
disadvantages in the labour market.](https://image.slidesharecdn.com/mcbcensusreport2015-150420165635-conversion-gate01/85/Muslim-Study-by-MCB-59-320.jpg)
![61British Muslims in Numbers: Labour Market and Education
End Notes
1. Level 1 qualifications: 1-4 O Levels/CSE/GCSEs (any grades), Entry Level, Foundation Diploma, NVQ level 1, Foun-
dation GNVQ, Basic/Essential Skills.
Level 2 qualifications: 5+ O Level (Passes)/CSEs (Grade 1)/GCSEs (Grades A*-C), School Certificate, 1 A Level/ 2-3
AS Levels/VCEs, Intermediate/Higher Diploma, Welsh Baccalaureate Intermediate Diploma, NVQ level 2, Interme-
diate GNVQ, City and Guilds Craft, BTEC First/General Diploma, RSA Diploma Apprenticeship.
Level 3 qualifications: 2+ A Levels/VCEs, 4+ AS Levels, Higher School Certificate, Progression/Advanced Diploma,
Welsh Baccalaureate Advanced Diploma, NVQ Level 3; Advanced GNVQ, City and Guilds Advanced Craft, ONC,
OND, BTEC National, RSA Advanced Diploma.
Level 4+ qualifications: Degree (for example BA, BSc), Higher Degree (for example MA, PhD, PGCE), NVQ Level
4-5, HNC, HND, RSA Higher Diploma, BTEC Higher level, Foundation degree (NI), Professional qualifications (for
example teaching, nursing, accountancy).
2. This article reinforces the important and relevant figures on Bangladeshi and Pakistani admissions in Russell
Group universities:
Vikki Boliver (2014), Why do elite universities admit so few ethnic minority applicants? The Guardian, 8 July 2014.
http://www.theguardian.com/education/2014/jul/08/why-do-elite-universities-admit-so-few-ethnic-minority-ap-
plicants
Access to higher education is clearly an important issue as it has the potential
to act as a vehicle for social mobility and for the integration of minority ethnic
groups into particular segments of society, especially elite occupational groups. It
is important to note at the outset that minority ethnic groups have higher participation rates
in higher education than the white British ethnic group [...]. Although more likely to attend
university, students from some minority ethnic groups are significantly less likely to attend
higher status institutions [...]. For average applications from Pakistani candidates, the model
predicted seven additional rejections per 100 applications compared with the number arising
from comparable white British applications.
Philip Noden, Michael Shiner, and Tariq Modood (2014), University offer rates for candidates from
different ethnic categories, Oxford Review of Education 40 (3).
The headline conclusion of the analysis is that access to Russell Group universities is
far from ‘fair’. Importantly, unfair access is shown to take different forms for different
social groups. For those from lower social class backgrounds, the unfairness appears to
be largely to do with barriers of some kind to application to Russell Group universities
given application to university at all. In contrast, for those from Black, Pakistani and Bangladeshi
backgrounds, the unfairness seems to stem entirely from some form of differential treatment
during the admissions process by Russell Group universities. For those from state schools,
however, unfair access to Russell Group universities seems to operate equally in relation to
both application and admission.
Vikki Boliver (2013), ‘How Fair is Access to More Prestigious British Universities?’, British Journal of
Sociology 64 (2): 195-382.
http://onlinelibrary.wiley.com/doi/10.1111/1468-4446.12021/abstract
Observations
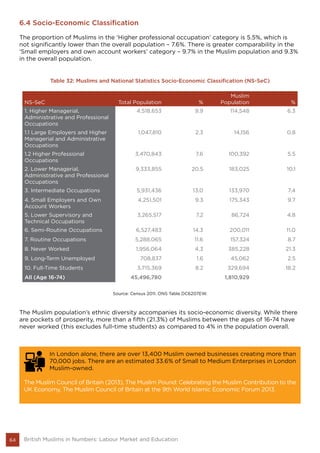
• Muslim communities in 2011 are comparatively better educated than in 2001. However
Muslims lag behind Hindus and Sikhs, both in terms of a greater proportion with no
qualifications, and a lower proportion with the higher level qualifications.
• Greater take up of apprenticeships by young Muslims should be encouraged and promoted
by stakeholders including Muslim civil society.](https://image.slidesharecdn.com/mcbcensusreport2015-150420165635-conversion-gate01/85/Muslim-Study-by-MCB-61-320.jpg)