![A Multivariate Analysis of Energy Policy Options for
the United States of America using Lindo.
Brian D. Bissett, Member, IEEE
Abstract—The eventual depletion of fossil fuels was first While petroleum contributes a nearly insignificant amount
modeled by geophysicist M. King Hubbert, who predicted using a toward electric power generation in the United States, it
left skewed Gaussian curve in 1956 that U.S. oil production would provides 96% of the energy required for the United States
peak in the year 1970 and decline thereafter. While initially
transportation needs. The remaining 4% is divided evenly
ridiculed, the Hubbert analysis has proven to be remarkably
accurate, with the prediction of peak U.S. oil production off by between natural gas which is used to power some busses in
only one year. Hubbert also predicted using the same model that large metropolitan areas, and electric which is used to power
world oil production would peak in 2000 [1]. The peak of world some rail systems, most notably Amtrak along the entire
oil production is a topic of much debate with some experts northeast corridor [6]. The world currently produces 82.5
predicting peak production has already occurred, while more million barrels a day, of which one fourth is consumed by the
optimistic projections suggesting the peak will not occur until
United States. The United States consumes 20.7 million
2030 or beyond [2]. The inevitability of an eventual decline in the
production of oil is generally accepted at this point in time, but barrels of oil a day, of which only one quarter is produced
the question of how to make up for the loss of energy generated domestically. Of this 20.7 million barrels of oil, 9.3 million
by oil and other non renewable energy sources has yet to be barrels (or 390 million gallons of gasoline) are utilized solely
answered. With the GDP heavily influenced by the price of crude for motor vehicle use. When diesel and all other motor fuels
oil [3], the future economic health of the United States is in peril are allocated for, 70% of the oil consumed in the United States
without a sound energy policy. In addition, the effect of high
energy prices on the economy is underreported by the U.S.
is utilized for transportation needs. The shortfall in US oil
Federal Reserve as both energy and food prices are not included production is made up for by imported oil, of which the OPEC
in the core inflation index [4]. This paper will present one cartel provides nearly a third of US energy needs. The single
potential method of modeling how to allocate energy generation country which supplies the largest chunk of US oil imports is
methods for the future energy requirements of the United States. Canada, which provides a total 4.25 million barrels of crude
oil and petroleum products per day. Saudi Arabia is the top
Index Terms - energy, “energy policy”, “fossil fuel”,
producer of crude oil generating 10.6 million barrels of oil per
electricity, “electric power generation”, “electric power plant”,
power, “power generation”, “power generation efficiency”, coal, day. Even if Saudi Arabia were to supply the output of all its
oil, “natural gas”, petroleum, “nuclear power”, geothermal, oil fields to the United States, it could supply only one half of
hydroelectric, “tidal power”, solar, “solar power”, “wind power”. the oil the United States requires [7].
I. INTRODUCTION Percentage of Non-Renewable Resources Located in the United States
E lectric power generation in the United States comes
principally from three sources: coal, natural gas, and
nuclear power plants, none of which are renewable power
50
45
49.20
40
sources, yet produce nearly 90% of the electricity consumed in 35
the United States. The largest renewable power generation 30
source in the United States is hydroelectric power at (7.1%), Percentage 25
US/Global %
20
but the contribution of renewable power sources toward
15
current national needs is minimal and in fact under 10 percent. 10
8.14
3.36
(See Figure 1) 5
1.69
0
Petroleum Natural Gas Coal Nuclear
Resource
United States Electrical Power Generation Sources
Figure 2: United States “Ownership” of Non-Renewable Resources [8].
Other
At the present time the United States is clearly dependant on
Hydroelectric
7.1% 3.5%
four nonrenewable sources of energy to supply nearly all of its
Nuclear Coal
19.6% Coal Oil energy needs. Coal, natural gas, nuclear power, and petroleum
49.5%
Natural Gas
Nuclear
provide the energy required for the country to function on a
Hydroelectric
Other
daily basis. Figure 2 shows the world resource allocation of
Natural Gas
19.2%
Oil these nonrenewable resources relative to the United States. In
1.1%
descending order, the United States has the greatest supply of
coal, nuclear fuel (U3O8 – “yellow cake”), natural gas, and
petroleum. A comparison of Figure 1 with Figure 2 shows that
Figure 1: Electrical Power Generation in the United States [5]. US energy requirements are not met in proportion to access](https://image.slidesharecdn.com/multivariateanalysisofenergypolicyoptions-090712120938-phpapp01/75/Multivariate-Analysis-Of-Energy-Policy-Options-Using-Lindo-1-2048.jpg)
![and control of resources. This subjects the United States CO2 emissions into deep underground reservoirs for long-term
economy to the whims of geopolitical instability, as the control storage. Pumping CO2 into oil reservoirs is an established
of energy prices and energy access are not entirely within its method to enhance oil recovery over the conventional method
means. The most precarious situation is that the United States of pumping water into an oil reservoir. The Weyburn
owns less than 2% of the world’s supply of the resource that Enhanced Oil Recovery Project in North Dakota and Canada
provides 96% of the energy for its transportation needs has used CO2 from an area coal-gasification plant to enhance
(petroleum). The situation is not much better for natural gas oil extraction since 2000. Long-term sequestration methods
where the United States owns 3.36% of a resource that may evolve from these methods but according to a report from
provides nearly a fifth of its electrical power. It is hardly the Massachusetts Institute of Technology, CCS is not yet
surprising if there is the slightest disruption in natural gas guaranteed to work on the scale necessary to contain 90% of
production that the price skyrockets. the emissions from a major power plant, a Department of
Table 1 lists the four most prevalent nonrenewable energy Energy (DOE) goal [15].
resources along with the known reserves in both the United Integrated gasification combined cycle (IGCC) provides
States and the entire world. improved energy recovery from coal as opposed to burning the
coal to drive an electricity-generating turbine with pressurized
Global Reserves United States Reserves
Resource
Known Units Known Units
steam. By heating the coal under an oxygen and water
Petroleum
Natural Gas
1,237.64 Billion Barrels
6,288.57 Trillion Cubic Feet
20.97 Billion Barrels
211.09 Trillion Cubic Feet
atmosphere (no nitrogen), the gasification process generates
Coal 998.00 Billion short ton 491.00 Billion short ton selected combinations of product, including heat energy,
Nuclear 5,469,000.00 U3O8 tons 445,000.00 U3O8 tons
carbon monoxide, hydrogen, methane, and carbon dioxide.
Table 1: Known Reserve Levels for Nonrenewable Resources. [8] The carbon monoxide or methane can serve as a chemical
feedstock, or burn completely to carbon dioxide. Similarly, an
II. NONRENEWABLE ENERGY SOURCES IGCC plant can collect hydrogen as an added fuel product or
power an additional gas-driven generator to produce
A. Coal electricity. Remaining solids can find use in a conventional
Coal has the distinction of being the most abundant coal-burning furnace as a low-grade fuel. The leftover mineral
nonrenewable energy source in the United States. As of components are often recovered as useful industrial materials,
October 22, 2007, there are 1,493 coal fired electrical power an example being fly ash which is recovered from coal-burning
plants operating in the United States [9]. Coal is frowned upon plants for use in concrete [16].
in many circles as an energy source because of the high In addition to (CO2), oxides of nitrogen (NOx), and sulfur
amounts of CO2 and pollutants coal burning energy plants (SOx), are pollutants emitted in large quantities by coal fired
release into the atmosphere. Each year coal burning plants power plants. Air quality legislation and regulations under the
release 9.3 billion metric tons of CO2 into the atmosphere [10]. Environmental Protection Agency’s Acid Rain Program focus
Coal as a resource however is simply too viable of a on reducing the emissions of oxides of nitrogen (NOx) and
commodity to ignore. The United States has enough coal to sulfur (SOx).
supply its energy needs for an estimated 1,500 years [11]. The
coal seam running under Pittsburgh, Pennsylvania alone could
provide 250 years worth of power to the United States [12].
In recent years, a number of new technologies have emerged
to reduce the levels of emissions generated by burning coal.
Clean coal is a marketing term often utilized to describe a
group of technologies and industry practices that significantly
increase coal-derived energy generation efficiency (including
coal gasification), while reducing coal power plant emissions.
Due to dramatic advances in pollution control technology,
emissions from coal plants, with the exception of CO2, can be
Table 2: NOx Reduction Technologies [17]
reduced to about the same level as natural-gas electricity
generation. These pollution control measures however also
The Clean Coal Technology Demonstration Program is a
adversely impact the economics of coal power generation [13].
partnership of the DOE and US industry that has the goal of
The two most widely utilized pollution control technologies
successfully demonstrating advanced coal based pollutant
for coal burning power plants are carbon capture and
reduction technologies. Its intent is to move the most
sequestration (CCS), and Integrated gasification combined
promising technologies into the domestic and international
cycle (IGCC). These technologies do not come cheaply, each
marketplace.
adds about 50% to the cost of electricity generated by a coal
The Clean Coal Program demonstrations were developed
power plant [14].
with the intention of retrofitting existing coal power plants to
Coal power plants equipped with CCS pressurize and pump
reduce NOx and SOx emissions independently, and for
Page 2 of 24](https://image.slidesharecdn.com/multivariateanalysisofenergypolicyoptions-090712120938-phpapp01/75/Multivariate-Analysis-Of-Energy-Policy-Options-Using-Lindo-2-2048.jpg)
![technologies that achieve combined SOx and NOx emission Burner (LNB)/SNCR wet scrubber and the fluidized bed
reductions. Tables 2 through 4 identify the technology or absorber. The incomplete status of the latter projects is the
process and present data pertinent to the environmental and reason that capital costs are not available [20].
economic performance of each.
Table 2 identifies NOx reduction technologies and presents
environmental and economic data pertinent to each. Two
projects presented in Table 2, advanced over fire air 1 generis
NOx control intelligent system (GNOCIS) and reburning
micronized coal, have not been completed and, therefore, do
not have final data available. Additionally, levelized busbar
costs and retrofit market estimates were not available for the
advanced tangentially fired boiler technology.
The Clean Air Act Amendments of 1990 (CAAA) and
proposed regulations require significant reductions of NOx
emissions from electric utility plants. The Ozone Transport
Table 4: Dual NOx & SOx Reduction Technologies [21]
Assessment Group recommends a NOx emission reduction of
85 percent compared to the 1990 rate in the designated fine
One potential pitfall to increasing the use of coal is that one
grid areas (areas of most serious air pollution). This translates
of the most widely utilized pollution control technologies for
to an emission limit of 0.15 pounds of NOx per million British
coal burning power plants, carbon capture and sequestration
Thermal Units of coal burned. [18]
(CCS), has yet to have any long term studies done. It remains
It is apparent from Table 2 that no single technology can
to be seen if carbon capture and sequestration can be done
achieve the required percentage reductions, with the possible
safely at a large scale for a long period time.
exception of selective catalytic reduction (SCR). This may
The scale of sequestration required for large coal power
mean that combinations of two technologies will be required to
plants could cause unknown changes in soil chemistry. The
achieve emission standards, thereby increasing the cost of
possibility also exists that stored carbon dioxide could leak,
compliance. Because SCR treats post-combustion stack gases,
causing other unforeseen problems.
it can be retrofitted on any coal-fired boiler. Its market
The U.S. Department of Energy's current Clean Coal
potential includes all coal-fired boilers.
program does not have sufficient funds to meet to commit to
large-scale projects to store carbon dioxide underground at
coal-fired power plants as suggested by the Massachusetts
Institute of Technology[22].
While utilizing more coal as an energy source represents a
challenge in terms of minimizing the harmful effects upon the
environment, the challenges to do so do not seem
insurmountable given the variety of existing pollution
controlling options available. Given the sheer volume of
domestically available coal, it would be irresponsible to not
investigate the potential exploitation of this proven energy
source for future energy needs.
Table 3: SOx Reduction Technologies [19]
B. Natural Gas
SOx constitutes another pollutant emitted in large quantities Natural gas was at one time heralded as the best solution to
by coal fired boilers. Together with NOx, SOx creates acid rain the energy needs of the United States. Electric generation by
deposition, causing acidification of lakes and rivers leading to natural gas has many advantages over oil, nuclear power, and
fish kills. It also results in the killing of trees, particularly coal. Natural gas has essentially zero waste disposal costs.
above 2,000-foot elevations. Emission standards are also being Unlike coal and nuclear plants, the cost of electricity from
tightened for SOx, and it is assumed that many power plants natural gas plants is not highly sensitive to interest rates [23].
will need to retrofit new technology in order to achieve the Non-fuel operation and maintenance expenses strongly favor
newly legislated standards. Table 3 displays the SOx reduction natural gas combined cycle plants as they require smaller staffs
technologies funded by the Clean Coal Program together with to operate, have less boiler tube wastage, and lower
pertinent data for each. Each of the projects listed in Table 3 component replacement costs when compared to coal, oil, and
has been completed. nuclear power plants [24]. Natural gas plants are the cleanest
Combined SOx and NOx Reduction Technologies (Table 4) commercial fossil fuel fired powerplants, emitting essentially
lists the technologies in the Clean Coal Program that can zero SO2 and particulates, and the lowest levels of NOX and
achieve reductions in both SOx and NOx. All the projects listed CO2 [25]. In addition, natural gas plants emit half of the CO2
in Table 4 are completed, with the exception of the Low NOx
Page 3 of 24](https://image.slidesharecdn.com/multivariateanalysisofenergypolicyoptions-090712120938-phpapp01/75/Multivariate-Analysis-Of-Energy-Policy-Options-Using-Lindo-3-2048.jpg)
![of coal-gasification plants [26]. Natural gas plants also have repealed the sections of the Powerplant and Industrial Fuel
short lead times and can be constructed quickly, allowing gas Use Act that restricted the use of natural gas by industrial users
fired power plants to more closely track electric demand and electric utilities [34].
growth and preventing electricity rate shock [27]. Natural gas The current shortage of natural gas is due to more ominous
plants are economic at a much smaller size (in MW) than their reasons. The United States is a large producer of natural gas,
coal, nuclear, and oil brethren [28]. second only to Russia, and 85 percent of the gas used here
In spite of all its advantages, natural gas has one hurdle it is comes from domestic wells [35]. Canada, with large reserves
unlikely to overcome – dwindling supplies in the United States and geographic proximity, provides more than 90 percent of
and Canada. Shortages of natural gas are now occurring in the the natural gas exported to the United States, satisfying the
United States and have occurred in the past during the 1970s. bulk of the United States’ 15 percent shortfall. Canada
In 1956, Hubbert used an estimated ultimate recovery however has continued to produce natural gas faster than it
(EUR) of 850 trillion cubic feet (an amount postulated by replenishes its reserves. Canada’s production/reserves ratio
geologist Wallace Pratt) to predict a US production peak of (the number of years of proven reserves remaining at existing
about 14 trillion cubic feet per year to occur in approximately production levels) has declined from 35 years in 1985 to 9
1970 [29]. years in 2006 [36]. Canadian imports to the United States are
US natural gas production reached a peak in 1973 at about now slowing, as demand for natural gas grows at home.
24.1 trillion cubic feet, and declined through 1976. New
discoveries in the Gulf of Mexico, development of
"unconventional reserves", and new gas discoveries in
Prudhoe Bay, Alaska proved Pratt's EUR estimate to be too
low, as US gas production rose again [30].
Hubbert revised his peak gas estimate in 1971 based on
updated reserve information. He revised his estimated ultimate
recovery upward to 1,075 trillion cubic feet for the lower 48
states only, and predicted: "For natural gas, the peak of
production will probably be reached between 1975 and 1980"
[31]. Gas production for the lower 48 states in fact did peak in
1979, and declined for several years, but then began rising
again, principally from new gas discoveries.
The direct cause of the natural gas shortages in the 1970s
was price regulation by the Federal Power Commission. By Figure 3: Canada's Ability to Supply US Natural Gas Shortfalls is
maintaining an artificially low price, the FPC made natural gas Diminishing [37].
the choice fuel (for those consumers who could obtain it), so
its demand grew rapidly. At the same time, the low prices For many years the price of natural gas oscillated within a
depressed supplies. This occurred for two reasons. First, the narrow corridor, rising and falling slightly with respect to
incentive was removed for the exploration and discovery of supply and demand. From roughly 1984 to 1993, this price
new natural gas reserves, and as a result, total U.S reserves of corridor was upper bounded at about $7.00 per thousand cubic
gas fell by about a third between 1967 and 1976. This feet, and lower bounded at about $5.00 per thousand cubic feet
dwindling reserve base made it impossible for producers to (Figure 4) [38]. From about 1994 to the present day, natural
satisfy the demand for new long-term contracts. Second, low gas prices have been rising in an exponential fashion. At the
prices removed the incentive to produce gas out of existing current utilization rates, natural gas supplies are being utilized
higher cost reserves, so production from these sources fell faster than they are being replenished by exploration. The
irrespective to their level of reserves. This situation of rapid consequence of much tighter supplies of natural gas makes it
growth in demand combined with dwindling supplies led to a much more difficult for the market to supply large quantities of
shortage of natural gas during the 1970s [32]. excess natural gas needed during times of peak consumption,
In response to the 1973 oil crisis and natural gas such as excessively cold winters. This accounts for the greater
curtailments of the mid-1970s, the U.S. Congress restricted peak to peak variation in the oscillations of the price of natural
construction of power plants using oil or natural gas with the gas. In today’s current market, price variations of $5.00 per
Fuel Use Act of 1978. The Fuel Use Act of 1978 also thousand cubic feet are not uncommon whereas decade ago
encouraged the use of coal, nuclear energy, and other they were half that amount. If this trend continues, the price of
alternative fuels, while restricting the industrial use of oil and natural gas will reach ≈ $93.00 per thousand cubic feet in 2025
natural gas in large boilers. In the early 1980s, the demand for and ≈ $155 per thousand cubic feet in 2030. Unless vast new
natural gas declined significantly, resulting in price declines reserves of natural gas are discovered in the United States and
[33]. Canada, the percentage of natural gas fired power plants in the
Enactment of the Natural Gas Utilization Act in 1987 United States should be frozen if not reduced. At current
consumption rates, Canada will be unable to make up for the
Page 4 of 24](https://image.slidesharecdn.com/multivariateanalysisofenergypolicyoptions-090712120938-phpapp01/75/Multivariate-Analysis-Of-Energy-Policy-Options-Using-Lindo-4-2048.jpg)
![shortfall in United States production by the year 2015.
Because no long term repository currently exists for HLW,
currently existing waste from operating nuclear power plants is
being stored at the various reactor sites where it was generated.
This was not the planners’ intent. When most US reactors were
built, it was assumed that spent fuel would be stored only
briefly on site, and would then would be sent to a central
facility for reprocessing (removal of fission products and
recovery of fissionable elements for reuse). For economic
reasons and because of concerns about control of weapons-
grade materials, reprocessing has not become an option in the
United States, and electric utilities have found ways to extend
their on-site storage capacity [44].
The United States has approximately 56,000 tons of high
Figure 4: Natural Gas Prices have begun to Grow Exponentially [39]. level nuclear waste stored in cooling pools and dry casks at
over 100 sites in 39 states [45]. If no new nuclear plants are
C. Nuclear built, the total spent fuel accumulation is projected to be about
As of December 31, 2007, there are 104 commercial nuclear 85 thousand metric tons by 2030 [46]. This exceeds the
power plants licensed by the U.S. Nuclear Regulatory capacity of the Yucca Mountain Repository by 15,000 tons.
Commission (NRC) to operate in the United States. Of these The Yucca Mountain repository is already over a decade
104 reactors, 69 are categorized a pressurized water reactors behind schedule (its opening has been delayed twice,) and
(PWRs) totaling 65,100 net megawatts (electric) and 35 units probably will not open until about 2020 [47]. Construction of
are boiling water reactors (BWR) totaling 32,300 net the Yucca Mountain facility is challenging because the deep
megawatts (electric) [40]. Sixteen utilities have expressed geological repository must be designed to meet exacting
intentions to build 25 new nuclear power plants in the United performance requirements set forth in regulations written by
States while Senator John McCain is calling for the the Environmental Protection Agency and the Nuclear
construction of 45 new nuclear reactors by 2030 [41]. Nuclear Regulatory Commission. Specifically, the repository must:
power is very much in vogue because its methods of power isolate the high-level waste (HLW) from the biosphere for
generation do not generate greenhouse gas emissions. 10,000 years [48], have multiple barriers with waste packages
While nuclear power lacks some of the pollution problems that can provide “substantially complete” containment of
of other methods of nonrenewable electricity generation, it has wastes for 300 to 1,000 years [49], have an engineered barrier
some problems that are uniquely its own. Nuclear reactors system which will prevent the rate of release from the waste
produce high level waste (HLW), which contains fission packages from exceeding one part in 100,000 per year [50],
products and transuranic elements generated in the reactor constrain groundwater movement by virtue of its geology from
core. It is highly radioactive, and often thermally hot. Twelve the repository disturbed zone to the environment for at least
of the most common radioactive isotopes commonly found in 1,000 years [51], have integrity such that its system must be
spent nuclear fuel (HLW) are graphed verses their half life in internal, i.e., it must work by virtue of its own properties and
Figure 5. There is not a single facility in the world built for not rely on human monitoring or intervention, or even the
safe long term storage of high level nuclear waste. The United existence of government [52].
States is the most advanced in this regard, and is in the process Yucca Mountain’s capacity has been artificially constrained
of building a waste repository at Yucca Mountain, Nevada for to 70,000 tons of waste by statute. This was decided nearly
this purpose [42]. three decades ago when most believed that nuclear power had
Biologically Significant Long-Lived Radioisotopes in Commercial Spent little future in the US. The actual capacity of Yucca Mountain
Nuclear Fuel
is in reality much larger. Numerous bills have been offered in
100,000,000.0000
10,000,000.0000
recent years to repeal the artificial 70,000 ton capacity
1,000,000.0000 restraint and replace it with a more scientifically calculated cap
100,000.0000
[53]. The Department of Energy believes that the Yucca
Half Life (Years)
10,000.0000
Log Scale
1,000.0000
100.0000
Half-life repository could safely hold 120,000 tons of waste [54].
10.0000 Even if Yucca Mountain could expand its capacity to hold
1.0000
0.1000
120,000 tons of waste, it would not be able to hold all of
0.0100 America’s spent fuel if the U.S. adds nuclear capacity.
0.0010
-2
41
-1
35
-1
37
-2
42
-1
29
-2
37
-2
39
-2
38
-2
39
-2
41 -9
0
-9
9 According to one analysis, assuming a 1.8 percent growth in
m m m m ne m m um um um t iu
m um
iu di iu iu it i
er
ic
iu
C
es
iu
C
es
iu
C
ur Io
pt
un
pt
un
ut
o ni
ut
o ni
ut
o ni
tr on c hn America’s nuclear capacity after 2010, the U.S. would fill a
Am Ne Ne Pl Pl Pl
S Te
Isotope 120,000-ton Yucca by 2030. At this growth rate, the U.S.
Figure 5: Life of Radioisotopes in Commercial Spent Nuclear Fuel [43].
would need nine Yucca Mountains by the end of the 21st
Page 5 of 24](https://image.slidesharecdn.com/multivariateanalysisofenergypolicyoptions-090712120938-phpapp01/75/Multivariate-Analysis-Of-Energy-Policy-Options-Using-Lindo-5-2048.jpg)
![century [55]. uncertain how much oil is left in Saudi Arabia’s reserves,
If the United States wishes to expand its energy capacity because the kingdom will not allow an independent auditing of
using nuclear power, the numbers clearly show that the United its reserves [60]. This should be of great concern because
States will need to embrace reprocessing of high level nuclear Saudi Arabia is the world’s top producer of crude oil.
waste in some fashion. The current policy of disposing of all There are two schools of thought with respect to the peak of
spent fuel permanently is a monumental waste of resources. oil supplies. Some continue to believe in the validity of
To create power, reactor fuel must contain between 3 to 5 geophysicist M. King Hubbert’s original prediction that oil
percent enriched fissionable uranium (U-235). Once the production has already peaked and did so in about the year
enriched fuel falls below that level, the fuel must be replaced. 2000 [61]. Others, like Ben Witten of Stanford University,
argue that Hubbert’s prediction was flawed because it failed to
Yet this “spent” fuel generally retains about 95 percent of its
model the asymmetric nature of the oil production over its life
original content, and that uranium, along with other byproducts
cycle, and the model does not account for the possibility of
in the spent fuel, can be recovered and recycled [56].
multiple production peaks. Witten argues that when Hubbert’s
Many technologies exist to recover and recycle different original model is improved, a more realistic figure for peak oil
parts of the spent fuel. The French have been successful in production is 2018 [62].
commercializing a process. They remove the uranium and The interesting thing about this debate is that it is somewhat
plutonium and fabricate new fuel. Using this method, irrelevant. The difference between the two opinions as to
America’s 56,000 tons of spent fuel contains roughly enough when the peak of world petroleum supplies occurs are only
fuel to power every U.S. household for 12 years. Some eighteen years apart. This does not leave a very large window
recycling technologies show even greater promise, and would of opportunity to find a suitable replacement resource for
leave virtually no high level waste at all, which would lead to transportation and home heating needs. Unless vast new
the recovery of an almost endless source of fuel. However, reserves of crude oil are discovered, petroleum fired power
none of these processes has been successfully commercialized plants should not be part of the United States future energy
[57]. generation matrix.
Most of the reprocessing technologies, including the process
used in France, were developed in the United States. They III. RENEWABLE ENERGY SOURCES
were abandoned during the Carter administration because of
The need to switch to non-fossil fuels is apparent for two
concerns that a byproduct of reprocessing, plutonium, could be
reasons: eventually the economically recoverable fossil fuel
stolen by a terrorist group and used to make a nuclear bomb. It
resource base will be depleted, and the conversion of
is difficult to imagine that any form of chemical reprocessing additional large quantities of naturally sequested carbon to
would be more proliferation resistant in the short term than not atmospheric carbon dioxide could result in an unprecedented
reprocessing at all, and leaving the plutonium mixed in with rapid global climate change.
the highly radioactive fission products in the solid fuel matrix. Renewable energy power plants all share some common
Proponents of reprocessing however, argue that burying traits. They require a great deal of starting capital to build.
plutonium containing spent fuel creates an unacceptable long- The large up front costs of renewable energy power plants are
term hazard, since the half-life of the most important offset however by low variable costs and no fuel costs. In a
plutonium isotope, 239Pu, is 24,000 years [58]. paradigm where fuel is essentially free, efficiency
If nuclear power is to play a greater role in the future energy improvements are far less critical factor for renewable energy
needs of the United States, it will be imperative to power plants.
commercially develop some form of HLW reprocessing. This
is probably why the Department of Energy has proposed that
geological storage of spent fuel be kept open for possible
retrieval for at least 100 years after emplacement begins [59].
D. Oil
The Fuel Use Act of 1978 restricted the construction of oil
fired industrial power plants using large boilers. In addition to
the legal restrictions in place for new applications of oil fired
electric power plants, high demand for oil in the
transportation sector and for household heating applications
has limited the continued utilization and replacement of
existing oil fired electric power plants. Today oil fired power
plants provide only about one percent of the electric power Figure 6: Geothermal Resources in Continental United States [63].
used in the United States. A. Geothermal
In addition to the above obstacles, oil has another hurdle it Although estimates of available geothermal resources are
cannot overcome. Petroleum is becoming scarce not just in the
uncertain until exploratory work is done, the Northwest Power
United States, but throughout the entire world. It is even
Planning Council has identified eleven specific areas in the
Page 6 of 24](https://image.slidesharecdn.com/multivariateanalysisofenergypolicyoptions-090712120938-phpapp01/75/Multivariate-Analysis-Of-Energy-Policy-Options-Using-Lindo-6-2048.jpg)
![western United States where it expects there are about 2,000 Lardarello, Italy, in 1904 [67].
megawatts of developable geothermal resources. Geothermal Current exploration activities in the U.S. typically concern
areas in the western United States are usually found where 10 to 50 MW projects. Recent interviews with geothermal
there has been relatively recent volcanic activity. Alaska also developers provided exploration cost estimates averaging
has approximately 30 low to moderate temperature geothermal $150/kW [68]. Most lending institutions require 25% of the
systems located in the interior of Alaska [64]. total project capacity to be confirmed prior to lending money
Most geothermal electrical plants use either flash or binary to a geothermal developer [69]. The confirmation phase of
technologies. Generally, flash technologies are utilized when a geothermal development consists of drilling additional
geothermal resource has temperatures of 350°F and higher, production wells and testing their flow rates until
and binary technologies are utilized when temperatures are approximately 25% of the resource capacity needed by the
below 350°F. In both technologies, the geothermal fluids are project is confirmed. Production rates of 1000 gpm are
returned to the underground reservoirs and naturally reheated typically required for the geothermal power plants [70].
for reuse [65]. Confirmation cost estimates for commercially viable
In a flash steam process, water from underground wells is projects average $150/kW [71]. In order to secure steam
separated (flashed) into steam and water. The water is directly delivery, developers usually drill over 105% of the brine
returned to the geothermal reservoir by injection wells, or requirements for the power plant, and have at least one spare
utilized for other processes such as agriculture prior to productive well available to compensate for any steam supply
reinjection. The steam is utilized to drive a turbine and problem. In some cases, financial institutions may require
generate electricity. Any gases in the steam are removed and development of 125% of required flow to the plant. Interviews
treated to remove any dissolved pollutants if necessary. The of geothermal developers revealed that total drilling costs
steam is then cooled to liquid form, and re-injected into the (confirmation + site development drilling) range from
geothermal reservoir. For very high temperature resources, the $600/kW to over $1200/kW, with average drilling costs close
water can be controlled to flash more than once to recover to $1000/kW [72].
even more energy from the same resource. The temperature of the resource is an essential parameter
influencing the cost of the power plant equipment. Each power
plant is designed to optimize the use of the heat supplied by
the geothermal fluid. The size and thus cost of various
components is determined by the resource's temperature. As
the temperature of the resource goes up, the efficiency of the
power system increases, and the specific cost of equipment
decreases (more energy can be produced with similar
equipment). The temperature of the resource will also
determine the technology choice, steam or binary.
High temperature resources utilize steam power systems,
which are simpler and less costly. The cost of steam plant
equipment rises quickly however as brine temperature
Figure 7: Common Geothermal Power Plant System Configurations [66]. decreases, as a result of efficiency losses. Binary systems
become competitive at temperatures close to 350°F. Despite a
A binary power plant is utilized for moderate-temperature more complex design, binary power systems are generally less
resources. The hot water from a geothermal source is used to expensive than steam systems for temperatures below 350°F.
heat a secondary working fluid with a low boiling point, such The specific cost of binary systems also rises as temperature
as ammonia or isobutane, in a closed-loop system. The drops.
working fluid is vaporized in a heat exchanger and is then used
to drive a turbine generator. A cooling system is used to
condense the vaporized working fluid back into liquid form to
repeat the process. The hot water extracted from the
geothermal resource is then injected back into the reservoir.
The hot water and the working fluid are kept in separate closed
loop systems, so that environmental issues are minimal.
Dry steam is another less commonly utilized method of
geothermal power generation. Dry steam power plants use
very hot steam (>455 °F) and little water from the geothermal
reservoir. The steam goes directly through a pipe to a turbine Figure 8: Geothermal Power Plant Costs vs. Well Temperature [73].
to spin a generator that produces electricity. This type of
geothermal power plant is the oldest, first being used at The chemistry of the brine is another essential parameter
Page 7 of 24](https://image.slidesharecdn.com/multivariateanalysisofenergypolicyoptions-090712120938-phpapp01/75/Multivariate-Analysis-Of-Energy-Policy-Options-Using-Lindo-7-2048.jpg)
![that may significantly affect the cost of the power system. The nature, energy content, water content, and permeability of the
four major chemical characteristics that are of concern are: the reservoir. Shallow production wells run the serious risk of
brine scaling potential, corrosiveness, non-condensable gas rapid cooling without proper pressure support, which is
(NCG), and hydrogen sulfide (H2S) content. Each of these obtained by utilizing a suitable barrier formation or separation
characteristics may require additional equipment that can deal distance between cooler and hotter waters in shallow wells
with specific problems or may influence the size of some [80].
power plant components. Chemicals can cause scaling, and it “Make-up drilling” is utilized to compensate for the natural
is necessary in some geothermal installations to inject a productivity decline of the original geothermal wells by
surfactant into the hot water supply [74]. drilling additional production wells. An Interview of
A TS Cycle Diagram for a typical geothermal power plant is geothermal developers revealed that annual make-up drilling
shown in Figure 9. On the preheater/evaporator side of the costs approximately correspond to 5% of the initial drilling
ORC system, 530 gpm of 164 °F hot water (point A in Figure costs [81].
9) enters the unit and is cooled to 130 °F (point B), Operation and Maintenance (O&M) costs are not constant
transferring 2.58 MW of thermal energy to the refrigerant. during the lifetime of a geothermal power plant. During the
This energy preheats the 26.8 lbm/s refrigerant mass flow rate first years of operation, O&M costs are expected to be
from 54 °F (state point 4) to 136 °F and subsequently boils the relatively low but will climb progressively as equipment ages
working fluid at this temperature before slightly superheating and requires more maintenance or replacement. Major
it (state point 1). The high-pressure refrigerant vapor is parameters affecting O&M cost are: the plant labor
expanded in the turbine that extracts 270 kW of mechanical requirement, the amount of chemicals and other consumables
power [75]. used during operation, the extent of make-up drilling
requirements, and the cost of the equipment that has to be
replaced throughout the years.
Another important factor that affects the cost of power is the
"capacity factor" (CF) of the power plant. The capacity factor
of a geothermal power plant corresponds to the ratio between
the amount of energy actually delivered to the grid, and the
potential energy that it could have delivered during the period
of time considered. Geothermal plants typically have a CF
around 90% [82], which is higher than most other power
production technologies. This means that geothermal power
plants typically deliver power at full capacity 90% of the time,
while outages (planned and unplanned events) prohibit power
delivery during the remaining time.
Geothermal power plants do not need external fuel to
Figure 9: Typical Temperature-Entropy (TS) diagram for Geothermal
operate. Once the power project is built, most of its power
Power Plants [76].
With a typical staffing requirement of 40 employees, the production costs are known, and extremely few market
operating cost of a 50 MW power plant is $7/MWh [77]. The parameters can modify them. Market prices can only impact
size of the power plant is another important parameter that labor and consumables costs, which are minor components of
affects labor costs. Geothermal power plants are advantageous the cost of geothermal power.
because the number of operators needed to run a geothermal B. Hydroelectric
plant is relatively independent of its size. Therefore, most Hydroelectric power currently provides about 7 percent of
existing power plants ranging from 15 to 100 MW require the electric energy needs of the United States [83]. The
similar crews of 5 to 7 employees (working on 24-hour/7-day mechanical power of falling water is an age-old tool. As early
shifts). Thus, significant economies of scale apply, and smaller as the 1700's, Americans recognized the advantages of
plants have substantially higher labor costs than larger plants. mechanical hydropower and used it extensively for milling and
In 2001, the estimated annual cost of power plant pumping. By the early 1900's, hydroelectric power accounted
maintenance was 5% of the initial capital costs [78]. An initial for more than 40 percent of the United States’ supply of
investment of $1400/kW was considered, and maintenance electricity, and in the West and Pacific Northwest sections of
costs were estimated to average $9/MWh [79]. the country during the same time period hydropower provided
The productivity of geothermal wells declines with use and about 75 percent of all the electricity consumed [84]. While
is a complex phenomenon which is caused by pressure and/or other forms of electric power generation have increased in
temperature drops in the reservoir. The productivity decline development, hydropower generation has remained nearly
rate of a well is directly related to its capacity to supply energy constant, resulting in a decline of its total power contribution
to the power plant. The long-term capacity of the resource to to the power requirements of the United States [85].
deliver energy to the power plant depends on the size, rock A hydropower resource assessment by the Department of
Page 8 of 24](https://image.slidesharecdn.com/multivariateanalysisofenergypolicyoptions-090712120938-phpapp01/75/Multivariate-Analysis-Of-Energy-Policy-Options-Using-Lindo-8-2048.jpg)
![Energy’s Hydropower Program has identified 5,677 sites in the One of the greatest challenges to provide for our national
United States with acceptable undeveloped hydropower energy needs is the ability to not only provide the energy, but
potential. These sites have a modeled undeveloped capacity of to provide it when it is needed. Renewable energy sources
about 30,000 MW. This represents about 40 percent of the often provide excess energy when it is not needed, at which
existing conventional hydropower capacity [86]. point it can either be stored or wasted. Building infrastructure
A variety of restraints exist on the development of this to store excess energy is costly and problematic, so excess
potential energy source, some natural, and some imposed by energy is often unutilized.
society. The primary natural restraint is terrain unsuitable for Using a process termed pump storage, it is possible for
the construction of a dam. Societal restraints include hydroelectric plants to store power much like a battery.
disagreements about who has the legal right to develop a Pumped storage is a method of keeping water in reserve for
resource, or the impact of changes on environmental peak period power demands. When consumer demand for
conditions from development of a resource. Often, an area power is low, such as during the middle of the night, some of
suitable for a hydroelectric power facility would require a dam the excess energy generated by a hydroelectric plant can be
and reservoir to be built, which would result in the destruction utilized to pump water up to the storage pool above the
of preexisting developments. powerplant (typically the dam.) The water is then allowed to
Finding solutions to the problems imposed by natural flow back through the turbine-generators at a time when
restraints often demands extensive engineering efforts. energy demand is high. The reservoir then acts much like a
Sometimes a solution is impossible, or so expensive that the battery, storing power in the form of the potential energy of the
entire project becomes impractical. Solution to the societal water when demands are low, and producing more power
issues frequently exceeds the costs of solving the problems during peak periods. In addition, excess energy created from
imposed by nature [87]. Because of these factors, the full other renewable energy sources such as wind can be utilized to
potential of hydropower will probably never be realized. pump more water into the hydroelectric reservoir for storage,
where it can later be released to generate power for use during
peak demand times [92].
A common misconception about hydroelectric power is that
projects must be large like the Grand Coulee Dam in order to
be economically viable. Economically viable hydroelectric
plants have been constructed with water drops of less than 65
feet and generating capacities less than 15,000 kW [93].
Termed low-head dams, the usefulness of such units is tied to
their ability to generate power close to where it is needed,
reducing the amount of power inevitably lost during
transmission.
While larger dams produce more power at lower costs than
low-head dams, the number of suitable sites for the
construction of large dams is limited. In contrast, there are
many existing small dams and drops in elevation along canals
Figure 10: Undeveloped Hydroelectric Power Amounts and Locations in the United States where small generating plants could be
[88]. installed.
Hydroelectric power plants offer some unique advantages
In hydroelectric power generation, two basic types of over other methods of electricity generation. Since
turbines are utilized, but each has many possible variations hydroelectric generators can be started or stopped almost
[89]. Reaction turbines are the type most widely used. A instantly, hydropower is more responsive than most other
reaction turbine is a horizontal or vertical wheel that operates energy sources for meeting peak power demands. In addition,
with the wheel completely submerged, a feature which reduces hydroelectric plants have low failure rates and operating costs.
turbulence. In theory, a reaction turbine works like a rotating The average annual capacity factor of all U.S. hydroelectric
lawn sprinkler where water at a central point is under pressure plants however is only 50%, with larger plants having better
and escapes from the ends of the blades, causing rotation [90]. utilization rates [94]. Hydroelectric plants can be adversely
An impulse turbine is a horizontal or vertical wheel with affected by droughts, as happened during the year 2000 when
buckets or blades which are utilized to cause rotation. The the capacity factor for all Hydroelectric plants fell to 39.6%
wheel uses the kinetic energy of water striking its buckets or due to drought conditions across the country [95].
blades to cause rotation. The wheel is covered by a housing, Hydroelectric plants also pose environmental concerns as the
and the buckets or blades are shaped so they turn the flow of turning blades on the turbines have the potential to harm
water about 170 degrees inside the housing. After turning the marine life.
blades or buckets, the water falls to the bottom of the wheel
housing and flows out [91].
Page 9 of 24](https://image.slidesharecdn.com/multivariateanalysisofenergypolicyoptions-090712120938-phpapp01/75/Multivariate-Analysis-Of-Energy-Policy-Options-Using-Lindo-9-2048.jpg)
![C. Solar (HVDC) power transmission backbone would have to be built
According to Lawrence Berkeley National Laboratory, the [105].
sun bathes the Earth with enough energy in one hour (4.3 x The presence of clouds, which scatter and absorb solar
1020 joules) to provide for all of humanity's energy needs for a energy, is the predominant atmospheric condition that
year, which is estimated at (4.1 x 10²⁰ joules) [96]. In spite of determines the amount of solar energy available for conversion
this fact, solar power is currently only used to generate one to other energy forms at any particular location. Thus, as
tenth of one percent of the electricity utilized in the United Figure 11 illustrates, the annual average daily solar radiation in
States [97]. The reason for this is that in the past solar energy the United States is highest where the atmosphere is very dry.
was much more expensive than energy generated using For example, in the western desert regions of Arizona,
nonrenewable means. This however is about to change. Nevada, and California, the annual average daily direct solar
In the year 2000, the average residential cost of electricity radiation ranges from 8.5 to 9.0 kWh/m2 at some locations.
was 8.2 cents per kW/hr [98]. In 2006, the U.S. Department However, in most locations along the Pacific coastline, where
of Energy announced that Boeing-Spectrolab with DOE moisture levels in the atmosphere are likely to be higher, it
funding had produced a solar cell which achieved a world- drops to less than 6.0 kWh/m2, even without latitude changes.
record conversion efficiency of 40.7 percent [99]. The
consequence of this breakthrough is that solar power systems
can now be built with a cost of only $3 per watt, producing
electricity at a cost of 8-10 cents per kilowatt-hour, making
solar electricity cost competitive with energy produced from
nonrenewable sources [100].
As this paper was being written, the largest solar
photovoltaic system ever to be built in North America was
under construction at Nellis Air Force Base. When complete,
the plant will provide 25 percent of the power used at Nellis
Air Force Base, and will occupying 140 acres of land leased
from the Air Force at the western edge of the base. The plant
will utilize an advanced tracking system which will follow the
sun, enabling the solar panels to capture up to 30 percent
more energy than an equivalent ground-mounted fixed-tilt
system [101]. Solar power, which produces energy at the
source of consumption, alleviates stress and vulnerability on
Figure 11: Solar Resources of the United States in kWh/m2/day[106].
the nation’s power grid. It also ensures continued power to
Nellis Air Force Base should transmission facilities or A great advantage of solar power is that in most parts of the
generating stations fail due to terrorism, accidents, or natural United States there is a concordance between when peak
disasters. electricity demand occurs and when solar electricity generation
The United States has the best solar resources of any is near optimal efficiency (9 AM – 6 PM). Currently this
developed country in the world. Proportionally, U.S. solar demand load is almost exclusively served by natural gas or
energy resources exceed those of fossil, nuclear or other other fossil fuels that can be easily cycled on and off to meet
renewable energy resources [102]. Despite this tremendous changing demand conditions [107]. Given the high price of
advantage, the U.S. has failed to capture and harness this free natural gas to key industrial sectors and consumers, the United
and readily available energy. Germany, by comparison, has States would be ill advised to neglect its abundant solar
solar resources no better than those of Alaska, but has installed resources.
seven times as much solar energy than the entire United States
[103].
It has been estimated that a desert area in the southwestern
United States that measures 161 km on a side (0.3% of the
land area of the United States) could theoretically meet the
electricity needs of the entire country if the solar radiation in
that area could be converted to electricity with 10% efficiency
(Sandia National Laboratories 2001) [104]. The only
drawback to such an idea is that the existing system of
alternating-current (AC) power lines is not robust enough to
carry power from the southwest to consumers throughout
North America, as it would lose too much energy over long
distances. To be viable, a new high-voltage, direct-current Figure 12: Utility Load and PV Output versus Time of Day [108].
Page 10 of 24](https://image.slidesharecdn.com/multivariateanalysisofenergypolicyoptions-090712120938-phpapp01/75/Multivariate-Analysis-Of-Energy-Policy-Options-Using-Lindo-10-2048.jpg)
![using electrolyzers available in 2004, electricity prices would
One of the big arguments against solar power is that it have to be less than $0.01/kWh [111].
generates less electricity when skies are cloudy, and none after What is most exciting, is that if both solar and wind sources
the sun has set. For solar power to be utilized in a manner are utilized, there is sufficient potential to generate enough
other than for supplemental purposes during peak demand hydrogen fuel to provide for the transportation needs of the
times, excess power produced during the daytime will need to entire country. In 2000 the gasoline consumption of the
be stored for use during dark hours. Most energy storage United States as a whole was 128 billion gallons of gasoline.
systems such as batteries are expensive or inefficient. To date The potential for hydrogen production from photovoltaic (PV)
there are three viable technologies that allow storage of solar and wind for the entire country is 1,110 billion kilograms of
power for utilization during times when generation is hydrogen. As a kilogram of hydrogen is roughly equivalent to
impossible due to darkness. a gallon of gasoline in energy content, the ability to generate
Compressed air energy storage has emerged as a successful 8.6 times the fuel needed by the United States can be met
means of storing solar energy for later use. Electricity from using hydrogen produced from PV and wind sources [112].
photovoltaic plants compresses air and pumps it into vacant The state with the highest potential production of hydrogen
underground caverns, abandoned mines, aquifers, and depleted from PV and wind sources is Texas, with 106,000 million
natural gas wells. The pressurized air is released on demand to kilograms of hydrogen. The state with the lowest potential
turn a turbine that generates electricity, which can be production of hydrogen from PV and wind is Rhode Island,
supplemented by burning small amounts of natural gas if with 213 million kilograms of hydrogen [113].
necessary. Compressed air energy storage plants have been
D. Tidal
operating reliably in Huntorf, Germany, since 1978, and in
McIntosh, Ala., since 1991. Studies by the Electric Power Tidal energy is one of the oldest forms of energy used by
Research Institute in Palo Alto, California, indicate that the humans. Tide mills on the Spanish, French and British coasts,
cost of compressed-air energy storage today is about half that date back to 787 A.D [114]. Tide mills consisted of a storage
of lead-acid batteries. The research indicates that these pond, filled by the incoming (flood) tide through a sluice and
facilities would add three to four cents per kWh to emptied during the outgoing (ebb) tide through a water wheel.
photovoltaic generation [109]. The tides turned waterwheels, producing mechanical power to
Another technology that has the ability to store solar energy mill grain.
is known as concentrated solar power. In this design, long Despite its historical use for other purposes, the use of Tidal
metallic mirrors focus sunlight onto a pipe filled with fluid, Energy to produce electricity is still in its infancy, and
heating the fluid as a huge magnifying glass would. The hot techniques for building and deploying turbines are currently
fluid runs through a heat exchanger, producing steam that turns being shaped [115].
a turbine. Traditional tidal electricity generation involves the
To store this energy, the pipes can run into a large, insulated construction of a dam across an estuary to block the incoming
tank filled with molten salt, which retains heat efficiently. Heat and outgoing tide. The dam includes a sluice that is opened to
can then be extracted at night, creating steam. The molten salt allow the tide to flow into the estuary, and once filled the
does slowly cool however, so the energy stored must be tapped sluice is closed. As the sea level drops when the tide goes out,
within 24 hours. Nine concentrated solar power plants with a the captured elevated water in the dam is utilized to drive
total capacity of 354 MW have been generating electricity turbines to generate electricity using traditional hydropower
reliably for years in the United States. A new 64 MW plant in technology. Tidal energy can also potentially be exploited by
Nevada came online in March 2007. These plants, however, harnessing the energy from offshore tidal streams. Known as
do not have heat storage. The first commercial installation to tidal in-stream or hydrokinetics, the process is a far cry from
incorporate heat storage is a 50 MW plant with a capacity of old-style tidal barrages that are more akin to dams and cost
seven hours of molten salt storage, which is currently being much more to build. The best-known plant of that type, built
constructed in Spain. Similar plants are in the design phases on France's La Rance estuary, has been producing power for
around the world [110]. more than 40 years.
The last and most exciting technology is using sunlight Tidal energy offers some significant advantages to other
during the day to produce hydrogen, which can then be stored forms of renewable energy generation. While winds can turn
and utilized as fuel to generate electricity in either fuel cells or calm and clouds can obscure the sun, the immutable tides
turbines at night. Hydrogen is produced via electrolysis by however will turn twice a day no matter what, and can provide
passing electricity through two electrodes in water. The water a steady and predictable source of power. In addition, due to
molecule is split and produces oxygen gas at the anode and water's greater density, tidal power requires fewer turbines to
hydrogen gas at the cathode via the following reaction: H 2O → produce the same amount of electricity as wind [116]. Perhaps
½ O2 + H2. However, when hydrogen is produced in this even more important is that underwater turbines are unlikely to
manner, hydrogen prices are highly dependent on electricity draw opposition from coastal residents about new energy
prices. For example, to produce hydrogen at $2/kilogram, projects spoiling their views.
Tidal energy schemes have some drawbacks as well. Tidal
Page 11 of 24](https://image.slidesharecdn.com/multivariateanalysisofenergypolicyoptions-090712120938-phpapp01/75/Multivariate-Analysis-Of-Energy-Policy-Options-Using-Lindo-11-2048.jpg)
![energy typically has low capacity factors, usually in the range The SeaGen system uses two rotors that are 16 meters in
of 20-35% [117]. Since there are two high and two low tides diameter, and can each produce 600 kilowatts of power. Two
each day, electrical generation from tidal power plants is rotors are used because the depth of the seas limits the size of
characterized by periods of maximum generation every twelve the rotors, forcing tidal systems to in effect grow sideways.
hours, with no electricity generation at the six hour mark in The SeaGen system also has complete control over the
between, resulting in low capacity factors [118]. rotors. They are pitched like the propeller on an aircraft. The
The demand for electricity on an electrical grid varies with rotor can be optimized by changing its angle, which also
the time of day. Due to the fact that the tides typically come in dictates how much force is produced by the blades. The rotors
early in the morning or late in the evening, the supply of can be made to start and stop, and go faster or slower [126].
electricity generated from a tidal power plant will never match This is very important because turbines operate at maximum
the demand placed on a system by consumers, which typically efficiency over a very narrow range of speed [127]. The use of
peaks during the early afternoon [119]. variable speed turbines is also important as it results in a 2.3%
Some tidal power, like its hydroelectric cousin, can be increase in power production than nonvariable turbines
stored for later use by utilizing the turbines to pump extra operating under the same conditions [128]. In order to prevent
water into the basin behind the dam during periods of low damage to the ecosystem, it is important that the speed of the
electricity demand [120]. rotors not exceed 14 revolutions per minute, a speed that is too
Tidal dams can be designed to generate electricity on the slow for marine life to run into the blades or to alter tides
ebb side, the flood side, or both. Tidal deltas vary over a wide [129].
range, typically from 4.5m to 12.4m. A tidal range of at least Passamaquoddy Bay and the Bay of Fundy between the U.S.
7.0m however is required for economical operation of a and Canada are prime proving grounds for tidal power, and
traditional tidal electricity plant [121]. tests are also being run at other sites. Clean Current Power
There is a high capital cost for any tidal energy project, with Systems of Vancouver, Canada also announced plans to build
a construction period lasting up to 10 years. The major factors a system that generates two megawatts of power from the tidal
in determining the cost effectiveness of a tidal power site are currents in the Bay of Fundy in 2009. Marine Current
the size (length and height) of the dam needed, and the Technologies has teamed up with a German utility company to
difference in height (delta) between the high and low tide. build a 10.5-megawatt project off the coast of North Wales.
These factors can be expressed in what is called a site's Marine Current Technologies has already started working on
"Gibrat" ratio. The Gibrat ratio is the ratio of the length of the the system, which should be developed within three years
barrage in meters to the annual energy production in kilowatt [130].
hours. The smaller the Gibrat site ratio, the more desirable the Another developer, Verdant Power, has placed turbines in
site. Examples of Gibrat ratios at existing or under New York's East River to test delivery of tidal power to a local
construction tidal plants are La Rance at 0.36, Severn at 0.87, supermarket and parking garage. The test was a success, but
and Passamaquoddy in the Bay of Fundy at 0.92 [122]. the project experienced problems with broken blades and has
Only a handful of sites in the Lower 48 states lend since installed new ones. Another urban site being explored is
themselves to utility scale tidal generation, including Eastport, beneath the Golden Gate Bridge in San Francisco [131].
ME, and a few areas along Washington's Puget Sound. Alaska, During the great depression, under Roosevelt's
however has 95 percent, of U.S. tidal resources and Canada Passamaquoddy Bay Tidal Power Project, a model was
also has huge potential, but a big challenge lies in transmitting developed by the Army Corps of Engineers to harness the
that power to markets where it can be utilized [123]. powerful tides in the Eastport, ME region. The project was
The waters off the Pacific Northwest are ideal for tapping suspended however after the United States Congress refused
tidal power, as the tides along the Northwest coast fluctuate further funding, thus the actual barrier dams were never built
dramatically, as much as 12 feet a day. The coasts of Alaska, [132].
British Columbia, and Washington, in particular, have The technology to harness Tidal Power is available,
exceptional energy-producing potential. On the Atlantic however it needs to be engineered for the lowest cost, the
seaboard, Maine is also has excellent tidal characteristics highest reliability, and the longest survivability in the hostile
[124]. and corrosive environment of the ocean. The current standard
The world's first commercial tidal-power system was to simplify maintenance of tidal power equipment is to mount
connected to the power grid in Northern Ireland in November the turbines on a crossbar of a large steel beam that is held in
2008. Built by the British tidal-energy company Marine place by four legs cemented into the seabed. The crossbar can
Current Technologies (MCT), the 1.2-megawatt system be raised above or lowered below the surface of the water for
consists of two submerged turbines that are harvesting energy easy assess to the turbines.
from Strangford Lough's tidal currents. The company expects
E. Wind
that once the system, called SeaGen, is fully operational, it will
be able to provide electricity to approximately one thousand In the United States it is estimated that sufficient wind
homes [125]. energy is available to provide more than one trillion kilowatt-
hours of electricity annually, or about 27% of the total used in
Page 12 of 24](https://image.slidesharecdn.com/multivariateanalysisofenergypolicyoptions-090712120938-phpapp01/75/Multivariate-Analysis-Of-Energy-Policy-Options-Using-Lindo-12-2048.jpg)
![2003 [133]. In theory wind power is nearly limitless, as (WPA) project has set a goal for 30 states to have 100 MW of
growth simply requires the installation of additional wind wind installed by 2010 [140].
turbines. However, both the nature of wind power, and the
condition of the United States electrical grid, impose
additional practical constraints on the amount of electricity
wind power can supply to the United States. In theory North
Dakota alone is capable of producing enough wind generated
power to meet more than one fourth of U.S. electricity
demand. The practical constraint here is that there is not
enough transmission capacity in the United States’ electrical
grid to channel all of this power out of North Dakota to other
Figure 13: Annual and Cumulative Growth in U.S. Wind Power [141].
regions in the United States where it will be utilized [134]. In
addition to the above constraints, a 10% threshold has been
The Wind Energy Program's goal is to reduce the cost of
identified by most analysts as the point where the wind's
electricity for large land based wind systems in Class 4 winds
variability becomes a significant issue for utility system
(5.8 m/s at a height of 10 m) to 3.6 cents per kilowatt-hour
operators [135]. The theoretical potentials of the windiest
(kWh) by 2012, and offshore systems in Class 6 winds (6.7
states are shown in Table 5.
m/s at a height of 10 m) to 7 cents/kWh by 2014. Wind
Wind power capacity in the United States has begun to grow
turbines are currently capable of producing electricity at 5 - 8
exponentially in recent years as shown in Figure 13. Wind
cents/kWh in Class 4 wind regimes across the United States
power capacity surged by 46% in 2007, with 5,329 MW added
[142].
and $9 billion dollars invested. In 2007, wind power
Wind power potential is categorized into classes, and each
constituted 35% of all new U.S. electric generating capacity
wind power class spans two power densities, as shown by the
[136]
offset in Table 6. A designation of class 3 or higher is suitable
For three consecutive years, wind power has been the
for most utility scale wind turbine applications, whereas class
second largest new resource added to the U.S. electrical grid in
2 areas are marginal for utility scale applications but may be
terms of nameplate capacity, behind the 7,500 MW of new
suitable for rural residential scale applications. Class 1 areas
natural gas plants, but ahead of the 1,400 MW of new coal
are generally not suitable for wind power generation [143].
[137].
Table 6: Classes of wind power density at 10 m and 50 m [144].
Like solar power, wind power fails to generate electricity
when the winds are not sufficiently strong to power the
Table 5: States with the Highest Wind Energy Potential [136].
turbines. To address the variable nature of wind power, the
wind-to-hydrogen (Wind2H2) project is developing a method
To provide 20% of the nation’s electricity supply, U.S. wind
of linking wind turbines to electrolyzers, which pass the wind
capacity would have to increase from its current 11,600 MW
generated electricity through water to split the liquid into
to more than 325,000 MW. Incorporating this amount of wind
hydrogen and oxygen. The hydrogen can then be stored and
generated electricity in the nation’s electricity portfolio could
used later to generate electricity from an internal combustion
avoid emission of 3,500 million metric tons of carbon, which
engine or a fuel cell during times when the wind is not blowing
is equivalent to the amount of carbon produced by the entire
or the demand for electricity is excessively high [145].
transportation sector over 3-1/2 years [138].
Typically the hydrogen is generated and stored during times
An addition of this much wind capacity to the nation’s
when excess capacity is present.
electricity supply would also lead to approximately $332
A great advantage that the Wind2H2 project seeks to exploit
billion in economic investment, and more than 3,725,000 full-
is that using wind power to create hydrogen does not result in
time equivalency job years for construction and plant
the production of greenhouse gasses. Today most hydrogen is
operation, largely in rural areas [139].
"reformed" from natural gas or other fossil fuels by stripping
The Department of Energy’s Wind Powering America
the hydrogen atoms out. This process creates greenhouse gas
Page 13 of 24](https://image.slidesharecdn.com/multivariateanalysisofenergypolicyoptions-090712120938-phpapp01/75/Multivariate-Analysis-Of-Energy-Policy-Options-Using-Lindo-13-2048.jpg)
![emissions and eliminates some of the environmental benefits Wind projects installed in 2007 averaged nearly 120 MW,
of using hydrogen as a fuel source [146]. roughly double that seen in the 2004-05 period, and nearly
Another obvious use for wind generated hydrogen is fuel for quadruple that seen in the 1998-99 period [153]. Looking at
motor vehicles that at the moment principally rely on recent wind projects, the capacity weighted average 2007 sales
petroleum. The Department of Energy’s Hydrogen, Fuel Cells price for projects in 2007 was roughly $45/MWh (with a range
and Infrastructure Technologies (DOE HFC&IT) program has of $30 to $65/MWh). While this price is slightly less than the
set a goal to have delivered hydrogen in 2015 at the filling average of $48/MWh for the projects built in 2006, it is still
station for $2-3/kg, and the program goal for delivery and higher than the average price of $37/MWh for the projects
dispensing of the hydrogen is $1/kg [147]. built in 2004 and 2005, as well as the $32/MWh for the
The DOE HFC&IT program considered two cases for projects built in 2002 and 2003. However, it should be noted
hydrogen development. The first case considers the production that ongoing turbine price increases are not fully reflected in
of hydrogen at a wind farm, after which it must be delivered to 2007 wind project prices because many of these projects had
a filling station [148]. The second case studied was the locked in turbine prices and/or negotiated power purchase
production of hydrogen at the point of use using wind farm agreements as much as 18 to 24 months earlier. Prices for
generated electricity [149]. projects being built in 2008 and beyond can be expected to be
This means that for Case 1, hydrogen needs to be produced higher than current prices due to this fact. In addition, the
for $1-$2/kg as the delivery cost is not included in this study. figures above are calculated with the federal production tax
For Case 2, the hydrogen can be produced for roughly $2-3/kg, credit (PTC) in place, and would be $20/MWh higher if the
as the hydrogen can be produced at the point of use, PTC were not in place [154].
eliminating the need for delivery. Should the PTC not be extended, 2009 is likely to be a
The results of the study show that hydrogen produced from difficult year of industry retrenchment. The drivers noted
wind electricity appears to have potential to meet the DOE above should be able to underpin some wind capacity
HFC&IT program goals. If aggregate wind electricity is additions even in the absence of the PTC, and some developers
available at the filling station for $0.038/kWh, it is possible for may continue to build under the assumption that the PTC will
production, compression, and storage to cost below the target be extended and apply retroactively. However, most
of $2-3/kg for delivered hydrogen [150]. developers are expected to “wait it out,” re-starting
The study has also shown that in the near and mid term, construction activity only once the fate of the PTC is clear
hydrogen can be produced at the point of use for less then the [155].
cost of producing hydrogen at a wind farm. One reason for this The manufacturing of wind turbines and components in the
is that the capacity factors of the electrolyzers are higher in United States remains somewhat limited, in part because of the
Case 2 then in Case 1 because the aggregate wind signal helps continued uncertain availability of the federal production tax
even out the peaks and valleys of the intermittent nature of Credit (PTC). As domestic demand for wind turbines
wind energy. For example, in the near term, the capacity factor continues to surge, a growing number of foreign turbine and
for the electrolyzer is 81% in Case 1, and 90% in Case 2 component manufacturers have begun to localize operations in
[151]. the United States, and manufacturing by U.S. based companies
These results appear to show that producing hydrogen from is starting to expand [156].
aggregate wind at the point of use appears to be the most One example of new innovation in wind power
economic option. Fortunately, the diversity and distribution of manufacturing occurring in the United States is the Sweep
wind energy in the United States is sufficient to meet the needs Twist Adaptive Rotor (STAR) blade by the Knight & Carver
in most areas of the country with the exception of the Wind Blade Division in National City, California. Working
southeast, as shown in Figure 14. with program researchers at Sandia National Laboratories, an
innovative wind turbine blade has been developed that is
expected to increase energy capture by 5% to 10%. The most
distinctive characteristic of the STAR blade is a gently curved
tip, which unlike the vast majority of blades in use, is specially
designed to take maximum advantage of all wind speeds,
including marginal wind speeds. The blade was tested for
endurance at the National Renewable Energy Laboratory in
2008 [157]
While wind power has remained competitive in wholesale
power markets since 2003 [158], the weakness of the dollar,
rising materials costs, a concerted movement towards
increased manufacturer profitability, and a shortage of
components and turbines continued to put upward pressure on
Figure 14: Wind Power Resource Distribution in the United States [152].
wind turbine costs, and therefore wind power prices, in 2007
Page 14 of 24](https://image.slidesharecdn.com/multivariateanalysisofenergypolicyoptions-090712120938-phpapp01/75/Multivariate-Analysis-Of-Energy-Policy-Options-Using-Lindo-14-2048.jpg)
![[159]. A greater obstacle to the future of wind power is that much
Operations and maintenance (O&M) costs are a significant of the Nation’s best wind resources cannot be tapped to meet
component of the overall cost of wind power, and can vary our increasing energy demands without new transmission
widely among projects. Extrapolating historical O&M costs is system capacity. The development of new transmission lines is
problematic due to both the dramatic changes in wind turbine challenged by many regulatory, jurisdictional, siting, and cost
technology that have occurred over the last two decades, and allocation barriers [166].
the up scaling of wind turbine size. Despite this however, one The lack of transmission availability remains a primary
statement that can be made with a fair degree of certainty is barrier to wind development. New transmission facilities are
that projects installed more recently have, on average, incurred particularly important for wind power because wind projects
much lower O&M costs. Specifically, looking at the capacity are constrained to areas with adequate wind speeds, which are
weighted average O&M costs for projects in the 1980s were often located at a distance from load centers. In addition, there
approximately $30/MWh, dropping to $20/MWh for projects is a mismatch between the short lead time needed to develop a
installed in the 1990s, and down to $9/MWh for projects wind project and the lengthier time often needed to develop
installed in the 2000s. This drop in O&M costs may be due to new transmission lines. Moreover, the relatively low capacity
a combination of at least two factors: (1) O&M costs generally factor of wind can lead to underutilization of new transmission
increase as turbines age, as component failures become more lines that are intended to only service this resource. The
common, and as manufacturer warranties expire; and (2) allocation of costs for new transmission investment is also of
projects installed more recently, with larger turbines and more critical importance for wind development, as are issues of
sophisticated designs, may experience lower overall O&M transmission rate “pancaking”. Pancaking occurs when power
costs on a per-MWh basis [160]. is wheeled across multiple utility systems, and charges are
imposed for both inaccurate scheduling of wind generation,
and interconnection queuing procedures [167 ].
IV. SOFT CONSIDERATIONS
The bulk of the electric grid power grid in the United States
was designed and built in the 1960s. To put this in perspective
our current power grid dates from the time when Frank Sinatra
was in his prime and before a man walked on the moon [168].
Figure 15: Average O&M Costs for Available Data Years from 1983- The United States has a lot of renewable energy sources, the
2006 [161]. problem is that they are often not located in close proximity to
major population centers. For example, the United States’ best
Despite the great strides that have been made recently with solar power resources are located in the desert regions of the
wind power, it still has some obstacles to be overcome. Wind southwestern United States, far from most major population
power radar interaction issues gained national attention in centers. In order to make best utilization of the available
2006 due to the potential for radar operations to be affected by renewable energy sources it will be necessary not only to
wind turbines. Interference occurs when radar signals are upgrade the carrying capacity of the power grid, but to have
reflected back by wind turbines causing clutter on the radar better methods of load balancing the power grid to deal with
screens. It seems with even small wind turbines, when the tips the erratic nature of renewable power. These complex
of the blades are whirling at just the right speed, will give off a feedback and control problems will need to be dealt with to
radar signature larger than that of a Boeing 747 Jumbo Jet prevent both the overloading and underutilization the power
[162]. Large wind farms also have the potential to create radar grid.
"dead zones" above and behind a particular wind farm, or Exacerbating this problem is that deregulation has orphaned
"ghosting," whereby false images can be created [163]. the transmission business, uncoupling the lines that deliver
These facts have been utilized by some U.S. government electricity from the revenue producing power plants. Just
agencies and officials to effectively halt development of many 13,500 kilometers of high-voltage transmission additions are
pending wind energy facilities, and this could lead to a de planned throughout North America over the next decade, a
facto moratorium on the development of future wind power in 4.2% increase - and only a fraction of them are likely to get
the United States according to the American Wind Energy built. Meanwhile, the U.S. Department of Energy estimates
Association [164]. One campaign to stop future wind farms that generating capacity in the United States alone will grow
was started by Cape Cod merchants and wealthy landowners. more than 20 percent over the same period [169].
Senator Ted Kennedy has come under criticism for his The problem with transporting energy from where it is
opposition to the Cape Wind farm project, as he owns a generated to where it is needed is the loss of power incurred
summer home whose view would be obstructed and will from the resistance of the distribution network. Energy losses
overlook the proposed wind farm [165]. in the U.S. power grid are currently about 7.2%, and the
Page 15 of 24](https://image.slidesharecdn.com/multivariateanalysisofenergypolicyoptions-090712120938-phpapp01/75/Multivariate-Analysis-Of-Energy-Policy-Options-Using-Lindo-15-2048.jpg)
![longest cost effective distance to transmit electricity over the of blade cleaning is to eliminate dust and insect buildup, which
U.S. power grid is about 4,000 miles [170]. otherwise deforms the shape of the airfoil and degrades
As of 1980, High temperature superconductors promise to performance. Similarly, solar panels also need to be kept
revolutionize power distribution by providing lossless clean for optimum performance and require water for this
transmission of electrical power. The development of purpose.
superconductors with transition temperatures higher than the
boiling point of liquid nitrogen has made the concept of Technology gallons/kWh liters/kWh
superconducting power lines commercially feasible, at least for Wind [174] 0.001 0.004
high-load applications. It has been estimated that the waste Solar [175] 0.030 0.110
Table 8: Water Consumption for Wind and Solar Power.
would be halved using this method, since the necessary
refrigeration equipment would consume about half the power
V. LINDO MODEL
saved by the elimination of the majority of resistive losses.
Such cables are particularly suited to high load density areas A. Tables
such as the business districts of large cities, where purchase of
a wayleave for cables would be very costly. [171] The
potential benefits of high temperature superconducting power Cost kWh
lines merit the spending of tax dollars on its research and Source Reference
Min Avg Max
development. Coal Clean $0.080 [176]
Another area that merits further research is fusion. While Coal Dirty $0.040 [177]
scientists have sought to make fusion work on earth for over Oil $0.055 [178]
Natural Gas $0.025 $0.035 $0.095 [179]
50 years, if the effort should ever prove to be successful, an Nuclear $0.039 $0.071 [180]
energy source will be at mankind’s disposal that is Geothermal $0.050 $0.080 [181]
inexhaustible. One out of every 6500 atoms of hydrogen in Hydroelectric $0.053 $0.110 [182]
ordinary water is deuterium, giving a gallon of water the Solar $0.100 $0.140 [183]
Tidal $0.060 $0.100 [184]
energy content of 300 gallons of gasoline. In addition, fusion
Wind $0.040 $0.060 [185]
would be environmentally friendly, producing no combustion Table 9: Cost per kWh for Electricity by Source of Generation.
products or greenhouse gases. While fusion is a nuclear
process, the products of a fusion reaction (helium and a
neutron) are not intrinsically radioactive. Some short lived
radioactivity might result from interactions of the fusion
products with the reactor walls, but a proper design for a Efficiency (%)
Power Source Reference
fusion power plant would be passively safe, and would Low Avg High
1
produce no long lived radioactive waste. Design studies show Nuclear 30 31 33 [186]
2
that electricity generated from a fusion power plant should Nuclear 41 [187]
3
eventually be about the same cost as present day energy Coal Clean 37.5 41 44 [188]
4
sources [172]. Coal 34 36 38 [189]
5
The final soft consideration is one that is often not thought Oil 36 38 44.7 [190]
6
of when analyzing energy generation systems. Water is Oil 46 47 48
7
becoming a scarce resource in the world, and water use is a Oil 50 55
8
significant issue in energy production, as conventional power Natural Gas 33 35 80 [191]
Wind 35 [192]
plants use large amounts of water for the condensing portion of
Geothermal 25 37 50 [193]
the thermodynamic cycle. For coal plants, water is also used to Hydroelectric 90 [194]
clean and process fuel. Table 7 shows the amount of water Solar
9
40.7 [195]
nonrenewable power sources typically utilize. Solar 10.5 21 31.25 [196][197]
Tidal 80 [198]
Technology gallons/kWh liters/kWh 1. Boiling Water Reactors & Pressurized Water Reactors
Coal 0.49 1.9 2. Advanced Gas-cooled Reactor Supercritical Water Reactor
Natural Gas 0.25 0.95 3. Supercritical Pulverised Coal Combustion (PCC).
Nuclear 0.62 2.3 4. Steam Turbine Coal
Oil 0.43 1.6 5. Subcritical fossil fuel
Table 7: Water Consumption for Conventional Power Plants [173]. 6. Super Critical
7. Ultra Critical
8. High for micro turbines only
Even some forms of renewable energy generation must
9. For New World Record Achieved December 5, 2006 Only.
utilize water as shown in Table 8. Small amounts of water are Table 10: Energy Generation Efficiency Level by Power Source.
used to clean wind turbine rotor blades in arid climates where
rainfall is not sufficient to keep the blades clean. The purpose
Page 16 of 24](https://image.slidesharecdn.com/multivariateanalysisofenergypolicyoptions-090712120938-phpapp01/75/Multivariate-Analysis-Of-Energy-Policy-Options-Using-Lindo-16-2048.jpg)
![Capacity Factor Renewable Energy Sources (Infinite) will be denoted as Is.
Source Reference
Min Avg Max
Coal 72.6% [199]
Where s is the source.
Oil 12.6% [200]
Natural Gas 10.7% [201] IG – Geothermal
Nuclear 89.6% [202]
Geothermal 90.0% [203] IH – Hydroelectric
Hydroelectric
1
42.4% [204] IS – Solar
Solar 26.4% 33.2% 40.0% [205]
IT – Tidal
Tidal 20.0% 27.5% 35.0% [206]
Wind 44.0% [207] IW – Wind
1. Capacity factors for solar technologies are assumed to vary by time of day
and season of the year, such that nine separate capacity factors are provided C. Assumptions
for each modeled region.
For the Lindo model to be meaningful some assumptions
Table 11: Capacity Factors for Various Forms of Power Generation.
need to be made. The nine parameters in section B will be the
percentage contribution each energy source should make
toward the total generation capacity in the year 2030, and each
Operating Cost kW/hr
Source
Min Avg Max
References parameter will be allowed to vary between a minimum value
Coal Clean 0.39000 [208]
and a maximum value. The minimum and maximum values
Coal Dirty 0.01799 [209] were picked using the following logic.
Oil 0.02015 [210] Since coal currently generates 50% of the electric energy in
Natural Gas 0.03495 [211] the United States, the maximum was arbitrarily set at 60% as it
Nuclear 0.01800 [212] would be inappropriate to have excessive dependence on a
Geothermal 0.00400 0.01400 [213] single energy source. As previously stated, the United States
Hydroelectric 0.01000 [214]
owns a nearly limitless supply of coal. Also, all parameters in
Solar 0.05000 0.12000 [215]
Tidal
1
[216]
the model relating to coal use figures for “clean” coal
Wind 0.05000 [217] technology because it is hard to imagine lawmakers passing
1. Insufficient Data. Estimated at 0.044% of Revenue (best case) funding for “dirty” coal plants. The minimum value for coal
Table 12: Operating Costs for Methods of Electricity Generation. was set at 10%, as it is hard to imagine coal being eradicated
from use in 22 years.
Source Capital Cost (Billions) Output MW $/kW References The maximum set for nuclear power is 30%, and this is only
Coal Clean 1.5 250 6000 [218] possible if reprocessing of waste begins and the Yucca
Coal Dirty 0.6 250 2400 [219]
Oil 2.3 2400 958 [220] Mountain facility comes online in a timely manner. The
Natural Gas 0.5 500 1000 [221] minimum value for nuclear power was set at 10%, as nuclear
Nuclear 9 1117 8057 [222][223] power certainly will not be going away within 22 years.
Table 13: Capital Costs vs. Output in $/kW for nonrenewable Energy As previously shown, natural gas prices in recent years have
Sources.
been growing exponentially and there is no reason to see a
reversal of this trend given that no new supplies of significant
Capital Cost
Source Output MW $/kW References volume have been discovered. Natural gas was capped at its
(Millions)
Geothermal $2,500 [224] current contribution value of 20%. The minimum value given
Geothermal 2 0.4 $5,000 [225] [235] for natural gas was set at 0%, as it would be beneficial to get
Geothermal 55 20 $2,770 [226] away from dependence on this resource.
Hydroelectric 202 170 $1,188 [227] Petroleum cannot be utilized for new power plants by law,
Hydroelectric 192 192 $1,000 [228]
Hydroelectric 320 158 $2,025 [229]
[236] and the maximum is set 0.5%, approximately ½ of its current
Hydroelectric 69 78 $885 [230] contribution rate. While it would be nice to eradicate
Solar 100 14 $7,143 [231] [237] petroleum as a source for electrical energy, it is highly unlikely
Tidal 20 1.2 $16,667 [232] [238] given that in emergencies petroleum generators are often
Wind 180 68 $2,647 [233] [239] connected to the grid to provide emergency power when other
Wind 1,600 450 $3,556 [234] [240]
power plants must be shut down for emergency reasons.
Table 14: Capital Costs vs. Output in $/kW for Renewable Energy
Sources. Geothermal power is limited by the known resources in the
United States that have been determined by exploratory work,
or approximately 2 GW of developable geothermal resources
B. Abbreviations and Acronyms beyond what is currently being utilized. This would provide a
Non Renewable (Finite) Energy Sources will be denoted as maximum of value of approximately 1.6%. The minimum
Fs. Where s is the source. value was set at the current level of geothermal power
generation, as most of the geothermal plants are new can be
FC – Coal expected to last another 22 years.
FN – Nuclear The United States has a known undeveloped capacity of 30
FG – Natural Gas GW of hydroelectric power, putting the maximum value at
FP – Petroleum 10.3%. The minimum value was set at the current
hydroelectric power generation rate of 7.1%, as current
Page 17 of 24](https://image.slidesharecdn.com/multivariateanalysisofenergypolicyoptions-090712120938-phpapp01/75/Multivariate-Analysis-Of-Energy-Policy-Options-Using-Lindo-17-2048.jpg)
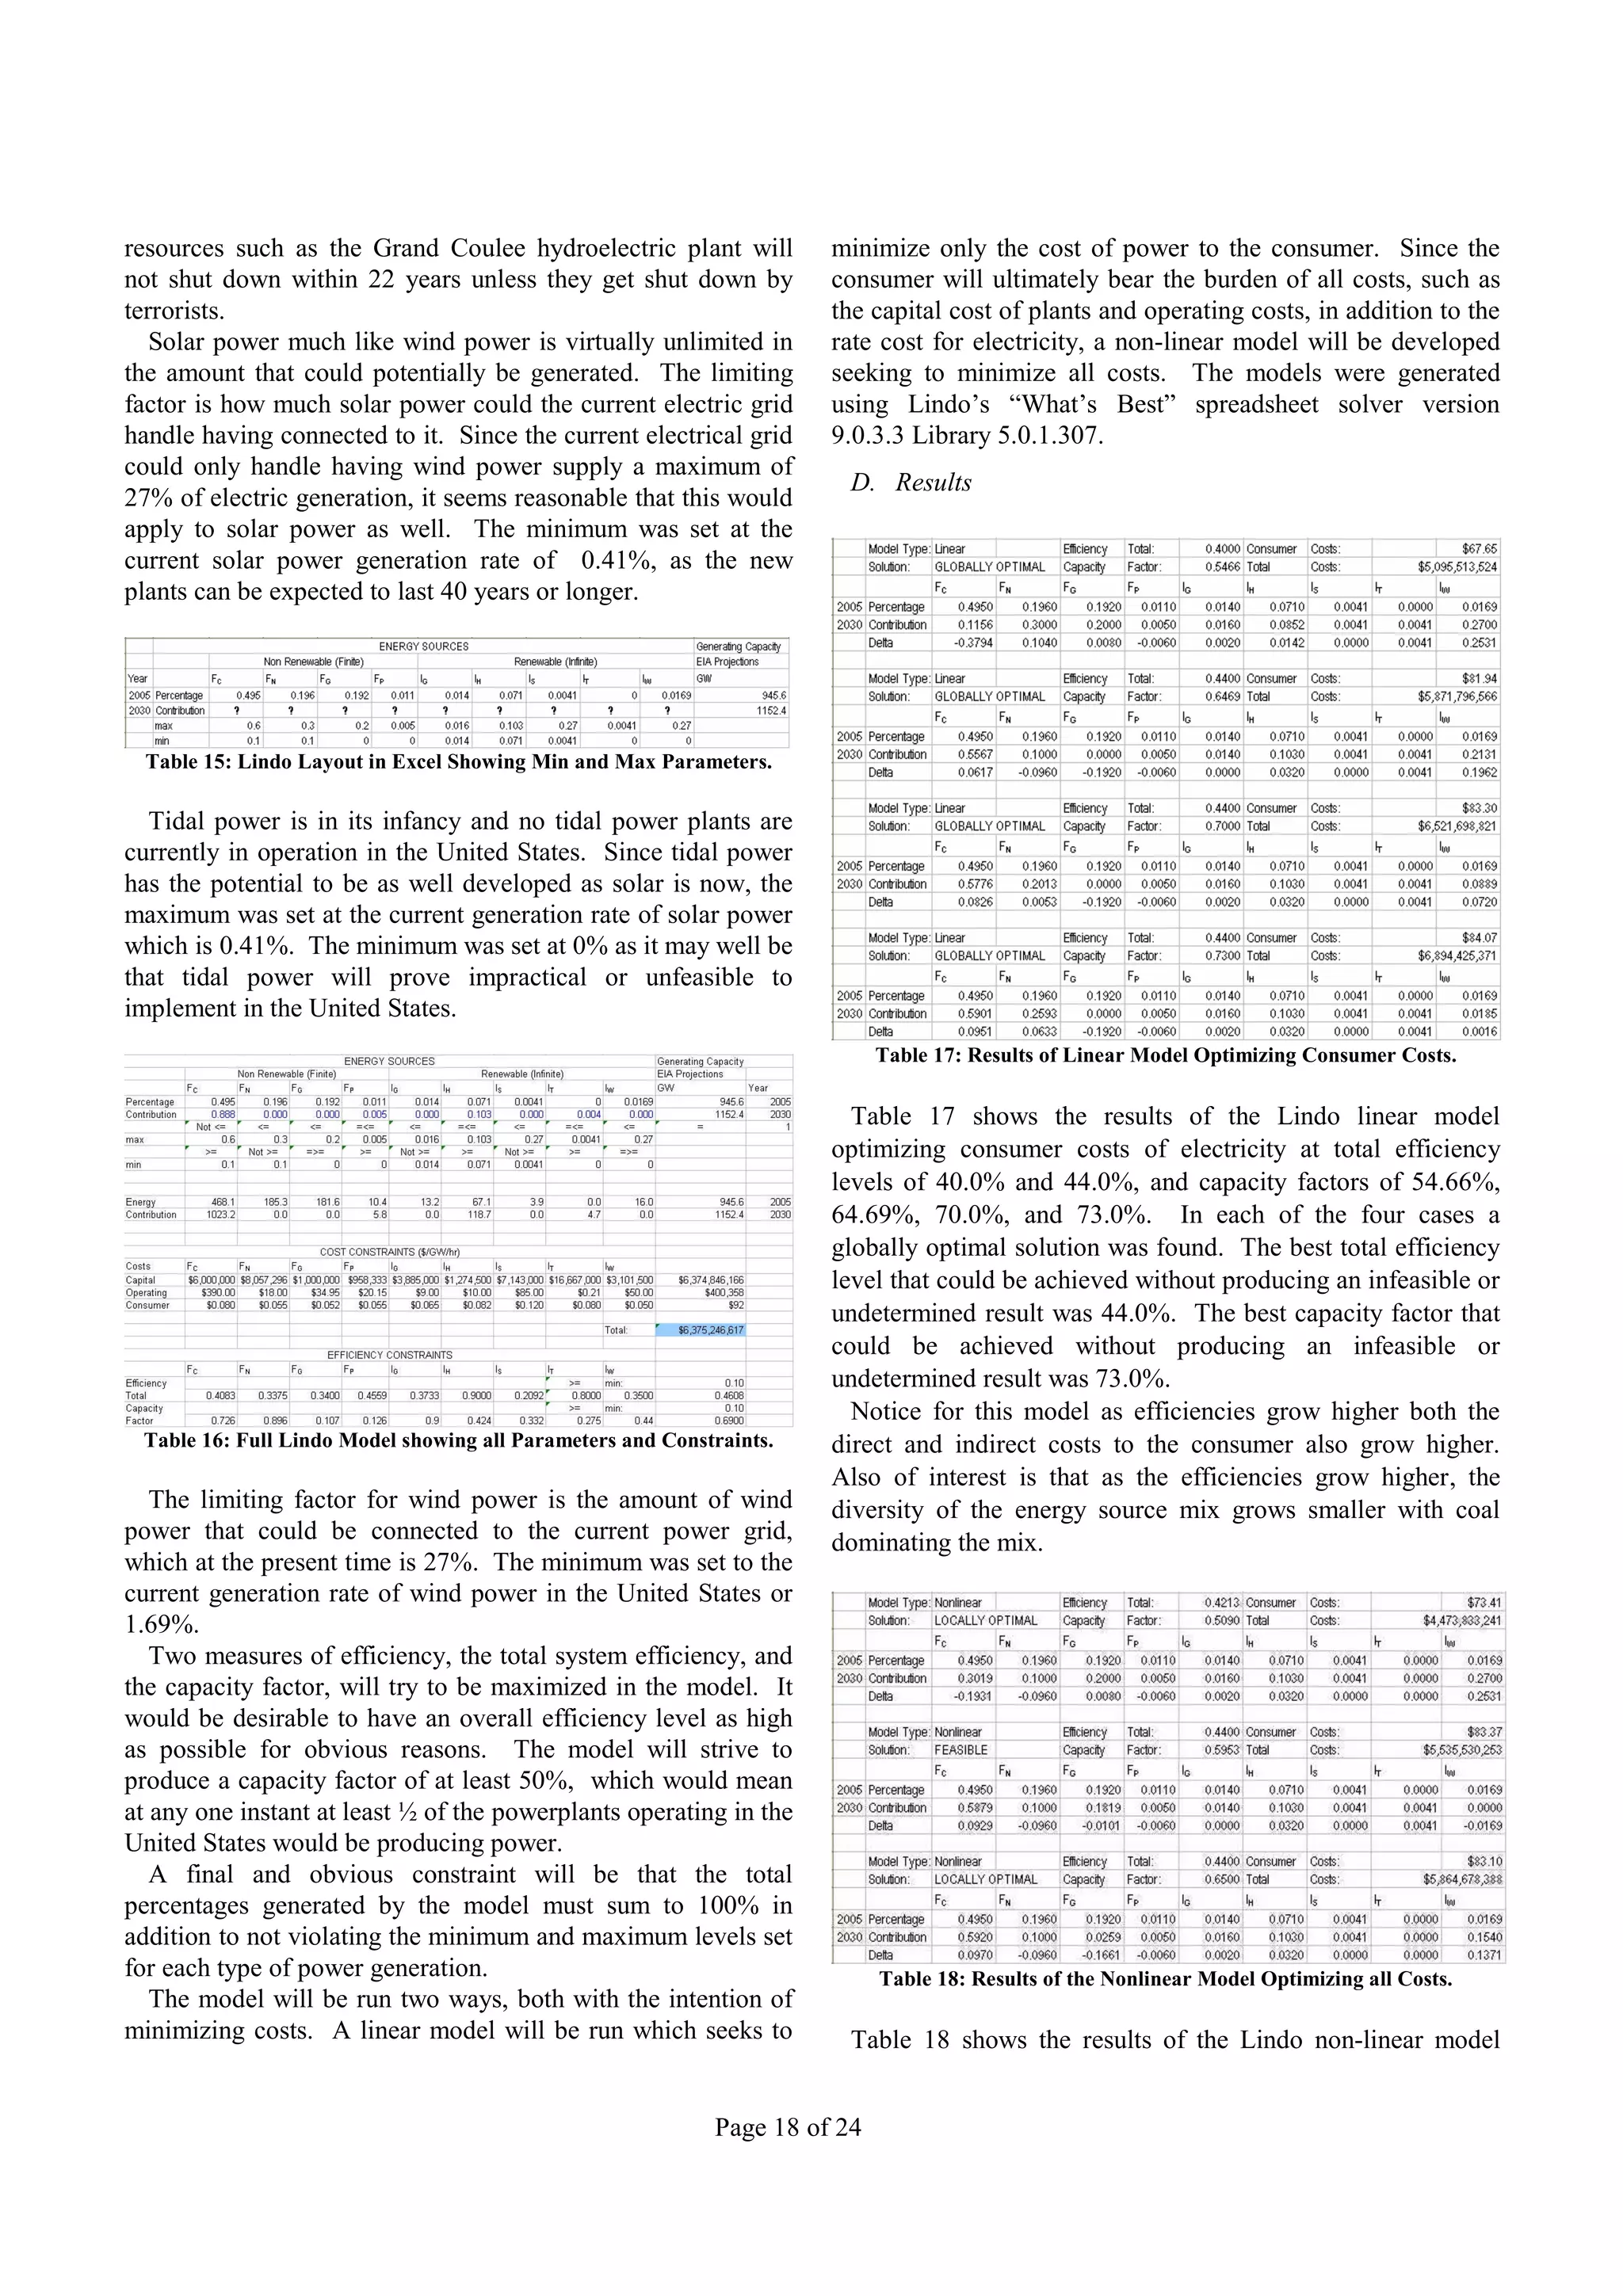
![optimizing both direct and indirect costs of electricity at total low efficiencies and capacity factors can be tolerated, a more
efficiency levels of 42.13% and 44.0%, and capacity factors of homogeneous mix of energy generation techniques can be
50.90%, 59.53%, and 65.00%. In each of the three cases a utilized.
locally optimal or at least a feasible solution was found. The Looking at Figure 16, with low efficiencies, coal and wind
best total efficiency level that could be achieved without each constitute roughly a third of energy generation capacity,
producing an infeasible or undetermined result was 44.0%. with natural gas providing a fifth, while hydroelectric and
The best capacity factor that could be achieved without nuclear each provide a tenth. The remaining 2½ percent is
producing an infeasible or undetermined result was 65.0%. provided by geothermal, solar, and petroleum.
Notice for this model as efficiencies grow higher both the Capacity factors for the intermittent technologies, such as
direct and indirect costs to the consumer also grow higher, wind and solar, are about a third to a half of the factors for the
with the notable exception that consumer costs decrease by 27 fossil-fueled technologies, making the renewable technologies
cents between the last two cases with efficiencies of 44.0%, less suitable for baseload electricity demand compared to the
59.53% and 44.0%, 65.0% respectively. Also of interest is that fossil fuel technologies [241]. If the energy grid can be
as the efficiencies grow higher, the diversity of the energy adjusted to provide reliable output from a variety of energy
source mix grows smaller, with coal dominating the mix, as sources with an intermittent nature, it will be possible to utilize
had been the case in the linear model. more “green” energy.
E. Considerations
The question is now which model is a better representation
of the circumstances the United States is currently in, the
linear model or the nonlinear model. It depends mainly on the
interpretations made as to how well each model represents the
many soft considerations discussed in the descriptions of each
energy generation technique.
Looking at the differences in the models, an argument could
be made that the nonlinear model is the best representation for
the following reasons. The linear model has natural gas use
decreasing to zero utilization by 2030 which is unlikely. The
linear model has nuclear energy growing by 5% which is
problematic given the fact that the United States neither
Figure 17: Proposed 2030 Energy Generation for High Efficiencies.
reprocesses waste or has a working repository to store nuclear
waste. Finally, the linear model shows that enough wind
If however the power grid proves not to be amenable to
capacity has already been built, recommending an increase of
power generation techniques with low capacity factors and
only 0.16%. This is in stark contradiction to what is currently
efficiencies, a power generation mix like that shown in Figure
happening in the industry, where wind power generation has
17 would prove to be most economical. Here coal would
begun to grow exponentially starting around 1997.
provide the bulk of electrical generation (as it does now) rising
from 50 to 60 percent. Both nuclear and hydroelectric would
VI. CONCLUSIONS
remain the same as in the linear model at 10%. Wind power
would only rise to 15.4% (principally because of the
intolerance to its low capacity factor), and the remaining 2½
percent would be provided by geothermal, solar, and
petroleum as in the previous case.
Looking at the data from both the linear and nonlinear
models some common truths can be determined which apply in
all or nearly all instances:
Hydroelectric Resources should be maximized.
Geothermal Resources should be maximized.
Solar Power is not yet commercially viable.
Tidal Power is not yet commercially viable.
Coal will play a significant role in energy
Figure 16: Proposed 2030 Energy Generation for Low Efficiencies. generation for the foreseeable future.
The conclusions that can be drawn from the model depend It should be noted that oil as a parameter (FP) was given the
on if low efficiencies and capacity factors can be tolerated. If freedom to reach zero in the model optimization process, but
Page 19 of 24](https://image.slidesharecdn.com/multivariateanalysisofenergypolicyoptions-090712120938-phpapp01/75/Multivariate-Analysis-Of-Energy-Policy-Options-Using-Lindo-19-2048.jpg)
![never did so. In terms of cost and efficiency, petroleum is very The author would also like to thank Dr. James C. Daly at the
difficult to beat. University of Rhode Island for some thought provoking
Wind power (IW) grew substantially in most of the modeled discussions.
cases. It is probably safe to conclude that wind power will
grow to provide at least 15% of the electrical power generation
capability in the United States by 2030 unless unforeseen REFERENCES
events happen. [1] M. King Hubbert, “Nuclear Energy and the Fossil Fuels” Chief
At the current time nuclear power is very expensive and Consultant (General Geology), Exploration and Production Research
Division, Shell Development Company, Publication Number 95,
problematic when compared to other technologies such as Houston, Texas, June 1956, Presented before the Spring Meeting of the
clean coal where the carbon is captured and sequestered. In Southern District, American Petroleum Institute, Plaza Hotel, San
most of the modeled cases, (FN) was decreased. Antonio, Texas, March 7-8-9, 1956, p. 22.
The model was run using parameters for solar power (IS) at [2] John H. Wood, Gary R. Long, David F. Morehouse, “Long-Term World
Oil Supply Scenarios - The Future Is Neither as Bleak or Rosy as Some
half the theoretical maximums. This is because solar power Assert.”, U.S. Energy Information Administration, August 18, 2004.
cells mass produced ordinarily can only achieve ½ the [3] Kevin Kliesen, Review, September/October 2008 Issue, The Federal
efficiency levels of solar cells custom produced in a Reserve Bank of St. Louis.
[4] Michael T. Kiley, “Estimating the common trend rate of inflation for
laboratory. The models were also tested with solar power consumer prices and consumer prices excluding food and energy
parameters set at theoretical maximums, yet solar power prices”, Federal Reserve Board, [2008-38], July 16, 2008.
remained not viable and constrained to its minimum value in [5] EIA, Energy Information Administration, Electric Power Monthly,
August 2008 Edition.
all cases. [6] EIA, Energy Information Administration, Annual Energy Review,
While both solar and tidal power are not yet commercially Annual Energy Review 2007, Report No.DOE/EIA-0384(2007), Posted:
viable, this does not mean they should be abandoned. The June 23, 2008.
[7] EIA, Energy Information Administration, Petroleum Basic Statistics,
government should allocate more research dollars toward these
Updated/Reviewed: September 2008.
technologies to make them commercially viable. [8] Chart
It was found during the course of research that a great deal [9] EIA, Energy Information Administration, Existing Capacity by Energy
of very basic information was not available in a nicely Source, Electric Power Annual with data for 2006, October 22, 2007,
http://www.eia.doe.gov/cneaf/electricity/epa/epat2p2.html
summarized format or table form. For example, the [10] “New Power Plant Aims to Help Coal Clean Up”, David Biello,
Department of Energy’s Energy Information Administration Scientific American, December 19, 2007.
(EIA) does not have a chart of various electricity generation [11] “Clean Coal Power Technologies”, Oak Ridge National Laboratory
Review, Volume 35 February 2002,
sources vs. their average cost. Nor did it contain a list of http://www.ornl.gov/info/ornlreview/v35_2_02/clean_coal.shtml
energy efficiency levels for types of nuclear power plants. [12] Assistant Secretary of Energy Highlights Clean Coal Technologies to
While the EIA does contain a wealth of information, it does Sustain America’s Economic Growth, United States Department of
Energy, September 1, 2006, http://www.energy.gov/4133.htm
lack charts and tables of expected values for some basic [13] “Clean Coal Power Technologies”, Oak Ridge National Laboratory
parameters. The author made every effort to obtain Review, Volume 35 February 2002,
information from published peer reviewed sources, but in http://www.ornl.gov/info/ornlreview/v35_2_02/clean_coal.shtml
some instances, notably for the newest technologies such as [14] SRI Consulting Business Intelligence, Disruptive Technologies Global
Trends 2025, Appendix D: Clean Coal Technologies (Background), SRI
tidal power generation, this was not always possible. Consulting Business Intelligence.
The model presented in this paper is by no means [15] Ibid.
completely inclusive of all aspects involved in energy [16] Ibid.
[17] Source: Project Fact Sheets 1997, Clean Coal Technology
generation and consumption. Possible extensions of the work Demonstration Program, U.S. Department of Energy, Assistant
could involve forecasting energy demand and use by taking Secretary for Fossil Energy, Washington, D.C.: February 1998.
into account the distance of major population centers to [18] Ozone Transport Assessment Group, Technical Support Document,
Chapter 6: Report of the Implementation Strategies and Issues
various energy generation types and other geographic Workgroup, Environmental Council of States. Document available on
constraints. the Internet at URL http://www.epa.gov/ttnotag1/finalrpt/temp/
Another interesting extension of the work would be a [19] Ibid [17].
statistical analysis of how various energy sources with [20] Verne W. Loose, Clean Coal Technology Diffusion: The Impact of
Electric Power Industry Restructuring, The Electricity Journal,
intermittent natures might be able to load balance each other December 1998.Ibid [17].
out to form a more predictable output. A feedback and control [21] Source: Project Fact Sheets 1997, Clean Coal Technology
analysis of the current power grid and the projected effects of Demonstration Program, U.S. Department of Energy, Assistant
Secretary for Fossil Energy, Washington, D.C.: February 1998.
the addition of new energy sources such as wind and solar will [22] Martin LaMonica, “MIT: To keep coal, carbon needs to go
effect the behavior and stability of the power grid. underground”, CNET News, March 14, 2007.
[23] Freedman, Steven I., “The Role of Natural Gas in Electric Power
Generation in the Twenty First Century”, Economics and Politics of
ACKNOWLEDGMENT Energy, Plenum Press, New York, 1996.
The author would like to thank Karen Freedman of the [24] Ibid.
[25] Ibid.
National Energy Information Center for promptly responding [26] Ibid.
to inquiries regarding information on energy data or statistics.
Page 20 of 24](https://image.slidesharecdn.com/multivariateanalysisofenergypolicyoptions-090712120938-phpapp01/75/Multivariate-Analysis-Of-Energy-Policy-Options-Using-Lindo-20-2048.jpg)
![[27] Marianne van Egteren, “Natural Gas for Electric Power Generation”, http://gop.science.house.gov/hearings/energy05/june15/finck.pdf
Utilities Policy, April 1993, pages 145-153. (January 17, 2008).
[28] Ibid. [56] Ibid “Yucca Mountain Remains Critical to Spent Nuclear Fuel
[29] Ibid [1]. Management” p.4
[30] Shook, Barbara, “British author says world may be close to peak natural [57] Ibid
gas output”, The Oil Daily, 15-NOV-07. [58] Frank N. von Hippel, “Plutonium and Reprocessing of Spent Nuclear
[31] M. King Hubbert, 1971, “The energy resources of the earth in Energy Fuel”, Science, Volume 293, Number 5539, Issue of 28 Sep 2001, pp.
and Power", p.35. 2397-2398.
[32] Robert S. Pindyck, “Prices And Shortages: Evaluating Policy Options [59] U.S. Department of Energy, Draft Environmental Impact Statement for a
For The Natural Gas Industry”, Massachusetts Institute of Technology, Geologic Repository for the Disposal of Spent Nuclear Fuel and High-
July 1977, #MIT-EL 77-022WP, Page 2. Level Radioactive Waste at Yucca Mountain (YMP-0106, Yucca
[33] Kubiszewski, Ida, Cutler J. Cleveland, "Powerplant and Industrial Fuel Mountain Project, North Las Vegas, NV, 1999); available at
Use Act of 1978, United States.", Encyclopedia of Earth, September 3, www.ymp.gov/documents/deis/index.htm, Section 4.2.1.
2006. [60] Matthew R. Simmons, Twilight in the Desert: The Coming Saudi Oil
[34] EIA, Energy Information Administration, “Repeal of the Powerplant and Shock and the World Economy, Wiley; June 10, 2005, 978-
Industrial Fuel Use Act (1987)”, 0471738763
http://www.eia.doe.gov/oil_gas/natural_gas/analysis_publications/ngma [61] Ibid [1] p.22
jorleg/repeal.html [62] Ben Witten, Stanford University, “Evaluating Hubbert's Peak and
[35] Simon Romero, “Short Supply of Natural Gas Is Raising Economic Improvements”, Oil And War, 2006, p 11.
Worries”, New York Times, June 17, 2003. [63] U.S. Department of Energy, Geothermal Technologies Program,
[36] EIA, Energy Information Administration, Country Analysis Briefs, http://www1.eere.energy.gov/geothermal/geomap.html
Natural Gas, [64] Chena Power Geothermal Power Plant, Final Project Report, Chena
http://www.eia.doe.gov/emeu/cabs/Canada/NaturalGas.html Power, LLC, United Technologies Corporation, Alaska Energy
[37] Ibid. Authority, February 4, 2007
[38] EIA, Energy Information Administration, Natural Gas Navigator, [65] Geothermal Power, Renewable Northwest Project, www.rnp.org, revised
http://tonto.eia.doe.gov/dnav/ng/hist/n3010us3m.htm September 2006.
[39] Ibid. [66] National Association of Regulatory Utility Commissioners, “Investing
[40] EIA, Energy Information Administration, U.S. Nuclear Reactors, in the Future: A Regulator’s Guide to Renewables”, 1993.
http://www.eia.doe.gov/cneaf/nuclear/page/nuc_reactors/reactsum.html [67] Masashi Shibaki, “Geothermal Energy for Electric Power”, A REPP
[41] Nuclear Power’s Missing Fuel, Business Week, July 10, 2006, p.34. Issue Brief, December 2003, page 4.
[42] Martin Sevior, “Should nuclear be feared... or is it nuclear power’s [68] Cédric Nathanaël Hance, Geothermal Energy Association, Factors
hour?”, Waste Management and Environment, http://nuclearinfo.net Affecting Costs of Geothermal Power Development, July 2005, page 7.
[43] "Integrated Database Report 1994, U.S. spent Nuclear Fuel and [69] Ibid. page 35.
Radioactive Waste Inventories, Projections and Characteristics (revision [70] Ibid [63].
12), pages 258 - 265, Table A.2 Mass, radioactivity, and thermal power [71] Ibid [67], page 11.
of nuclides in domestic commercial LWR spent nuclear fuel, Oak Ridge [72] Ibid [67], page 18.
National Laboratory (ORNL), under the auspices of the National [73] Ibid [67], page 25.
Technical Information Service." [74] Ibid [67], page 25-26.
http://nuclearinfo.net/Nuclearpower/WebHomeWasteFromNuclearPowe [75] Ibid [63], Page 13.
r [76] Ibid.
[44] Allan G. Pulsipher, “A De Facto Repository for the U.S.A.: The Risk of [77] Ibid [67], Page 39.
Interim Storage of High-Level Nuclear Waste,” Energy Policy 21,7 (July [78] Ibid [63], Page 10.
1993), p. 798. [79] Ibid [67], Page 40.
[45] Samuel W. Bodman, U.S. Secretary of Energy, letter to Speaker of the [80] Ibid [67], Page 40.
House Nancy Pelosi, March 6, 2007, http:// [81] Ibid [67], Page 41.
www.energy.gov/media/BodmanLetterToPelosi.pdf (April 24, 2008). [82] Ibid [67], Page 46.
[46] Energy Information Administration, World Nuclear Capacity and Fuel [83] Energy Information Administration, Form EIA-906, "Power Plant
Cycle Requirements 1993, DOE/EIA–0436(93) (Washington, DC, Report;" and Form EIA-920 "Combined Heat and Power Plant Report."
November 1993), p. 15. [84] US Department of the Interior, Bureau of Reclamation, Power
[47] Jack Spencer, Nicolas Loris, “Yucca Mountain Remains Critical to Resources Office, “Reclamation, Managing Water in the West”,
Spent Nuclear Fuel Management”, Backgrounder, No. 2131, May 1, Hydroelectric Power, July 2005, page 18.
2008, page 2. [85] Ibid.
[48] Allan G. Pulsipher, “A De Facto Repository for the U.S.A.: The Risk of [86] Ibid, page 13.
Interim Storage of High-Level Nuclear Waste,” Energy Policy 21,7 (July [87] Ibid, page 14.
1993), p. 806. [88] Ibid, page 14.
[49] Daniel J. Fehringer, “Description of HLW Repository Regulations of the [89] Ibid, page 8.
U.S. Nuclear Regulatory Commission,” in Radiation Protection and [90] Ibid, page 8.
Safety Criteria, proceedings of a workshop for the Organization for [91] Ibid, page 9.
Economic Cooperation and Development Nuclear Energy Agency, [92] Ibid, page 12.
November 5–7, 1990 (Paris, 1991). [93] Ibid, page 10.
[50] Ibid [94] Douglas G. Hall, “Hydropower Capacity Increase Opportunities”,
[51] Ibid Renewable Energy Modeling Series, U.S. Department of Energy, Idaho
[52] Ibid [47] National Laboratory, 10 May 2005.
[53] The Nuclear Waste Policy Amendments Act of 2008 (S. 2551), Nuclear [95] “Nuclear Power: 12 percent of America’s Generating Capacity, 20
Fuel Management and Disposal Act (S. 2589, 109th Congress). percent of the Electricity”, Energy Information Administration,
[54] Samuel W. Bodman, U.S. Secretary of Energy, letter to Speaker of the http://www.eia.doe.gov/cneaf/nuclear/page/analysis/nuclearpower.html.
House Nancy Pelosi, March 6, 2007, at http:// [96] David Biello, “Solar Power Lightens Up with Thin-Film Technology”,
www.energy.gov/media/BodmanLetterToPelosi.pdf (April 24, 2008). Scientific American, April 25, 2008.
[55] Phillip J. Finck, Deputy Associate Laboratory Director, Applied Science [97] Figure 1.1. The Role of Renewable Energy Consumption in the Nation's
and Technology and National Security, Argonne National Laboratory, Energy Supply 2006, Energy Information Administration,
statement before the Subcommittee on Energy, Committee on Science, http://www.eia.doe.gov/cneaf/solar.renewables/page/trends/fig1_1data.x
U.S. House of Representatives, June 16, 2005, at ls
Page 21 of 24](https://image.slidesharecdn.com/multivariateanalysisofenergypolicyoptions-090712120938-phpapp01/75/Multivariate-Analysis-Of-Energy-Policy-Options-Using-Lindo-21-2048.jpg)
![[98] Table 9.9. Average Retail Prices of Electricity, Energy Information Energy Laboratory, National Wind Technology Center, U.S. Department
Administration, November 2008 Monthly Energy Review. of Energy, May 2008, page 4.
[99] “New World Record Achieved In Solar Cell Technology”, Science [142]“Wind and Hydropower Technologies Program: Large Wind
Daily, Dec. 7, 2006, Technology”, U.S. Department of Energy - Energy Efficiency and
http://www.sciencedaily.com/releases/2006/12/061206123954.htm Renewable Energy,
[100]Ibid. http://www1.eere.energy.gov/windandhydro/printable_versions/large_wi
[101] “Largest U.S. Solar Photovoltaic System Begins Construction at Nellis nd_tech.html
Air Force Base”, SunPower Corporation, 2007, [143]National Renewable Energy Laboratory's Geographic Information
http://www.sunpowercorp.com/ System (GIS), http://www.nrel.gov/gis/wind.html#high.
[102]“Testimony of James Resor, Chief Financial Officer, groSolar”, United [144]Ibid.
States House of Representatives, Committee on Small Business, July 10, [145]National Renewable Energy Laboratory Hydrogen and Fuel Cells
2008. Research, http://www.nrel.gov/hydrogen/proj_wind_hydrogen.html
[103]EIA, Net Generation by Energy Source by Type of Producer, October [146]Ibid.
2006. [147]J. Levene, B. Kroposki, G. Sverdrup, Wind Energy and Production of
[104]“A Solar Grand Plan”, Ken Zweibel, James Mason, Vasilis Fthenakis, Hydrogen and Electricity — Opportunities for Renewable Hydrogen,
Scientific American, December 16, 2007. Conference Paper: NREL/CP-560-39534, March 2006, page 8.
[105]“Solar Energy Potential on the U.S. Outer Continental Shelf”, Minerals [148]Levene, J. “An Economic Analysis of Hydrogen Production from Wind.
Management Service, Renewable Energy and Alternate Use Program, Production” and Production Case Studies.
U.S. Department of the Interior, May 2006. www.hydrogen.energy.gov/h2a_prod_studies.html, WINDPOWER
[106]National Renewable Energy Laboratory, U.S. Department of Energy, 2005, American Wind Energy Association, 2005.
http://www.nrel.gov/gis/images/us_csp_annual_may2004.jpg [149]J. Levene, B. Kroposki, G. Sverdrup, Wind Energy and Production of
[107]Ibid [101], page 5. Hydrogen and Electricity — Opportunities for Renewable Hydrogen,
[108]Ibid [101], page 5. Conference Paper: NREL/CP-560-39534, March 2006, page 3.
[109]Ibid [105]. [150]Ibid, page 11.
[110]Ibid [105]. [151]Ibid, page 9.
[111]Johanna Ivy Levene, Margaret K. Mann, Robert Margolis, Anelia [152]http://rredc.nrel.gov/wind/pubs/atlas/maps/chap2/2-01m.html
Milbrandt, “An Analysis Of Hydrogen Production From Renewable [153]Ryan Wiser, Mark Bolinger, “Annual Report on U.S. Wind Power
Electricity Sources”, National Renewable Energy Laboratory, Installation, Cost, and Performance Trends: 2007”, National Renewable
September 2005, NREL/CP-560-37612, Page 1. Energy Laboratory, National Wind Technology Center, U.S. Department
[112]Ibid, Page 3. of Energy, May 2008, page 12.
[113]Ibid. [154]Ibid, page 17.
[114]Ocean Energy Council - News & Information about Ocean Renewable [155]Ibid, page 29.
Energy, November, 2008, http://www.oceanenergycouncil.com [156]Ibid, page 11.
[115]Jerry Harkavy, “Tidal power moves forward in eastern Maine”, [157][141] “Wind and Hydropower Technologies Program: Large Wind
Associated Press, August 23, 2008. Technology”, U.S. Department of Energy - Energy Efficiency and
[116]Ibid. Renewable Energy,
[117]Ibid [113]. http://www1.eere.energy.gov/windandhydro/printable_versions/large_wi
[118]Ibid [113]. nd_tech.html
[119]Ibid [113]. [158]Ryan Wiser, Mark Bolinger, “Annual Report on U.S. Wind Power
[120]Ibid [113]. Installation, Cost, and Performance Trends: 2007”, National Renewable
[121]Ibid [113]. Energy Laboratory, National Wind Technology Center, U.S. Department
[122]Ibid [113]. of Energy, May 2008, page 19.
[123]Ibid [113]. [159]Ibid, page 16.
[124]Ibid [114]. [160]Ibid, page 25.
[125]Brittany Sauser, “Tidal Power Comes to Market”, Technology Review [161]Ibid, page 25.
by MIT, July 29, 2008. [162]Jesse Broehl, “New Interference on the Horizon for U.S. Wind Power
[126]Ibid. Development”, RenewableEnergyWorld.com, June 15, 2006.
[127]Libby Wayman, Michael Star, Ana Albir, “Severn Tidal Power”, [163]Ibid.
Project Evaluation, Rev 1.011, Spring 2003. [164]Ibid.
[128]Ibid. [165]“Storm Over Mass. Windmill Plan: Plan For Nantucket Sound Wind
[129]Ibid [124]. Farm Raises Debate”, CBS News, June 29, 2003.
[130]Ibid [124]. [166]“Wind Power Today”, National Renewable Energy Laboratory, U.S.
[131]Ibid [114]. Department of Energy, May 2006,Page 7.
[132]Ibid [114]. [167]Ryan Wiser, Mark Bolinger, “Annual Report on U.S. Wind Power
[133]The Library Index, Installation, Cost, and Performance Trends: 2007”, National Renewable
http://www.libraryindex.com/pages/1538/Renewable-Energy-WIND- Energy Laboratory, National Wind Technology Center, U.S. Department
ENERGY.html">Renewable Energy - Wind Energy. of Energy, May 2008, page 27.
[134]American Wind Energy Association [168]Gail E. Tverberg, “The U. S. electric grid: will it be our undoing”,
http://www.awea.org/faq/wwt_potential.html#How%20much%20energy Energy Bulletin, May 7 2008.
[135]Ibid [169]“A Smarter Power Grid”, MIT Technology Review, July 2001.
[136]Ryan Wiser, Mark Bolinger, “Annual Report on U.S. Wind Power [170]Paris, G. Zini, M. Valtorta, G. Manzoni, N. De Franco, “Present Limits
Installation, Cost, and Performance Trends: 2007”, National Renewable Of Very Long Distance Transmission Systems”
Energy Laboratory, National Wind Technology Center, U.S. Department [171]Jacob Oestergaard, Jan Okholm, Karin Lomholt, Ole Toennesen,
of Energy, May 2008, page 4. “Energy losses of superconducting power transmission cables in the
[137]Ibid. grid”, ASC2000, paper 4LGa10.
[138]“Wind Power Today”, National Renewable Energy Laboratory, U.S. [172]U.S. Department of Energy, Office Of Science - Fusion Energy Sciences
Department of Energy, May 2006, page 3. Program, http://www.science.doe.gov/ofes/
[139]Ibid. [173]Paul Gipe, Wind Energy Comes Of Age, John Wiley & Sons, 1995.
[140]Ibid. [174]American Wind Energy Association estimate, based on data obtained in
[141]Ryan Wiser, Mark Bolinger, “Annual Report on U.S. Wind Power personal communication with Brian Roach, Fluidyne Corp., December
Installation, Cost, and Performance Trends: 2007”, National Renewable 13, 1996. Assumes 250-kW turbine operating at .25 capacity factor,
with blades washed four times annually.
Page 22 of 24](https://image.slidesharecdn.com/multivariateanalysisofenergypolicyoptions-090712120938-phpapp01/75/Multivariate-Analysis-Of-Energy-Policy-Options-Using-Lindo-22-2048.jpg)
![[175]Meridian Corp., "Energy System Emissions and Materials [203]"Assumptions to the Annual Energy Outlook 2008", Energy Information
Requirements," U.S. Department of Energy, Washington, DC. 1989, p. Administration,
23. http://www.eia.doe.gov/oiaf/aeo/assumption/renewable.html ,Report
[176]SRI Consulting Business Intelligence, APPENDIX D: CLEAN COAL #:DOE/EIA-0554(2008)
TECHNOLOGIES (BACKGROUND), report to National Intelligence [204]"Electric Power Annual with data for 2006", Energy Information
Council (NIC), Administration,
[177]Clean Coal Technology Diffusion The Impact of Electric Power Industry http://www.eia.doe.gov/cneaf/electricity/epa/figes3.html ,Figure ES 3.
Restructuring, Verne W. Loose,Electricity Journal, The Volume 11, Average Capacity Factor by Energy Source
Issue 10, December 1998, Pages 51-58 [205]"Assumptions to the Annual Energy Outlook 2008", Energy Information
[178]Energy Information Administration's (EIA) "Short Term Energy Administration,
Outlook", January 2007 http://www.eia.doe.gov/oiaf/aeo/assumption/renewable.html ,Report
[179]International Gas Report & Cost Survey, NUS Consulting Group, #:DOE/EIA-0554(2008)
September 2006 [206]"Tidal energy", http://www.oceanenergycouncil.com/index.php/Tidal-
[180] Energy/Tidal-Energy.html, Ocean Energy Council
[181]http://www.eia.doe.gov/kids/history/timelines/geothermal.html [207]"Assumptions to the Annual Energy Outlook 2008", Energy Information
[182]PESWiki.com -- Pure Energy Systems Wiki, Directory:Cents Per Administration,
Kilowatt-Hour, http://www.eia.doe.gov/oiaf/aeo/assumption/renewable.html ,Report
http://peswiki.com/energy/Directory:Cents_Per_Kilowatt-Hour #:DOE/EIA-0554(2008)
[183]http://www.nrdc.org/air/energy/renewables/solar.asp [208]DRY COAL CLEANING IN A MAGMILL,EXPORTech Company,
[184]North America in Stream Tidal Power Feasibility Study, Roger Bedard, Inc., www.magneticseparation.com
Electric Power Research Institute (EPRI), April 26, 2006 [209]http://www.eia.doe.gov/oiaf/issues/opctbl2.html
[185]http://apps1.eere.energy.gov/states/alternatives/wind.cfm and [210]http://www.eia.doe.gov/oiaf/issues/opctbl1.html
http://usinfo.state.gov/journals/itgic/0605/ijge/thresher.htm [211]http://www.eia.doe.gov/oiaf/issues/opctbl3.html
[186]MIT TechTalk Volume 51 – Number 2 Wednesday – September 20, [212]http://www.eia.doe.gov/cneaf/nuclear/page/analysis/nuclearpower.html
2006 [213]Geothermal Energy for Electric Power, A REPP Issue Brief, December
[187]Shultis, J. Kenneth; Richard E. Faw (2002). Fundamentals of Nuclear 2003, Masashi Shibaki
Science and Engineering. Marcel Dekker. ISBN 0-8247-0834-2 [214]http://www.eia.doe.gov/cneaf/nuclear/page/analysis/nuclearpower.html
[188]Myths and facts of “clean coal” technologies,Siemens Answers Tough [215]Concentrating Solar Power, Sandia National Laboratories and the
Questions On Energy & The Environment,www.siemens.com/answers National Renewable Energy Laboratory (working together as SunuLab)
[189]S.C. Deo Sharma, APEC Workshop on Options to Reduce CO2 [216]http://web.mit.edu/1.011/www/finalprj/Severn_Presentation_handout.pd
Emissions, Centre for Power Efficiency and Environmental Protection f
(CenPEEP), National Thermal Power Corporation, 16th February, 2004 [217]"Wind and Solar Power Systems — Design, analysis and Operation"
[190]Steam Turbines for Modern Fossil-fuel Power Plants By A Sh (2nd ed., 2006), Mukund R. Patel, p. 303
Leĭzerovich,ISBN 0881735485,The Fairmont Press, Inc., 2007 [218]David Biello, December 19, 2007, "New Power Plant Aims to Help
[191]Electric Generation Using Natural Gas, Coal Clean Up",Scientific American
http://www.naturalgas.org/overview/uses_eletrical.asp [219]Abigail Dillen, March 5, 2008, "Federal Financing for New Dirty Coal
[192]Richard Seifert, EEM-01352, Wind Power Fact Sheet, Building in Power Plants Stopped", Earthjustice Press Release
Alaska. [220]Subiya Oil-Fired Power Plant, Kuwait, http://www.power-
[193]The Future of Geothermal Energy, An assessment by an MIT-led technology.com/projects/subiya
interdisciplinary panel, 2006 Massachusetts Institute of Technology, [221]ASJYLYN LODER, January 19, 2008,"Tampa Electric is turning to
D.O.E. Contract DE-AC07-05ID14517, natural gas", St. Petersburg Times
http://geothermal.inel.gov/publications/future_of_geothermal_energy.pd [222]Steve Kidd (22 August 2008). "Escalating costs of new build: what does
f it mean?", Nuclear Engineering
[194]"Hydroelectric Power", US Department of the Interior, Power Resources [223]Nuclear Engineering and Design; Volume 236, Issues 14–16, August
Office, Managing Water in the West, July 2005 2006, Pages 1547–1557.
http://www.usbr.gov/power/edu/pamphlet.pdf [224]from US DOE:greater for a small (<1MW) power plant $3000/kW to
[195]DOE, New World Record Achieved in Solar Cell Technology,December $5000/kW
5, 2006,http://www.energy.gov/news/4503.htm [225]Chena Power Geothermal Power Plant, Chena Hot Springs AK
[196]High: ScienceDaily (Feb. 17, 2008),Solar Power: New World Record [226]IPRO 348 Spring 2007, Illinois Institute of Technology, "Design of a
For Solar-to-grid Conversion Efficiency Set 20-Megawatt Geothermal Power Plant"
[197]Low & Average: HIGH EFFICIENCY, BACK-CONTACT BIFACIAL [227]A Loui Hydro Power Plant, Vietnam
SOLAR CELLS AND APPLICATION Matthew P. Campbell, Denis M. [228]Allain Duhangan 192MW Hydroelectric Plant, India
DeCeuster, Peter Cousins, Adam Detrick, Raphael Manalo, William P. [229]Changuinola 75 Hydroelectric facility, Panama
Mulligan, SunPower Corporation [230]White Water River Hydroelectric Stations, Yunnan, China
[198]http://www.tech-faq.com/tidal-energy.shtml [231]North America’s largest solar photovoltaic system at the Nellis Air
[199]"Electric Power Annual with data for 2006", Energy Information Force Base, NV
Administration, [232]Marine Current Technologies (MCT), Strangford Lough's tidal currents,
http://www.eia.doe.gov/cneaf/electricity/epa/figes3.html ,Figure ES 3. Northern Ireland
Average Capacity Factor by Energy Source [233]Cedar Ridge Wind Farm in the towns of Eden and Empire in Fond du
[200]"Electric Power Annual with data for 2006", Energy Information Lac County Wisconsin
Administration, [234]Delmarva and Bluewater Wind Project Rehoboth Beach DE
http://www.eia.doe.gov/cneaf/electricity/epa/figes3.html ,Figure ES 3. [235]US DOE, Geothermal Technologies Program, Geothermal
Average Capacity Factor by Energy Source FAQs,http://www1.eere.energy.gov/geothermal/faqs.html
[201]"Electric Power Annual with data for 2006", Energy Information [236]LATEST INDUSTRY PROJECT IN HYDRO ELECTRIC,
Administration, http://www.power-technology.com/projects/category/hydro-electric/,
http://www.eia.doe.gov/cneaf/electricity/epa/figes3.html ,Figure ES 3. SPG Media
Average Capacity Factor by Energy Source [237]"North America’s Largest Solar-Electric Plant Switched On", Sunpower,
[202]"Electric Power Annual with data for 2006", Energy Information April 23 2007
Administration, [238]Brittany Sauser, "Tidal Power Comes to Market", July 29 2008, MIT
http://www.eia.doe.gov/cneaf/electricity/epa/figes3.html ,Figure ES 3. Technology Review
Average Capacity Factor by Energy Source
Page 23 of 24](https://image.slidesharecdn.com/multivariateanalysisofenergypolicyoptions-090712120938-phpapp01/75/Multivariate-Analysis-Of-Energy-Policy-Options-Using-Lindo-23-2048.jpg)
![[239]Alliant Energy Company,
http://www.alliantenergy.com/docs/groups/public/documents/pub/p0153
92.hcsp
[240]http://offshorewind.net/OffshoreProjects/Bluewater-wind.html
[241]Statement Of Mary J. Hutzler Acting Administrator Energy Information
Administration Department Of Energy Before The Committee On
Resources U. S. House Of Representatives Hearing On Alternative And
Renewable Energy On Federal Lands, October 3, 2001,
http://www.eia.doe.gov/oiaf/speeches/1003eia.html
Brian D. Bissett (M’94) was born in Endicott, NY in
1968. He received a Masters degree in electrical
engineering (MSEE) from Rensselaer Polytechnic
Institute in Troy, NY in 2001, and an MBA from
Rensselaer Polytechnic Institute in Troy, NY in 1998.
He earned a Bachelors degree in electrical engineering
(BSEE) from the University of Rhode Island in 1992.
He is the author of Practical Pharmaceutical Laboratory Automation, and
Automated Data Analysis Using Excel from CRC Press in 2003, and
Chapman Hall in 2007, respectively. He is a Staff Scientist at Pfizer Global
Research and Development in Groton, CT. Prior to this he was a contract
electrical engineer at the Naval Undersea Warfare Center in New London, CT.
Page 24 of 24](https://image.slidesharecdn.com/multivariateanalysisofenergypolicyoptions-090712120938-phpapp01/75/Multivariate-Analysis-Of-Energy-Policy-Options-Using-Lindo-24-2048.jpg)

The document analyzes energy policy options for the United States, focusing on the predicted decline of fossil fuel production and the implications for energy generation. It highlights the reliance on coal, natural gas, and nuclear power for electricity, while noting the limited contribution of renewable sources. The paper discusses the potential of clean coal technologies and natural gas, as well as the geopolitical challenges related to energy imports and domestic production limitations.


![Coded Agents – with UiPath SDK + LangGraph [Virtual Hands-on Workshop]](https://cdn.slidesharecdn.com/ss_thumbnails/codedagentsdeck-251215155422-5497c599-thumbnail.jpg?width=640&height=640&fit=bounds)