Download to read offline


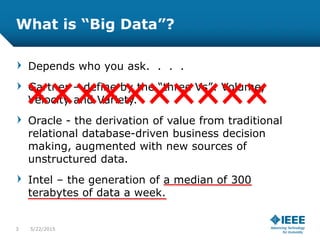
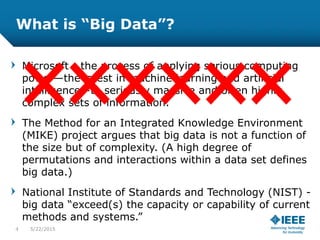
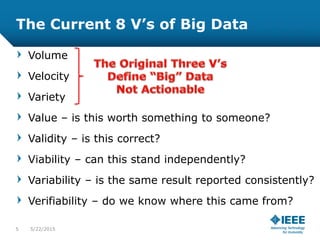


The document discusses the complexity and challenges associated with big data, emphasizing that definitions of 'big data' vary widely among experts. It highlights issues such as data validity, correlations versus causation, and the lack of governance in big data usage while underlining the error rates in data collection and the challenges posed by outliers. The document concludes that while big data holds potential, it also presents significant pitfalls that need to be managed.


![Hacking-Uncovered-How-People-Get-Hacked-and-How-to-Stay-Safe[1].pptx](https://cdn.slidesharecdn.com/ss_thumbnails/hacking-uncovered-how-people-get-hacked-and-how-to-stay-safe1-260130170011-4883a9c7-thumbnail.jpg?width=640&height=640&fit=bounds)


