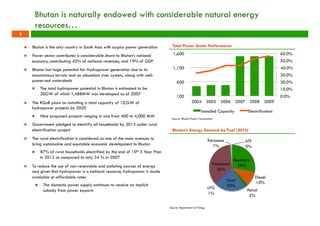
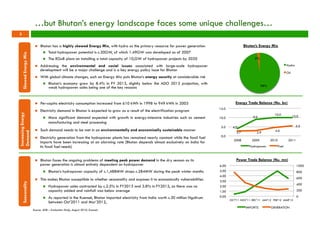
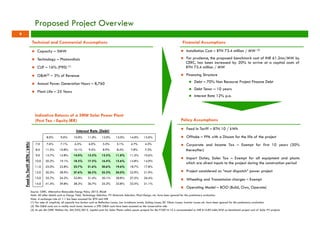
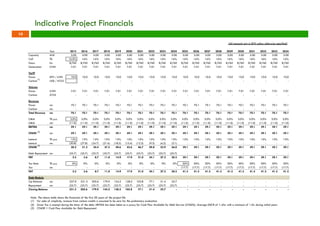
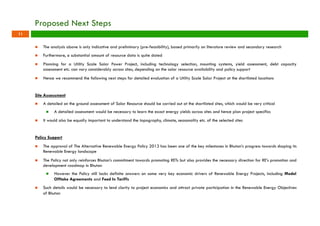
BHUTAN UTILITY SCALE SOLAR POWER 
Preliminary Evaluation – March 2014 
Confidential 
Pre-Feasibility Assessment by: 
Vikas Lakhani 
E: Vikas.lakhani@gmail.com 
M: +91 9818 198919
Summary 
Bhutan’s Energy Challenges 
n Bhutan is very richly endowed with natural energy resources, including hydropower, solar and wind (albeit limited) 
n Bhutan has a highly skewed energy mix, with Hydro forming nearly 98% of its generation capacity, which puts its energy security at 
considerable risk and exposes it to environmental vulnerabilities, such as changes in hydrological regime due to climate change 
n Addressing the environmental and social issues associated with large-scale hydropower development will be a major challenge for Bhutan 
n Bhutan almost entirely depends on India for its fossil fuel needs, demand for which has only increased over the years, while hydropower 
supply has stayed the same 
n Further, due to dry river beds during winter months, Bhutan imports power from India to meet its peak demand 
Potential Energy Development Model 
n Bhutan has shown serious commitment to developing Renewable Energy not only to power its off-grid rural households but also to meet its 
increasing primary demand 
n Any potential technologies / project considered should enable Bhutan to develop a more balanced and optimal energy portfolio; should 
conform to the philosophy of GNH and its objectives; and be scalable to be economically viable and have a meaningful impact on Bhutan’s 
Energy Mix 
n Bhutan has invested considerable resources in developing DDG RE projects to power off-grid rural households, but they have failed to 
create an economically, financially and environmentally sustainable ecosystem for the development of large scale RE projects and hence 
attract private sector participation (Getena Solar Project, Rural Renewable Energy Development Project etc.) 
Potential for Utility Scale Solar Power 
n Bhutan has considerable solar resource for development of Photovoltaic Solar Power Projects 
n However, due to its mountainous terrain, limited grid connectivity, and low population density, very few regions can be considered for a 
utility scale solar power project 
n Our preliminary findings (pre-feasibility study) suggest Sarpang, Samtse, Chukha and Paro to be viable for a 5MW solar power plant, 
which can help Bhutan achieve its target of 5MW solar power capacity by 2025 
n Although, considerable amount of work needs to be done for yield and resource assessment, and finalize policy support such as Model 
Offtake Agreements, Feed In Tariff etc. to better evaluate the feasibility of a Utility Scale Solar Power project in the shortlisted sites 
1
Bhutan is naturally endowed with considerable natural energy 
resources… 
n Bhutan is the only country in South Asia with surplus power generation 
n Power sector contributes a considerable share to Bhutan’s national 
economy, contributing 45% of national revenues, and 19% of GDP 
n Bhutan has huge potential for Hydropower generation due to its 
mountainous terrain and an abundant river system, along with well-preserved 
watersheds 
n The total hydropower potential in Bhutan is estimated to be 
30GW of which 1,488MW was developed as of 2007 
n The RGoB plans on installing a total capacity of 10,GW of 
hydropower projects by 2020 
n Nine proposed projects ranging in size from 400 to 4,000 MW 
n Government pledged to electrify all households by 2013 under rural 
electrification project 
n The rural electrification is considered as one of the main avenues to 
bring sustainable and equitable economic development to Bhutan 
n 87% of rural households electrified by the end of 10th 5 Year Plan 
in 2012 as compared to only 54 % in 2007 
n To reduce the use of non-renewable and polluting sources of energy 
and given that hydropower is a national resource, hydropower is made 
available at affordable rates 
n The domestic power supply continues to receive an implicit 
subsidy from power exports 
Total Power Sector Performance 
1,600 
1,100 
600 
Source: Bhutan Power Corporation. 
Bhutan’s Energy Demand by Fuel (2010) 
Electricity 
28% 
Diesel 
10% 
Petrol 
2% 
Kerosene 
1% 
Fuelwood 
36% 
Coal 
LPG 22% 
1% 
ATF 
0% 
60.0% 
50.0% 
40.0% 
30.0% 
20.0% 
10.0% 
0.0% 
100 
2004 2005 2006 2007 2008 2009 
Installed Capacity Electrification 
Source: Department of Energy 
2
…but Bhutan’s energy landscape faces some unique challenges… 
Bhutan’s Energy Mix 
98% 
2% 
Hydro 
Oil 
n Bhutan has a highly skewed Energy Mix, with hydro as the primary resource for power generation 
n Total hydropower potential is c.30GW, of which 1.49GW was developed as of 2007 
n The RGoB plans on installing a total capacity of 10,GW of hydropower projects by 2020 
n Addressing the environmental and social issues associated with large-scale hydropower 
development will be a major challenge and is a key energy policy issue for Bhutan 
n With global climate changes, such an Energy Mix puts Bhutan’s energy security at considerable risk 
n Bhutan’s economy grew by 8.4% in FY 2013, slightly below the ADO 2013 projection, with 
weak hydropower sales being one of the key reasons 
Skewed Energy Mix 
n Per-capita electricity consumption increased from 610 kWh in 1998 to 949 kWh in 2003 
n Electricity demand in Bhutan is expected to grow as a result of the electrification program 
n More significant demand expected with growth in energy-intensive industries such as cement 
manufacturing and steel processing 
n Such demand needs to be met in an environmentally and economically sustainable manner 
n Electricity generation from the hydropower plants has remained nearly constant while the fossil fuel 
imports have been increasing at an alarming rate (Bhutan depends almost exclusively on India for 
its fossil fuel needs) 
Increasing Energy 
Demand 
n Bhutan faces the ongoing problems of meeting peak power demand in the dry season as its 
power generation is almost entirely dependent on hydropower 
n Bhutan’s hydropower capacity of c.1,488MW drops c.284MW during the peak winter months 
n This makes Bhutan susceptible to whether seasonality and exposes it to economically vulnerabilities 
between Oct’2011 and Mar’2012, Seasonality 
n Hydropower sales contracted by c.2.5% in FY2013 and 3.8% in FY2012, as there was no 
capacity added and rainfall was below average 
n As reported in the Kuensel, Bhutan imported electricity from India worth c.30 million Ngultrum 
Energy Trade Balance (Nu. bn) 
4.0 
9.0 
10.0 10.0 
2.7 2.9 4.6 
5.5 
15.0 
10.0 
5.0 
0.0 
2008 2009 2010 2011 
Hydropower Fuel 
1000 
800 
600 
400 
200 
0 
6.00 
5.00 
4.00 
3.00 
2.00 
1.00 
0.00 
Power Trade Balance (Nu. mn) 
OCT'11 NOV'11 DEC'11 JAN'12 FEB'12 MAR'12 
IMPORTS GENERATION 
Source: ADB – Evaluation Study, August 2010; Kuensel, 
3
…as voiced by a number of experts 
“…such a situation might lead to a scenario called “Dutch Disease” in 
classic economic parlance. Concentrated investment in a single sector may 
create a distortion in the other viable economic options which is reminiscent 
of Bhutan’s dependence on the hydropower resource…” 
Integrated Energy Master Plan – DOE (2010) 
“The availability of hydropower is seasonal and Bhutan is experiencing 
difficulties in meeting its domestic power demand during winter. Hence, an 
adequate level of firm power capacity must be developed through several 
hydropower projects, with storage to minimize power shortages during 
winter. Another option is to develop non-hydro forms of renewable energy 
(such as wind power) to complement hydropower and diversify the 
country’s energy mix to reduce over-dependency on hydropower and 
mitigate the hydrology risk” 
Bhutan: Energy Sector (Evaluation Study – 2010) by ADB 
“Seasonal variability in hydropower generation has meant that the country 
has surplus power in summer but power shortages in winter. This variability 
may worsen in the future as a result of climate change and impact the 
hydropower plants which are by design run-of-the-river type and 
dependent on natural river flows.” 
Bhutan: In Pursuit of Sustainable Development 
National Report For The United Nations Conference On Sustainable 
Development 2012 
“While hydropower development shall be one of the main thrust of 
government; an integrated approach shall be pursued to meet different 
energy needs in the most efficient manner. A National Renewable Energy 
Policy shall be adopted within the 10th Five Year Plan” 
EDP 2010 
“Clean technologies, in general, do not come cheap. For Bhutan, where 
there is already a diseconomy of scale and competitive economic 
disadvantages, the additional cost associated with clean technology is a 
major deterrent for the private and public enterprises. While the country is 
doing well in terms of developing and implementing technologies for 
production of clean energy, it has very limited expertise and financial 
resources to access and implement clean technology in industrial 
production, which generally involves high capital investments” 
Bhutan: In Pursuit of Sustainable Development 
National Report For The United Nations Conference On Sustainable 
Development 2012 
4
The choice of RE technologies for future generation capacity should provide a 
holistic solution… 
Energy Mix 
n Bhutan needs to assess the viability of 
technologies that help it achieve a 
more balanced Energy Mix 
n An Energy Mix that almost exclusively 
depends on Hydropower, or any single 
technology, puts Bhutan’s energy 
security at considerable risk 
n Bhutan’s has substantial natural 
resource for Mini-Hydro, Solar and 
Waste To Energy 
n New technologies to be deployed also 
need to optimally utilize the country’s 
all natural energy sources 
n Such energy resources also need to 
be used to achieve an optimal 
Energy Mix 
Scale 
Sustainability 
n Bhutan has one of the ric hest 
biodiversities in the world and has 
been a net carbon sink 
n The constitution of the Kingdom 
further mandates a forest cover of 
at least 60% 
n Any new new capacity should not only 
be carbon neutral, but should also not 
cause much ecological disruption, as in 
the case of large hydropower 
n Potential solutions should fit in well with 
the idea of Green Economy as defined 
by the UNEP and the vision of Economic 
Development Policy (EDP) of Bhutan 
(2010) of “promoting a green and self-reliant 
economy sustained by an IT-enabled 
knowledge society guided by 
the GNH philosophy” 
n To be able achieve a long term sustainable solution to the 
energy challenges of Bhutan, the RE technologies need to be 
scalable 
n Due to the limited scale of distributed generation projects, such 
projects have had little impact on the nation’s energy mix, and 
have failed to attract the attention of private investors 
n So far most of the initiatives in Renewable Energy have been 
taken in the DDG to power off-grid rural households 
n Such projects have not only faced considerable operational 
challenges, but have also failed to be a long term 
economically and financially viable alternative to large 
hydropower projects (example such as Getena Solar Project, 
Barefoot College Model etc.) 
5
…Utility Scale Solar Power promises to be a potential solution 
n The comparison below shows the feasibility of various Renewable Energy Technologies 
n The comparison shows viability of different technologies on the parameters defined in the previous slide (Slide 5) 
n The comparison is done in the context of Bhutan and its economic and environmental resources and constraints 
Technology / Feasibility 
Criteria 
Utility Scale 
Hydropower 
Mini Hydro DDG 
Solar 
Utility Scale 
Solar 
Wind Power Waste to 
Energy 
Balanced 
Optimal 
Carbon Neutral 
Ecology 
Economics 
Impact 
Good Poor 
Scalable Sustainability Energy Mix 
Note: The analysis also considers the feasibility of the technology based on efficiency, intermittency and potential development of new technologies which may help in reaching grid parity in the context 
of Bhutan 
6
Potential Areas for Utility Scale Solar Power… 
Technical Assessment Criteria 
n Technology – Photovoltaic (1) 
n Land Slope – Less than 5% 
n Photovoltaic Density – 44MW / KM2 
n Proximity to power grid – Less than or equal to 5KM 
n Array conversion efficiency – 10% 
n Derating Factor – 77% 
n Annual Production Hours – 8,760 
n Preliminary findings, based primarily on literature review and secondary 
research, suggest the following areas have substantial potential for 
development of utility scale solar power generation 
n Furthermore, a Utility Scale Solar power generation in the above regions would 
meet all the criteria described on Slide 5 
Estimated Photovoltaic Production Potential for Utility Scale (>1MW) 
Province 
Area 
Availale 
for 
Development 
(KM2) 
Annual 
Tilt 
Resource 
Range 
(KWh 
/ 
m2 
/ 
day) 
Average 
Annual 
Tilt 
Resource 
Range 
(KWh 
/ 
m2 
/ 
day) 
Development 
Capacity 
(MWDC) 
Preliminary Findings 
n Southern Sarpang 
n Southwest Samtse 
n Southeast Paro 
n Northern Chukha 
Av. 
Annual 
ProducCon 
(million 
kWhAC 
/ 
yr) 
PopulaCon 
(2010P) 
PopulaCon 
Density 
(inh 
/ 
Km2) 
Source: (2005) Office of the Census Commissioner, RGoB; Potential for Development of Solar and Wind Resource in Bhutan – NREL Technical Report, September 2009 
(1) Bhutan does not have sufficient solar resource for Concentrating Solar Power (CSP) technology 
Proximity 
to 
Transmission 
Lines 
Connected 
to 
Main 
Road 
Network 
Chukha 
3.26 
4.5 
-­‐ 
4.9 
4.85 
143 
444 
81,400 
47.1 
YES 
YES 
Haa 
1.05 
5.2 
-­‐ 
5.4 
5.29 
46 
156 
12,600 
7.6 
YES 
YES 
Lhuntse 
0.02 
4.7 
-­‐ 
4.7 
4.71 
1 
3 
16,500 
6.0 
YES 
YES 
Mongar 
0.41 
4.6 
-­‐ 
5.2 
4.83 
18 
56 
40,700 
21.6 
YES 
YES 
Paro 
7.82 
5.3 
-­‐ 
5.5 
5.38 
344 
1,183 
39,800 
32.4 
YES 
YES 
Pemagatshel 
0.25 
4.9 
-­‐ 
5.2 
5.00 
11 
35 
23,800 
47.7 
YES 
YES 
Punakha 
0.61 
4.8 
-­‐ 
5.1 
5.10 
27 
87 
25,700 
27.9 
YES 
YES 
Samtse 
8.32 
4.8 
-­‐ 
4.9 
4.88 
366 
1,142 
65,400 
43.7 
YES 
YES 
Sarpang 
43.45 
4.6 
-­‐ 
5.0 
4.88 
1,912 
5,955 
41,300 
18.9 
YES 
YES 
Thimpu 
0.92 
5.1 
-­‐ 
5.4 
5.34 
40 
137 
1,04,200 
56.5 
YES 
YES 
Wandue 
Phodrang 
0.32 
4.5 
-­‐ 
5.4 
4.93 
14 
45 
34,300 
8.8 
YES 
YES 
Zhemgang 
0.47 
4.9 
-­‐ 
5.1 
5.00 
20 
65 
20,100 
9.9 
YES 
YES 
66.90 
2,947 
9,319 
7
Potential Areas for Utility Scale Solar Power (cont’d) 
Annual Average Global Solar Radiation at Latitude Tilt Electricity Transmission Network Map 
Note: Location of transmission lines shown as dotted lines 
Population Density Map National Protected Areas and Biological Corridors 
Source: (2005) Office of the Census Commissioner, RGoB; Potential for Development of Solar and Wind Resource in Bhutan – NREL Technical Report, September 2009 
8
Proposed Project Overview 
Financial Assumptions 
Technical and Commercial Assumptions 
n Capacity – 5MW 
n Technology – Photovoltaic 
n CUF – 16% (P90) (1) 
n O&M(2) – 3% of Revenue 
n Annual Power Generation Hours – 8,760 
n Plant Life – 25 Years 
n Installation Cost – BTN 73.4 million / MW (3) 
n For prudence, the proposed benchmark cost of INR 61.2mn/MW by 
CERC, has been increased by 20% to arrive at a capital costs of 
BTN 73.4 million / MW 
n Financing Structure 
n Debt – 70% Non Recourse Project Finance Debt 
n Debt Tenor – 10 years 
n Interest Rate 12% p.a. 
Indicative Returns of a 5MW Solar Power Plant 
(Post Tax - Equity IRR) 
Interest Rate (Debt) 
Source: CERC, Alternative Renewable Energy Policy 2013, RGoB 
Note: All other details such as Energy Yield, Technology Selection, PV Materials Selection, Plant Design, etc. have been ignored for this preliminary evaluation 
Note: A exchange rate of 1:1 has been assumed for BTN and INR 
(1) For sake of simplicity, all capacity loss factors such as Reflection Losses, Low Irradiance Levels, Soiling Losses, DC Ohmic Losses, Inverter Losses etc. have been ignored for this preliminary evaluation 
(2) The O&M costs are in reality much lower, however a 3% O&M costs have been assumed on the conservative side 
(3) As per the CERC Petition No. SM/353/2013, capital costs for Solar Photo voltaic power projects for the FY2014-15 is recommended as INR 612.00 Lakh/MW as benchmark project cost of Solar PV projects 
Feed In Tariff (BTN / kWh) 
Policy Assumptions 
n Feed In Tariff – BTN 10 / kWh 
n Offtake – PPA with a Discom for the life of the project 
n Corporate and Income Tax – Exempt for first 10 years (30% 
thereafter) 
n Import Duties, Sales Tax – Exempt for all equipment and plants 
which are direct inputs to the project during the construction period 
n Project considered as “must dispatch” power project 
n Wheeling and Transmission charges – Exempt 
n Operating Model – BOO (Build, Own, Operate) 
#### 8.0% 9.0% 10.0% 11.0% 12.0% 13.0% 14.0% 15.0% 
7.0 7.6% 7.1% 6.5% 6.0% 5.5% 5.1% 4.7% 4.3% 
8.0 11.5% 10.8% 10.1% 9.5% 8.9% 8.4% 7.8% 7.3% 
9.0 15.7% 14.8% 14.0% 13.2% 12.5% 11.8% 11.2% 10.6% 
10.0 20.2% 19.1% 18.2% 17.2% 16.4% 15.6% 14.8% 14.0% 
11.0 25.0% 23.8% 22.7% 21.6% 20.6% 19.6% 18.7% 17.8% 
12.0 30.3% 28.9% 27.6% 26.3% 25.2% 24.0% 22.9% 21.9% 
13.0 35.7% 34.2% 32.8% 31.4% 30.1% 28.8% 27.5% 26.4% 
14.0 41.4% 39.8% 38.2% 36.7% 35.2% 33.8% 32.5% 31.1% 
9
Indicative Project Financials 
(All amounts are in BTN unless otherwise specified) 
Year 2015 2016 2017 2018 2019 2020 2021 2022 2023 2024 2025 2026 2027 2028 2029 2030 2031 2032 2033 2034 
Capacity MW 5.00 5.00 5.00 5.00 5.00 5.00 5.00 5.00 5.00 5.00 5.00 5.00 5.00 5.00 5.00 5.00 5.00 5.00 5.00 5.00 
CUF % 16.0% 16% 16% 16% 16% 16% 16% 16% 16% 16% 16% 16% 16% 16% 16% 16% 16% 16% 16% 16% 
Hours hrs 8,760 8,760 8,760 8,760 8,760 8,760 8,760 8,760 8,760 8,760 8,760 8,760 8,760 8,760 8,760 8,760 8,760 8,760 8,760 8,760 
Generation GWh 7.01 7.01 7.01 7.01 7.01 7.01 7.01 7.01 7.01 7.01 7.01 7.01 7.01 7.01 7.01 7.01 7.01 7.01 7.01 7.01 
Tariff 
Power BTN / kWh 10.0 10.0 10.0 10.0 10.0 10.0 10.0 10.0 10.0 10.0 10.0 10.0 10.0 10.0 10.0 10.0 10.0 10.0 10.0 10.0 
Carbon (1) 
US$ / tCO2 - - - - - - - - - - - - - - - - - - - - 
Volume 
Power GWh 7.01 7.01 7.01 7.01 7.01 7.01 7.01 7.01 7.01 7.01 7.01 7.01 7.01 7.01 7.01 7.01 7.01 7.01 7.01 7.01 
Carbon tCO2 - - - - - - - - - - - - - - - - - - - - 
Revenue 
Power mn 70.1 70.1 70.1 70.1 70.1 70.1 70.1 70.1 70.1 70.1 70.1 70.1 70.1 70.1 70.1 70.1 70.1 70.1 70.1 70.1 
Carbon mn - - - - - - - - - - - - - - - - - - - - 
Total Revenue mn 70.1 70.1 70.1 70.1 70.1 70.1 70.1 70.1 70.1 70.1 70.1 70.1 70.1 70.1 70.1 70.1 70.1 70.1 70.1 70.1 
O&M % p.a. 3.0% 3.0% 3.0% 3.0% 3.0% 3.0% 3.0% 3.0% 3.0% 3.0% 3.0% 3.0% 3.0% 3.0% 3.0% 3.0% 3.0% 3.0% 3.0% 3.0% 
O&M mil (11.0) (11.0) (11.0) (11.0) (11.0) (11.0) (11.0) (11.0) (11.0) (11.0) (11.0) (11.0) (11.0) (11.0) (11.0) (11.0) (11.0) (11.0) (11.0) (11.0) 
EBITDA mn 59.1 59.1 59.1 59.1 59.1 59.1 59.1 59.1 59.1 59.1 59.1 59.1 59.1 59.1 59.1 59.1 59.1 59.1 59.1 59.1 
CFADS (2) 
mn 59.1 59.1 59.1 59.1 59.1 59.1 59.1 59.1 59.1 59.1 59.1 59.1 59.1 59.1 59.1 59.1 59.1 59.1 59.1 59.1 
Ineterst % p.a. 12% 12% 12% 12% 12% 12% 12% 12% 12% 12% 12% 12% 12% 12% 12% 12% 12% 12% 12% 12% 
Ineterst mn (30.8) (27.8) (24.7) (21.6) (18.5) (15.4) (12.3) (9.3) (6.2) (3.1) - - - - - - - - - - 
CFADR (3) 
28.2 31.3 34.4 37.5 40.6 43.6 46.7 49.8 52.9 56.0 59.1 59.1 59.1 59.1 59.1 59.1 59.1 59.1 59.1 59.1 
Debt Repayment mn (25.7) (25.7) (25.7) (25.7) (25.7) (25.7) (25.7) (25.7) (25.7) (25.7) - - - - - - - - - - 
PBT 2.5 5.6 8.7 11.8 14.9 17.9 21.0 24.1 27.2 30.3 59.1 59.1 59.1 59.1 59.1 59.1 59.1 59.1 59.1 59.1 
Tax Rate % p.a. 0% 0% 0% 0% 0% 0% 0% 0% 0% 0% 30% 30% 30% 30% 30% 30% 30% 30% 30% 30% 
Tax mn - - - - - - - - - - (17.7) (17.7) (17.7) (17.7) (17.7) (17.7) (17.7) (17.7) (17.7) (17.7) 
PAT 2.5 5.6 8.7 11.8 14.9 17.9 21.0 24.1 27.2 30.3 41.3 41.3 41.3 41.3 41.3 41.3 41.3 41.3 41.3 41.3 
Debt Module 
Op Balance mn 257.0 231.3 205.6 179.9 154.2 128.5 102.8 77.1 51.4 25.7 - - - - - - - - - - 
Repayment mn (25.7) (25.7) (25.7) (25.7) (25.7) (25.7) (25.7) (25.7) (25.7) (25.7) - - - - - - - - - - 
Closing Balance 231.3 205.6 179.9 154.2 128.5 102.8 77.1 51.4 25.7 - - - - - - - - - - - 
Note: The above table shows the financials of the first 20 years of the project life 
(1) For sake of simplicity, revenue from carbon credits is assumed to be zero for the preliminary evaluation 
(2) Given Tax is exempt during the tenor of the debt, EBITDA has been taken as a proxy for Cash Flow Available for Debt Service (CFADS); Average DSCR of 1.45x with a minimum of 1.0x during initial years 
(3) CFADR = Cash Flow Available for Debt Repayment 
10
Proposed Next Steps 
n The analysis above is only indicative and preliminary (pre-feasibility), based primarily on literature review and secondary research 
n Furthermore, a substantial amount of resource data is quite dated 
n Planning for a Utility Scale Solar Power Project, including technology selection, mounting systems, yield assessment, debt capacity 
assessment etc. can vary considerably across sites, depending on the solar resource availability and policy support 
n Hence we recommend the following next steps for detailed evaluation of a Utility Scale Solar Project at the shortlisted locations 
Site Assessment 
n A detailed on the ground assessment of Solar Resource should be carried out at the shortlisted sites, which would be very critical 
n A detailed assessment would be necessary to learn the exact energy yields across sites and hence plan project specifics 
n It would also be equally important to understand the topography, climate, seasonality etc. of the selected sites 
Policy Support 
n The approval of The Alternative Renewable Energy Policy 2013 has been one of the key milestones in Bhutan’s progress towards shaping its 
Renewable Energy landscape 
n The Policy not only reinforces Bhutan’s commitment towards promoting RETs but also provides the necessary direction for RE’s promotion and 
development roadmap in Bhutan 
n However the Policy still lacks definite answers on some very key economic drivers of Renewable Energy Projects, including Model 
Offtake Agreements and Feed In Tariffs 
n Such details would be necessary to lend clarity to project economics and attract private participation in the Renewable Energy Objectives 
of Bhutan 
11

Bhutan - Utility Scale Solar Power Assessment

  • 1.
    BHUTAN UTILITY SCALESOLAR POWER Preliminary Evaluation – March 2014 Confidential Pre-Feasibility Assessment by: Vikas Lakhani E: Vikas.lakhani@gmail.com M: +91 9818 198919
  • 2.
    Summary Bhutan’s EnergyChallenges n Bhutan is very richly endowed with natural energy resources, including hydropower, solar and wind (albeit limited) n Bhutan has a highly skewed energy mix, with Hydro forming nearly 98% of its generation capacity, which puts its energy security at considerable risk and exposes it to environmental vulnerabilities, such as changes in hydrological regime due to climate change n Addressing the environmental and social issues associated with large-scale hydropower development will be a major challenge for Bhutan n Bhutan almost entirely depends on India for its fossil fuel needs, demand for which has only increased over the years, while hydropower supply has stayed the same n Further, due to dry river beds during winter months, Bhutan imports power from India to meet its peak demand Potential Energy Development Model n Bhutan has shown serious commitment to developing Renewable Energy not only to power its off-grid rural households but also to meet its increasing primary demand n Any potential technologies / project considered should enable Bhutan to develop a more balanced and optimal energy portfolio; should conform to the philosophy of GNH and its objectives; and be scalable to be economically viable and have a meaningful impact on Bhutan’s Energy Mix n Bhutan has invested considerable resources in developing DDG RE projects to power off-grid rural households, but they have failed to create an economically, financially and environmentally sustainable ecosystem for the development of large scale RE projects and hence attract private sector participation (Getena Solar Project, Rural Renewable Energy Development Project etc.) Potential for Utility Scale Solar Power n Bhutan has considerable solar resource for development of Photovoltaic Solar Power Projects n However, due to its mountainous terrain, limited grid connectivity, and low population density, very few regions can be considered for a utility scale solar power project n Our preliminary findings (pre-feasibility study) suggest Sarpang, Samtse, Chukha and Paro to be viable for a 5MW solar power plant, which can help Bhutan achieve its target of 5MW solar power capacity by 2025 n Although, considerable amount of work needs to be done for yield and resource assessment, and finalize policy support such as Model Offtake Agreements, Feed In Tariff etc. to better evaluate the feasibility of a Utility Scale Solar Power project in the shortlisted sites 1
  • 3.
    Bhutan is naturallyendowed with considerable natural energy resources… n Bhutan is the only country in South Asia with surplus power generation n Power sector contributes a considerable share to Bhutan’s national economy, contributing 45% of national revenues, and 19% of GDP n Bhutan has huge potential for Hydropower generation due to its mountainous terrain and an abundant river system, along with well-preserved watersheds n The total hydropower potential in Bhutan is estimated to be 30GW of which 1,488MW was developed as of 2007 n The RGoB plans on installing a total capacity of 10,GW of hydropower projects by 2020 n Nine proposed projects ranging in size from 400 to 4,000 MW n Government pledged to electrify all households by 2013 under rural electrification project n The rural electrification is considered as one of the main avenues to bring sustainable and equitable economic development to Bhutan n 87% of rural households electrified by the end of 10th 5 Year Plan in 2012 as compared to only 54 % in 2007 n To reduce the use of non-renewable and polluting sources of energy and given that hydropower is a national resource, hydropower is made available at affordable rates n The domestic power supply continues to receive an implicit subsidy from power exports Total Power Sector Performance 1,600 1,100 600 Source: Bhutan Power Corporation. Bhutan’s Energy Demand by Fuel (2010) Electricity 28% Diesel 10% Petrol 2% Kerosene 1% Fuelwood 36% Coal LPG 22% 1% ATF 0% 60.0% 50.0% 40.0% 30.0% 20.0% 10.0% 0.0% 100 2004 2005 2006 2007 2008 2009 Installed Capacity Electrification Source: Department of Energy 2
  • 4.
    …but Bhutan’s energylandscape faces some unique challenges… Bhutan’s Energy Mix 98% 2% Hydro Oil n Bhutan has a highly skewed Energy Mix, with hydro as the primary resource for power generation n Total hydropower potential is c.30GW, of which 1.49GW was developed as of 2007 n The RGoB plans on installing a total capacity of 10,GW of hydropower projects by 2020 n Addressing the environmental and social issues associated with large-scale hydropower development will be a major challenge and is a key energy policy issue for Bhutan n With global climate changes, such an Energy Mix puts Bhutan’s energy security at considerable risk n Bhutan’s economy grew by 8.4% in FY 2013, slightly below the ADO 2013 projection, with weak hydropower sales being one of the key reasons Skewed Energy Mix n Per-capita electricity consumption increased from 610 kWh in 1998 to 949 kWh in 2003 n Electricity demand in Bhutan is expected to grow as a result of the electrification program n More significant demand expected with growth in energy-intensive industries such as cement manufacturing and steel processing n Such demand needs to be met in an environmentally and economically sustainable manner n Electricity generation from the hydropower plants has remained nearly constant while the fossil fuel imports have been increasing at an alarming rate (Bhutan depends almost exclusively on India for its fossil fuel needs) Increasing Energy Demand n Bhutan faces the ongoing problems of meeting peak power demand in the dry season as its power generation is almost entirely dependent on hydropower n Bhutan’s hydropower capacity of c.1,488MW drops c.284MW during the peak winter months n This makes Bhutan susceptible to whether seasonality and exposes it to economically vulnerabilities between Oct’2011 and Mar’2012, Seasonality n Hydropower sales contracted by c.2.5% in FY2013 and 3.8% in FY2012, as there was no capacity added and rainfall was below average n As reported in the Kuensel, Bhutan imported electricity from India worth c.30 million Ngultrum Energy Trade Balance (Nu. bn) 4.0 9.0 10.0 10.0 2.7 2.9 4.6 5.5 15.0 10.0 5.0 0.0 2008 2009 2010 2011 Hydropower Fuel 1000 800 600 400 200 0 6.00 5.00 4.00 3.00 2.00 1.00 0.00 Power Trade Balance (Nu. mn) OCT'11 NOV'11 DEC'11 JAN'12 FEB'12 MAR'12 IMPORTS GENERATION Source: ADB – Evaluation Study, August 2010; Kuensel, 3
  • 5.
    …as voiced bya number of experts “…such a situation might lead to a scenario called “Dutch Disease” in classic economic parlance. Concentrated investment in a single sector may create a distortion in the other viable economic options which is reminiscent of Bhutan’s dependence on the hydropower resource…” Integrated Energy Master Plan – DOE (2010) “The availability of hydropower is seasonal and Bhutan is experiencing difficulties in meeting its domestic power demand during winter. Hence, an adequate level of firm power capacity must be developed through several hydropower projects, with storage to minimize power shortages during winter. Another option is to develop non-hydro forms of renewable energy (such as wind power) to complement hydropower and diversify the country’s energy mix to reduce over-dependency on hydropower and mitigate the hydrology risk” Bhutan: Energy Sector (Evaluation Study – 2010) by ADB “Seasonal variability in hydropower generation has meant that the country has surplus power in summer but power shortages in winter. This variability may worsen in the future as a result of climate change and impact the hydropower plants which are by design run-of-the-river type and dependent on natural river flows.” Bhutan: In Pursuit of Sustainable Development National Report For The United Nations Conference On Sustainable Development 2012 “While hydropower development shall be one of the main thrust of government; an integrated approach shall be pursued to meet different energy needs in the most efficient manner. A National Renewable Energy Policy shall be adopted within the 10th Five Year Plan” EDP 2010 “Clean technologies, in general, do not come cheap. For Bhutan, where there is already a diseconomy of scale and competitive economic disadvantages, the additional cost associated with clean technology is a major deterrent for the private and public enterprises. While the country is doing well in terms of developing and implementing technologies for production of clean energy, it has very limited expertise and financial resources to access and implement clean technology in industrial production, which generally involves high capital investments” Bhutan: In Pursuit of Sustainable Development National Report For The United Nations Conference On Sustainable Development 2012 4
  • 6.
    The choice ofRE technologies for future generation capacity should provide a holistic solution… Energy Mix n Bhutan needs to assess the viability of technologies that help it achieve a more balanced Energy Mix n An Energy Mix that almost exclusively depends on Hydropower, or any single technology, puts Bhutan’s energy security at considerable risk n Bhutan’s has substantial natural resource for Mini-Hydro, Solar and Waste To Energy n New technologies to be deployed also need to optimally utilize the country’s all natural energy sources n Such energy resources also need to be used to achieve an optimal Energy Mix Scale Sustainability n Bhutan has one of the ric hest biodiversities in the world and has been a net carbon sink n The constitution of the Kingdom further mandates a forest cover of at least 60% n Any new new capacity should not only be carbon neutral, but should also not cause much ecological disruption, as in the case of large hydropower n Potential solutions should fit in well with the idea of Green Economy as defined by the UNEP and the vision of Economic Development Policy (EDP) of Bhutan (2010) of “promoting a green and self-reliant economy sustained by an IT-enabled knowledge society guided by the GNH philosophy” n To be able achieve a long term sustainable solution to the energy challenges of Bhutan, the RE technologies need to be scalable n Due to the limited scale of distributed generation projects, such projects have had little impact on the nation’s energy mix, and have failed to attract the attention of private investors n So far most of the initiatives in Renewable Energy have been taken in the DDG to power off-grid rural households n Such projects have not only faced considerable operational challenges, but have also failed to be a long term economically and financially viable alternative to large hydropower projects (example such as Getena Solar Project, Barefoot College Model etc.) 5
  • 7.
    …Utility Scale SolarPower promises to be a potential solution n The comparison below shows the feasibility of various Renewable Energy Technologies n The comparison shows viability of different technologies on the parameters defined in the previous slide (Slide 5) n The comparison is done in the context of Bhutan and its economic and environmental resources and constraints Technology / Feasibility Criteria Utility Scale Hydropower Mini Hydro DDG Solar Utility Scale Solar Wind Power Waste to Energy Balanced Optimal Carbon Neutral Ecology Economics Impact Good Poor Scalable Sustainability Energy Mix Note: The analysis also considers the feasibility of the technology based on efficiency, intermittency and potential development of new technologies which may help in reaching grid parity in the context of Bhutan 6
  • 8.
    Potential Areas forUtility Scale Solar Power… Technical Assessment Criteria n Technology – Photovoltaic (1) n Land Slope – Less than 5% n Photovoltaic Density – 44MW / KM2 n Proximity to power grid – Less than or equal to 5KM n Array conversion efficiency – 10% n Derating Factor – 77% n Annual Production Hours – 8,760 n Preliminary findings, based primarily on literature review and secondary research, suggest the following areas have substantial potential for development of utility scale solar power generation n Furthermore, a Utility Scale Solar power generation in the above regions would meet all the criteria described on Slide 5 Estimated Photovoltaic Production Potential for Utility Scale (>1MW) Province Area Availale for Development (KM2) Annual Tilt Resource Range (KWh / m2 / day) Average Annual Tilt Resource Range (KWh / m2 / day) Development Capacity (MWDC) Preliminary Findings n Southern Sarpang n Southwest Samtse n Southeast Paro n Northern Chukha Av. Annual ProducCon (million kWhAC / yr) PopulaCon (2010P) PopulaCon Density (inh / Km2) Source: (2005) Office of the Census Commissioner, RGoB; Potential for Development of Solar and Wind Resource in Bhutan – NREL Technical Report, September 2009 (1) Bhutan does not have sufficient solar resource for Concentrating Solar Power (CSP) technology Proximity to Transmission Lines Connected to Main Road Network Chukha 3.26 4.5 -­‐ 4.9 4.85 143 444 81,400 47.1 YES YES Haa 1.05 5.2 -­‐ 5.4 5.29 46 156 12,600 7.6 YES YES Lhuntse 0.02 4.7 -­‐ 4.7 4.71 1 3 16,500 6.0 YES YES Mongar 0.41 4.6 -­‐ 5.2 4.83 18 56 40,700 21.6 YES YES Paro 7.82 5.3 -­‐ 5.5 5.38 344 1,183 39,800 32.4 YES YES Pemagatshel 0.25 4.9 -­‐ 5.2 5.00 11 35 23,800 47.7 YES YES Punakha 0.61 4.8 -­‐ 5.1 5.10 27 87 25,700 27.9 YES YES Samtse 8.32 4.8 -­‐ 4.9 4.88 366 1,142 65,400 43.7 YES YES Sarpang 43.45 4.6 -­‐ 5.0 4.88 1,912 5,955 41,300 18.9 YES YES Thimpu 0.92 5.1 -­‐ 5.4 5.34 40 137 1,04,200 56.5 YES YES Wandue Phodrang 0.32 4.5 -­‐ 5.4 4.93 14 45 34,300 8.8 YES YES Zhemgang 0.47 4.9 -­‐ 5.1 5.00 20 65 20,100 9.9 YES YES 66.90 2,947 9,319 7
  • 9.
    Potential Areas forUtility Scale Solar Power (cont’d) Annual Average Global Solar Radiation at Latitude Tilt Electricity Transmission Network Map Note: Location of transmission lines shown as dotted lines Population Density Map National Protected Areas and Biological Corridors Source: (2005) Office of the Census Commissioner, RGoB; Potential for Development of Solar and Wind Resource in Bhutan – NREL Technical Report, September 2009 8
  • 10.
    Proposed Project Overview Financial Assumptions Technical and Commercial Assumptions n Capacity – 5MW n Technology – Photovoltaic n CUF – 16% (P90) (1) n O&M(2) – 3% of Revenue n Annual Power Generation Hours – 8,760 n Plant Life – 25 Years n Installation Cost – BTN 73.4 million / MW (3) n For prudence, the proposed benchmark cost of INR 61.2mn/MW by CERC, has been increased by 20% to arrive at a capital costs of BTN 73.4 million / MW n Financing Structure n Debt – 70% Non Recourse Project Finance Debt n Debt Tenor – 10 years n Interest Rate 12% p.a. Indicative Returns of a 5MW Solar Power Plant (Post Tax - Equity IRR) Interest Rate (Debt) Source: CERC, Alternative Renewable Energy Policy 2013, RGoB Note: All other details such as Energy Yield, Technology Selection, PV Materials Selection, Plant Design, etc. have been ignored for this preliminary evaluation Note: A exchange rate of 1:1 has been assumed for BTN and INR (1) For sake of simplicity, all capacity loss factors such as Reflection Losses, Low Irradiance Levels, Soiling Losses, DC Ohmic Losses, Inverter Losses etc. have been ignored for this preliminary evaluation (2) The O&M costs are in reality much lower, however a 3% O&M costs have been assumed on the conservative side (3) As per the CERC Petition No. SM/353/2013, capital costs for Solar Photo voltaic power projects for the FY2014-15 is recommended as INR 612.00 Lakh/MW as benchmark project cost of Solar PV projects Feed In Tariff (BTN / kWh) Policy Assumptions n Feed In Tariff – BTN 10 / kWh n Offtake – PPA with a Discom for the life of the project n Corporate and Income Tax – Exempt for first 10 years (30% thereafter) n Import Duties, Sales Tax – Exempt for all equipment and plants which are direct inputs to the project during the construction period n Project considered as “must dispatch” power project n Wheeling and Transmission charges – Exempt n Operating Model – BOO (Build, Own, Operate) #### 8.0% 9.0% 10.0% 11.0% 12.0% 13.0% 14.0% 15.0% 7.0 7.6% 7.1% 6.5% 6.0% 5.5% 5.1% 4.7% 4.3% 8.0 11.5% 10.8% 10.1% 9.5% 8.9% 8.4% 7.8% 7.3% 9.0 15.7% 14.8% 14.0% 13.2% 12.5% 11.8% 11.2% 10.6% 10.0 20.2% 19.1% 18.2% 17.2% 16.4% 15.6% 14.8% 14.0% 11.0 25.0% 23.8% 22.7% 21.6% 20.6% 19.6% 18.7% 17.8% 12.0 30.3% 28.9% 27.6% 26.3% 25.2% 24.0% 22.9% 21.9% 13.0 35.7% 34.2% 32.8% 31.4% 30.1% 28.8% 27.5% 26.4% 14.0 41.4% 39.8% 38.2% 36.7% 35.2% 33.8% 32.5% 31.1% 9
  • 11.
    Indicative Project Financials (All amounts are in BTN unless otherwise specified) Year 2015 2016 2017 2018 2019 2020 2021 2022 2023 2024 2025 2026 2027 2028 2029 2030 2031 2032 2033 2034 Capacity MW 5.00 5.00 5.00 5.00 5.00 5.00 5.00 5.00 5.00 5.00 5.00 5.00 5.00 5.00 5.00 5.00 5.00 5.00 5.00 5.00 CUF % 16.0% 16% 16% 16% 16% 16% 16% 16% 16% 16% 16% 16% 16% 16% 16% 16% 16% 16% 16% 16% Hours hrs 8,760 8,760 8,760 8,760 8,760 8,760 8,760 8,760 8,760 8,760 8,760 8,760 8,760 8,760 8,760 8,760 8,760 8,760 8,760 8,760 Generation GWh 7.01 7.01 7.01 7.01 7.01 7.01 7.01 7.01 7.01 7.01 7.01 7.01 7.01 7.01 7.01 7.01 7.01 7.01 7.01 7.01 Tariff Power BTN / kWh 10.0 10.0 10.0 10.0 10.0 10.0 10.0 10.0 10.0 10.0 10.0 10.0 10.0 10.0 10.0 10.0 10.0 10.0 10.0 10.0 Carbon (1) US$ / tCO2 - - - - - - - - - - - - - - - - - - - - Volume Power GWh 7.01 7.01 7.01 7.01 7.01 7.01 7.01 7.01 7.01 7.01 7.01 7.01 7.01 7.01 7.01 7.01 7.01 7.01 7.01 7.01 Carbon tCO2 - - - - - - - - - - - - - - - - - - - - Revenue Power mn 70.1 70.1 70.1 70.1 70.1 70.1 70.1 70.1 70.1 70.1 70.1 70.1 70.1 70.1 70.1 70.1 70.1 70.1 70.1 70.1 Carbon mn - - - - - - - - - - - - - - - - - - - - Total Revenue mn 70.1 70.1 70.1 70.1 70.1 70.1 70.1 70.1 70.1 70.1 70.1 70.1 70.1 70.1 70.1 70.1 70.1 70.1 70.1 70.1 O&M % p.a. 3.0% 3.0% 3.0% 3.0% 3.0% 3.0% 3.0% 3.0% 3.0% 3.0% 3.0% 3.0% 3.0% 3.0% 3.0% 3.0% 3.0% 3.0% 3.0% 3.0% O&M mil (11.0) (11.0) (11.0) (11.0) (11.0) (11.0) (11.0) (11.0) (11.0) (11.0) (11.0) (11.0) (11.0) (11.0) (11.0) (11.0) (11.0) (11.0) (11.0) (11.0) EBITDA mn 59.1 59.1 59.1 59.1 59.1 59.1 59.1 59.1 59.1 59.1 59.1 59.1 59.1 59.1 59.1 59.1 59.1 59.1 59.1 59.1 CFADS (2) mn 59.1 59.1 59.1 59.1 59.1 59.1 59.1 59.1 59.1 59.1 59.1 59.1 59.1 59.1 59.1 59.1 59.1 59.1 59.1 59.1 Ineterst % p.a. 12% 12% 12% 12% 12% 12% 12% 12% 12% 12% 12% 12% 12% 12% 12% 12% 12% 12% 12% 12% Ineterst mn (30.8) (27.8) (24.7) (21.6) (18.5) (15.4) (12.3) (9.3) (6.2) (3.1) - - - - - - - - - - CFADR (3) 28.2 31.3 34.4 37.5 40.6 43.6 46.7 49.8 52.9 56.0 59.1 59.1 59.1 59.1 59.1 59.1 59.1 59.1 59.1 59.1 Debt Repayment mn (25.7) (25.7) (25.7) (25.7) (25.7) (25.7) (25.7) (25.7) (25.7) (25.7) - - - - - - - - - - PBT 2.5 5.6 8.7 11.8 14.9 17.9 21.0 24.1 27.2 30.3 59.1 59.1 59.1 59.1 59.1 59.1 59.1 59.1 59.1 59.1 Tax Rate % p.a. 0% 0% 0% 0% 0% 0% 0% 0% 0% 0% 30% 30% 30% 30% 30% 30% 30% 30% 30% 30% Tax mn - - - - - - - - - - (17.7) (17.7) (17.7) (17.7) (17.7) (17.7) (17.7) (17.7) (17.7) (17.7) PAT 2.5 5.6 8.7 11.8 14.9 17.9 21.0 24.1 27.2 30.3 41.3 41.3 41.3 41.3 41.3 41.3 41.3 41.3 41.3 41.3 Debt Module Op Balance mn 257.0 231.3 205.6 179.9 154.2 128.5 102.8 77.1 51.4 25.7 - - - - - - - - - - Repayment mn (25.7) (25.7) (25.7) (25.7) (25.7) (25.7) (25.7) (25.7) (25.7) (25.7) - - - - - - - - - - Closing Balance 231.3 205.6 179.9 154.2 128.5 102.8 77.1 51.4 25.7 - - - - - - - - - - - Note: The above table shows the financials of the first 20 years of the project life (1) For sake of simplicity, revenue from carbon credits is assumed to be zero for the preliminary evaluation (2) Given Tax is exempt during the tenor of the debt, EBITDA has been taken as a proxy for Cash Flow Available for Debt Service (CFADS); Average DSCR of 1.45x with a minimum of 1.0x during initial years (3) CFADR = Cash Flow Available for Debt Repayment 10
  • 12.
    Proposed Next Steps n The analysis above is only indicative and preliminary (pre-feasibility), based primarily on literature review and secondary research n Furthermore, a substantial amount of resource data is quite dated n Planning for a Utility Scale Solar Power Project, including technology selection, mounting systems, yield assessment, debt capacity assessment etc. can vary considerably across sites, depending on the solar resource availability and policy support n Hence we recommend the following next steps for detailed evaluation of a Utility Scale Solar Project at the shortlisted locations Site Assessment n A detailed on the ground assessment of Solar Resource should be carried out at the shortlisted sites, which would be very critical n A detailed assessment would be necessary to learn the exact energy yields across sites and hence plan project specifics n It would also be equally important to understand the topography, climate, seasonality etc. of the selected sites Policy Support n The approval of The Alternative Renewable Energy Policy 2013 has been one of the key milestones in Bhutan’s progress towards shaping its Renewable Energy landscape n The Policy not only reinforces Bhutan’s commitment towards promoting RETs but also provides the necessary direction for RE’s promotion and development roadmap in Bhutan n However the Policy still lacks definite answers on some very key economic drivers of Renewable Energy Projects, including Model Offtake Agreements and Feed In Tariffs n Such details would be necessary to lend clarity to project economics and attract private participation in the Renewable Energy Objectives of Bhutan 11