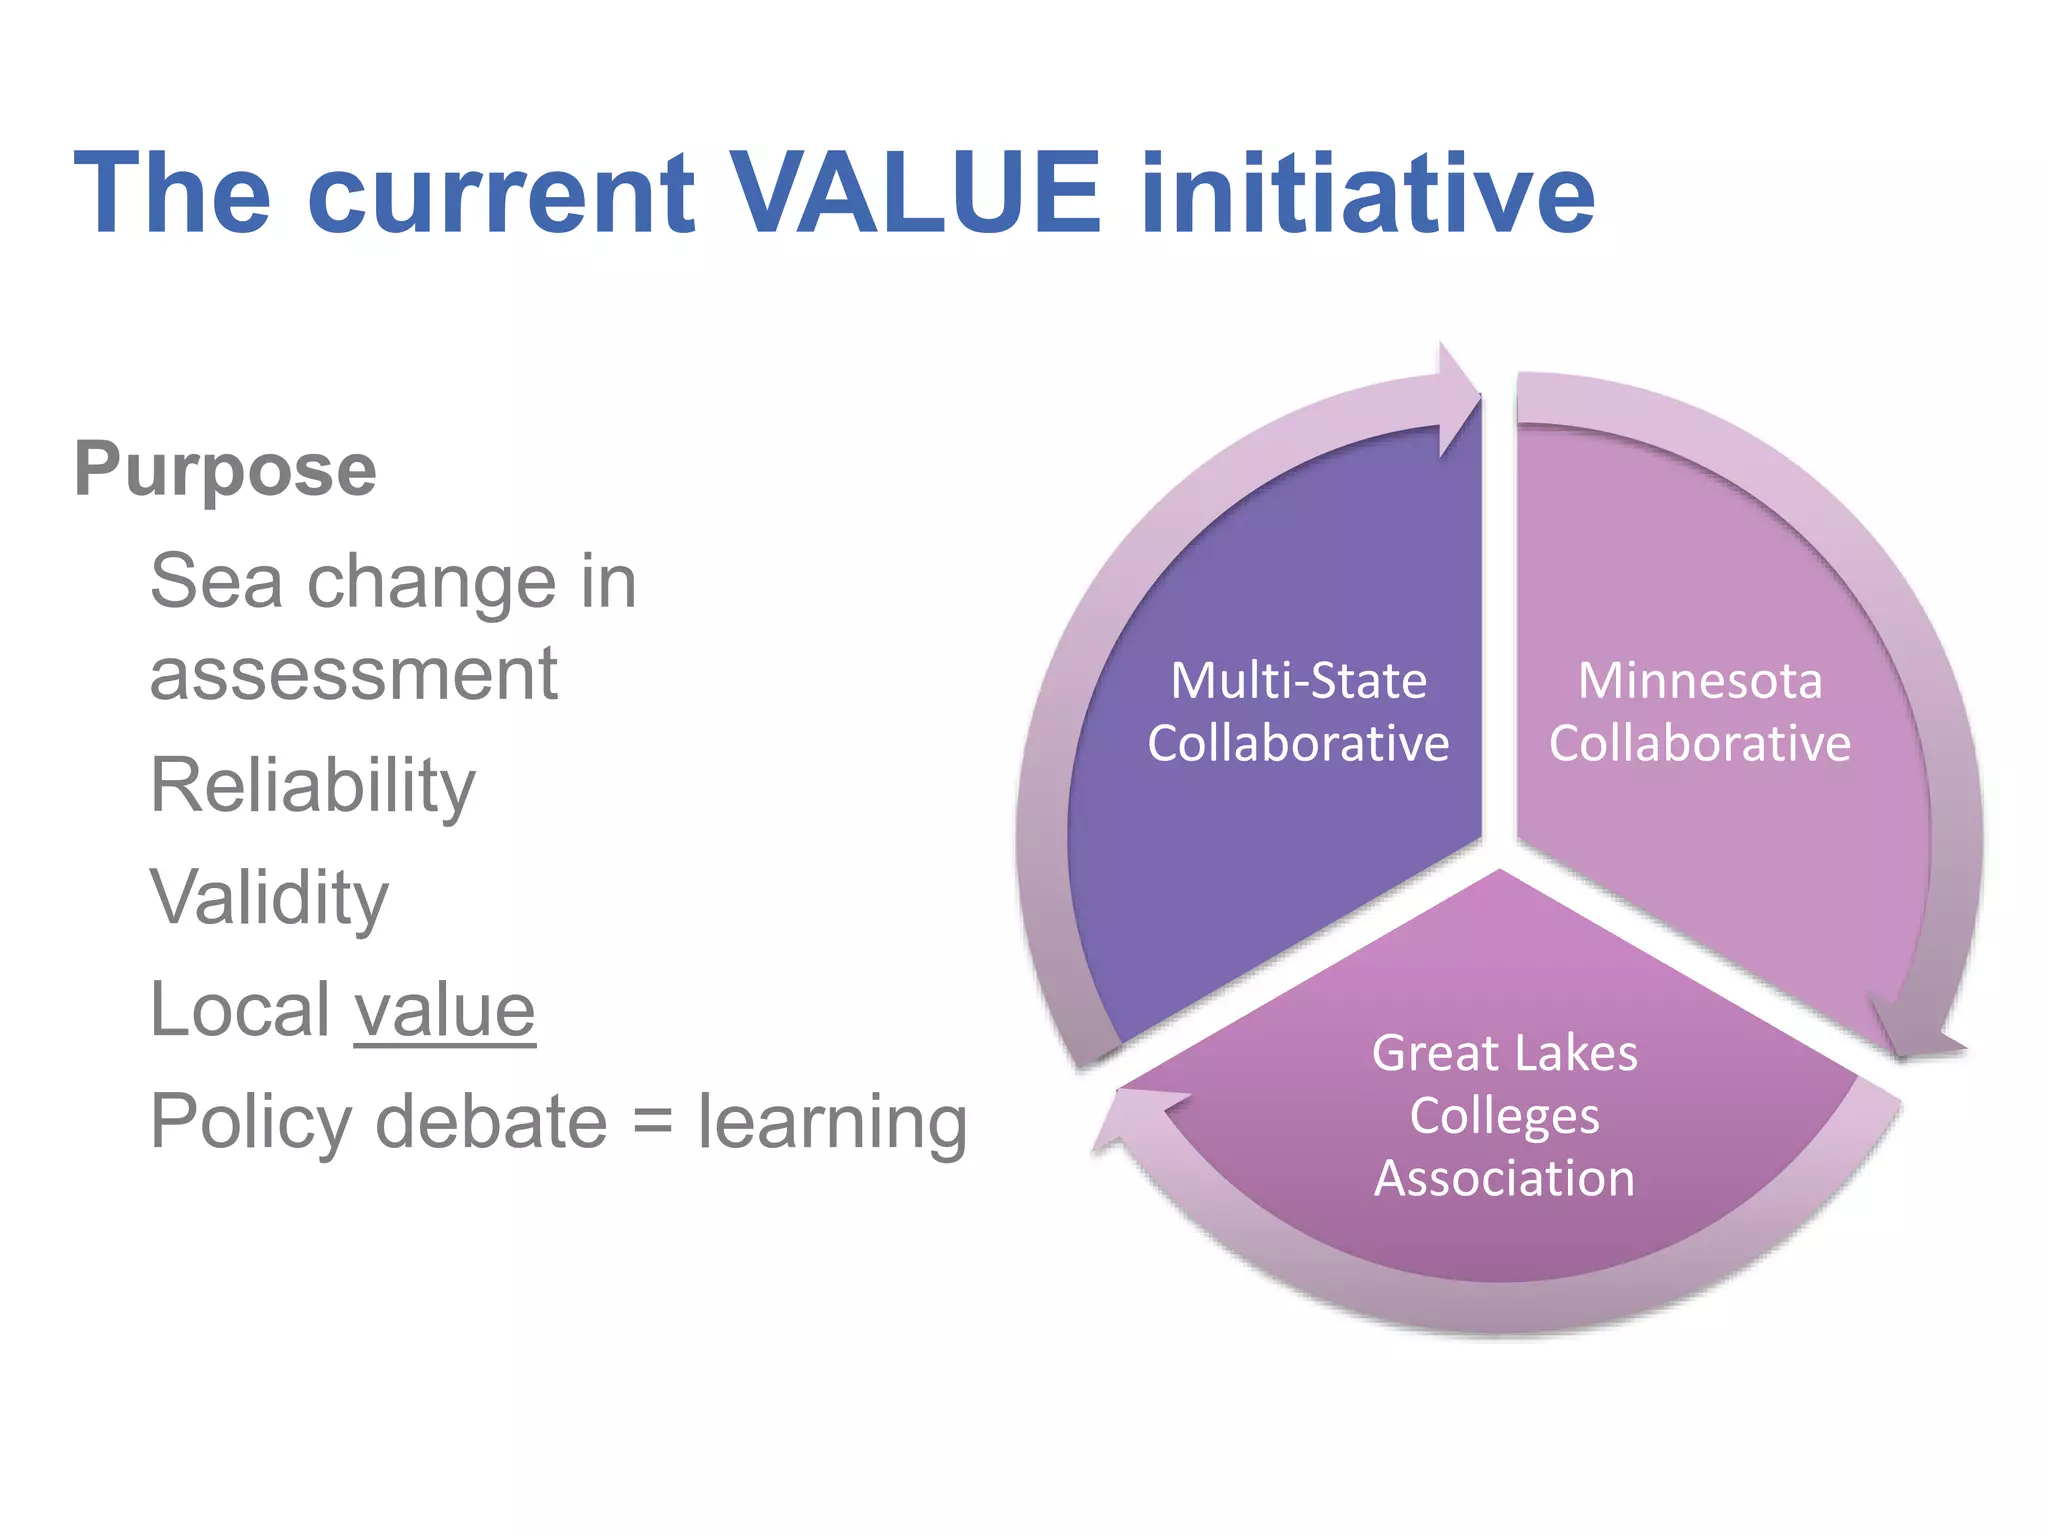
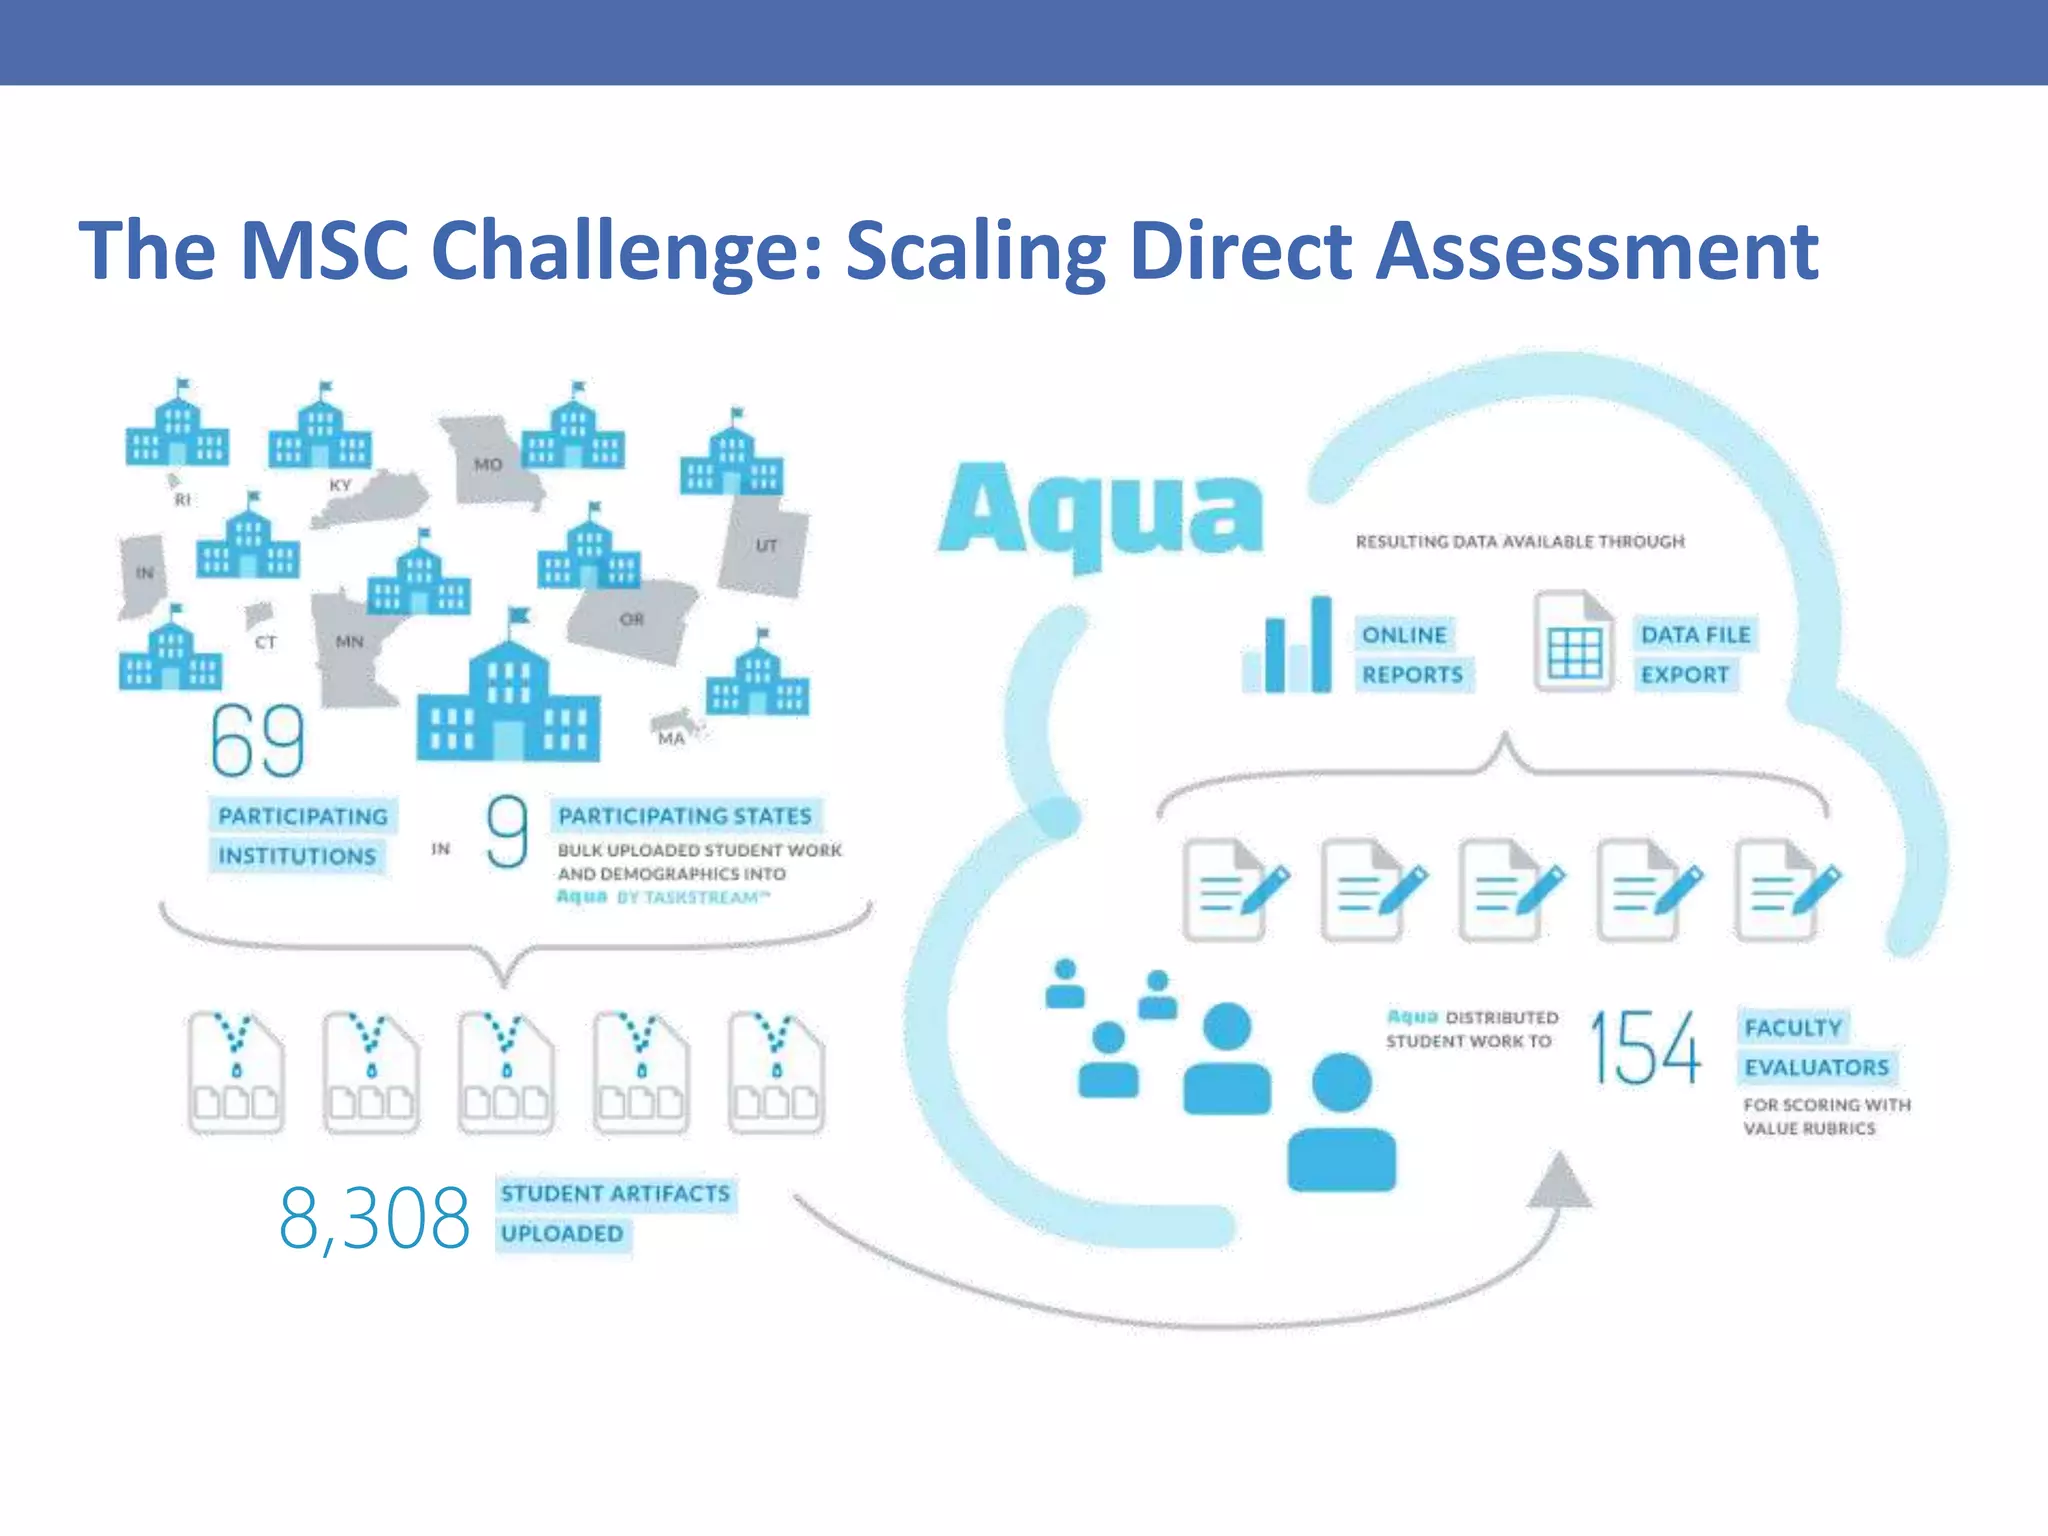
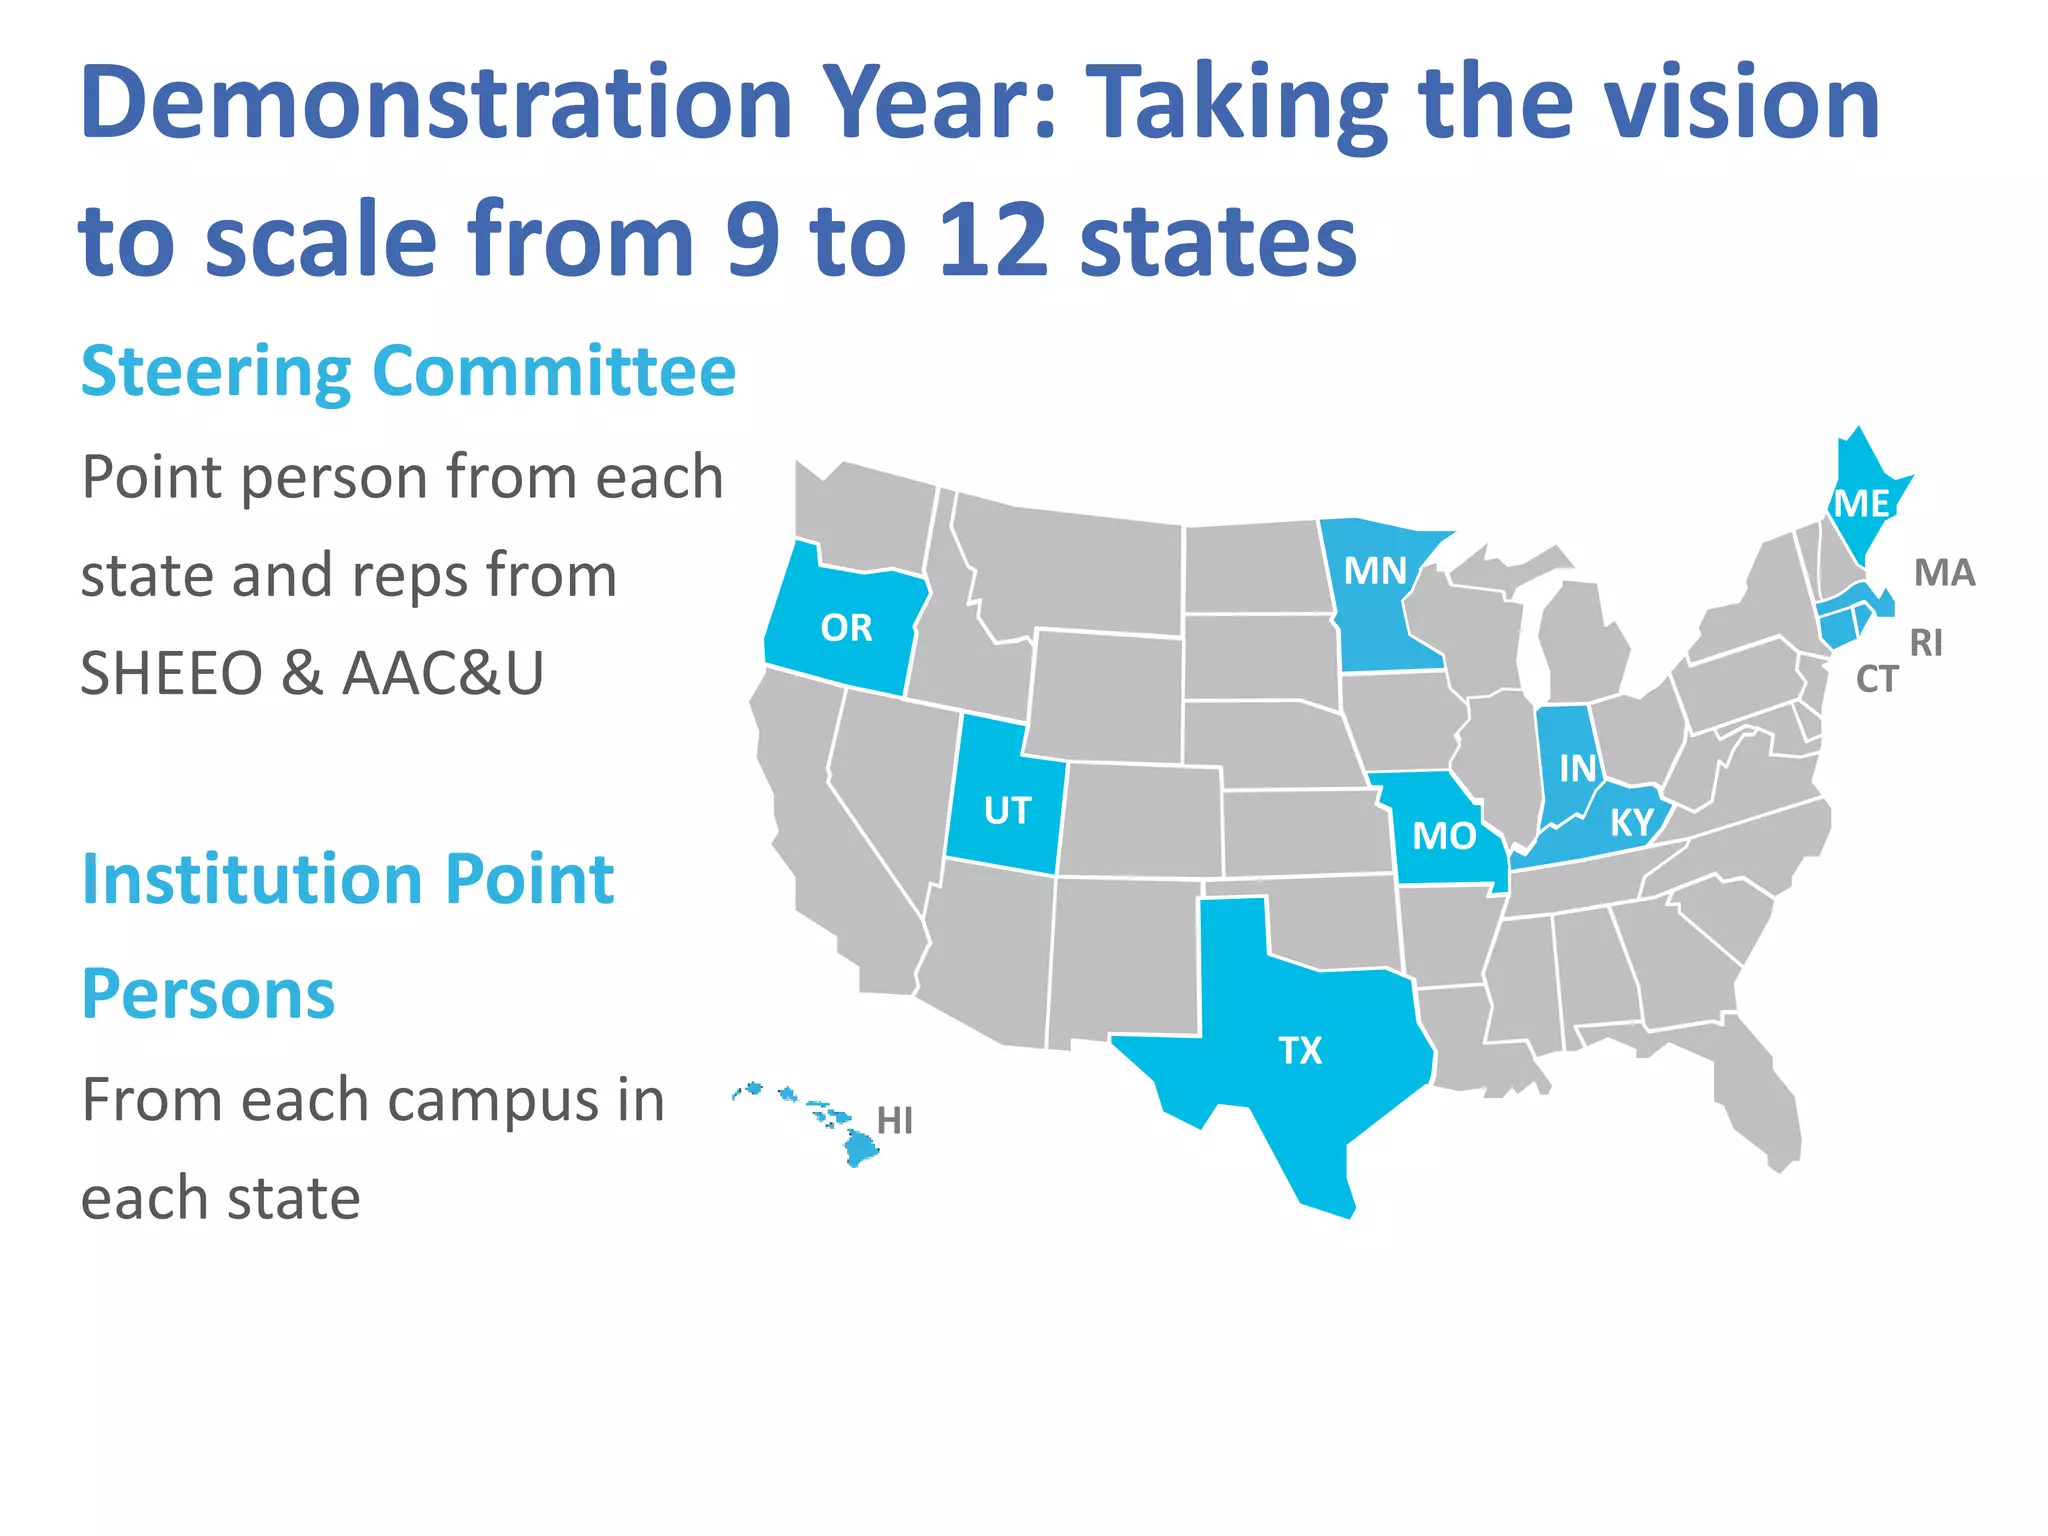
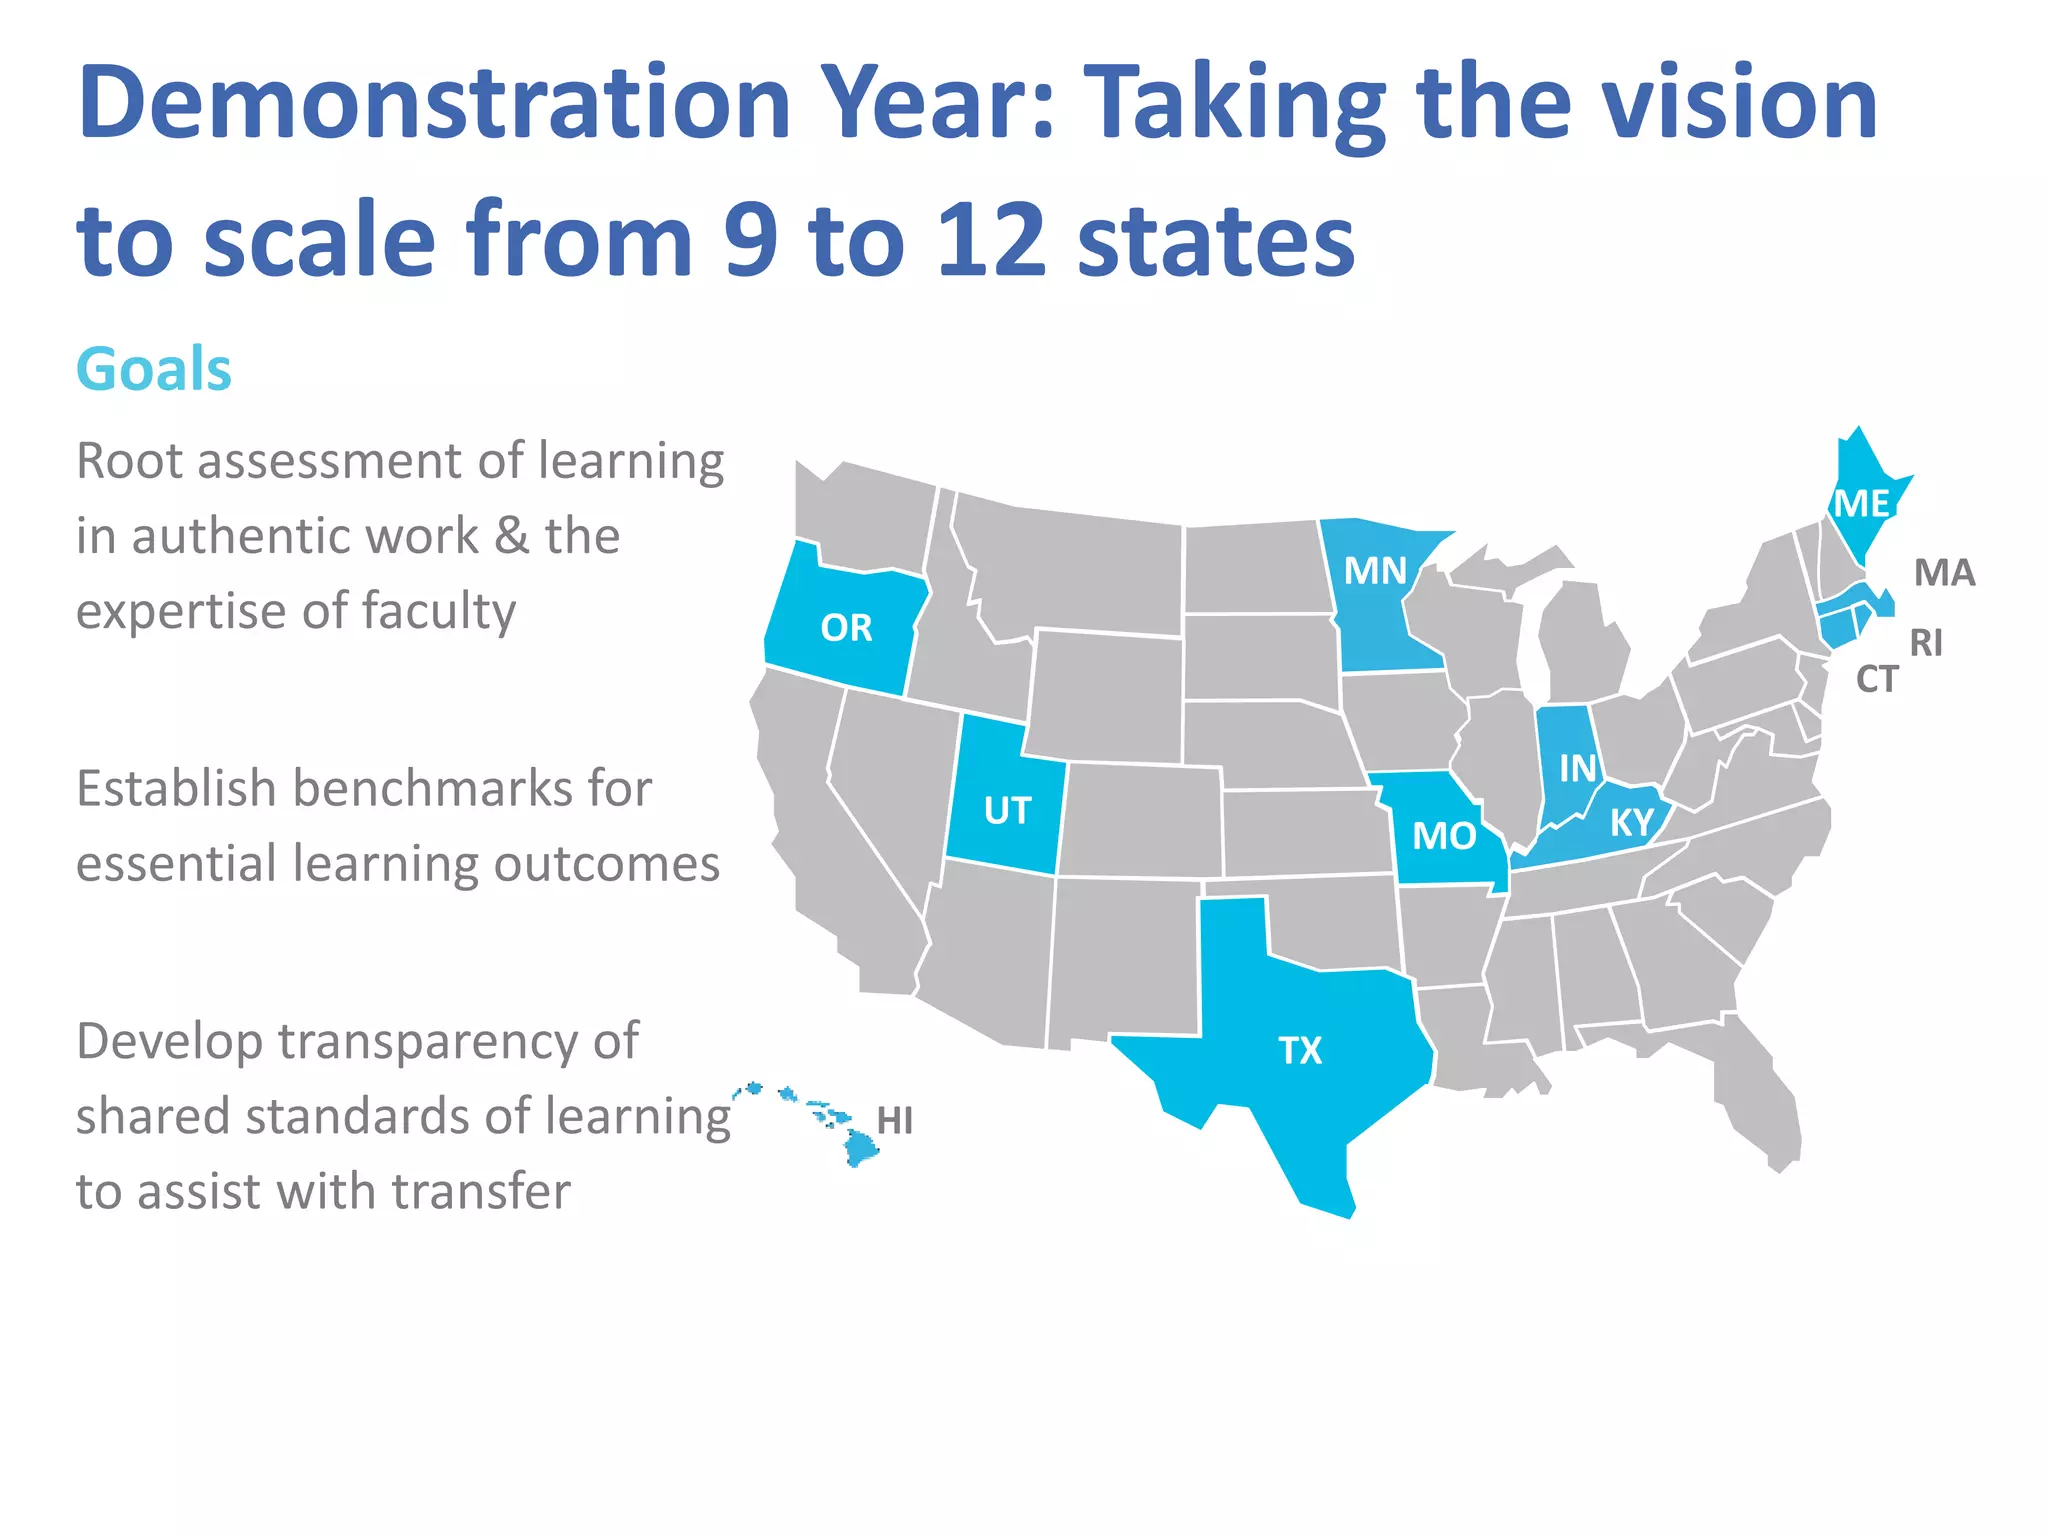
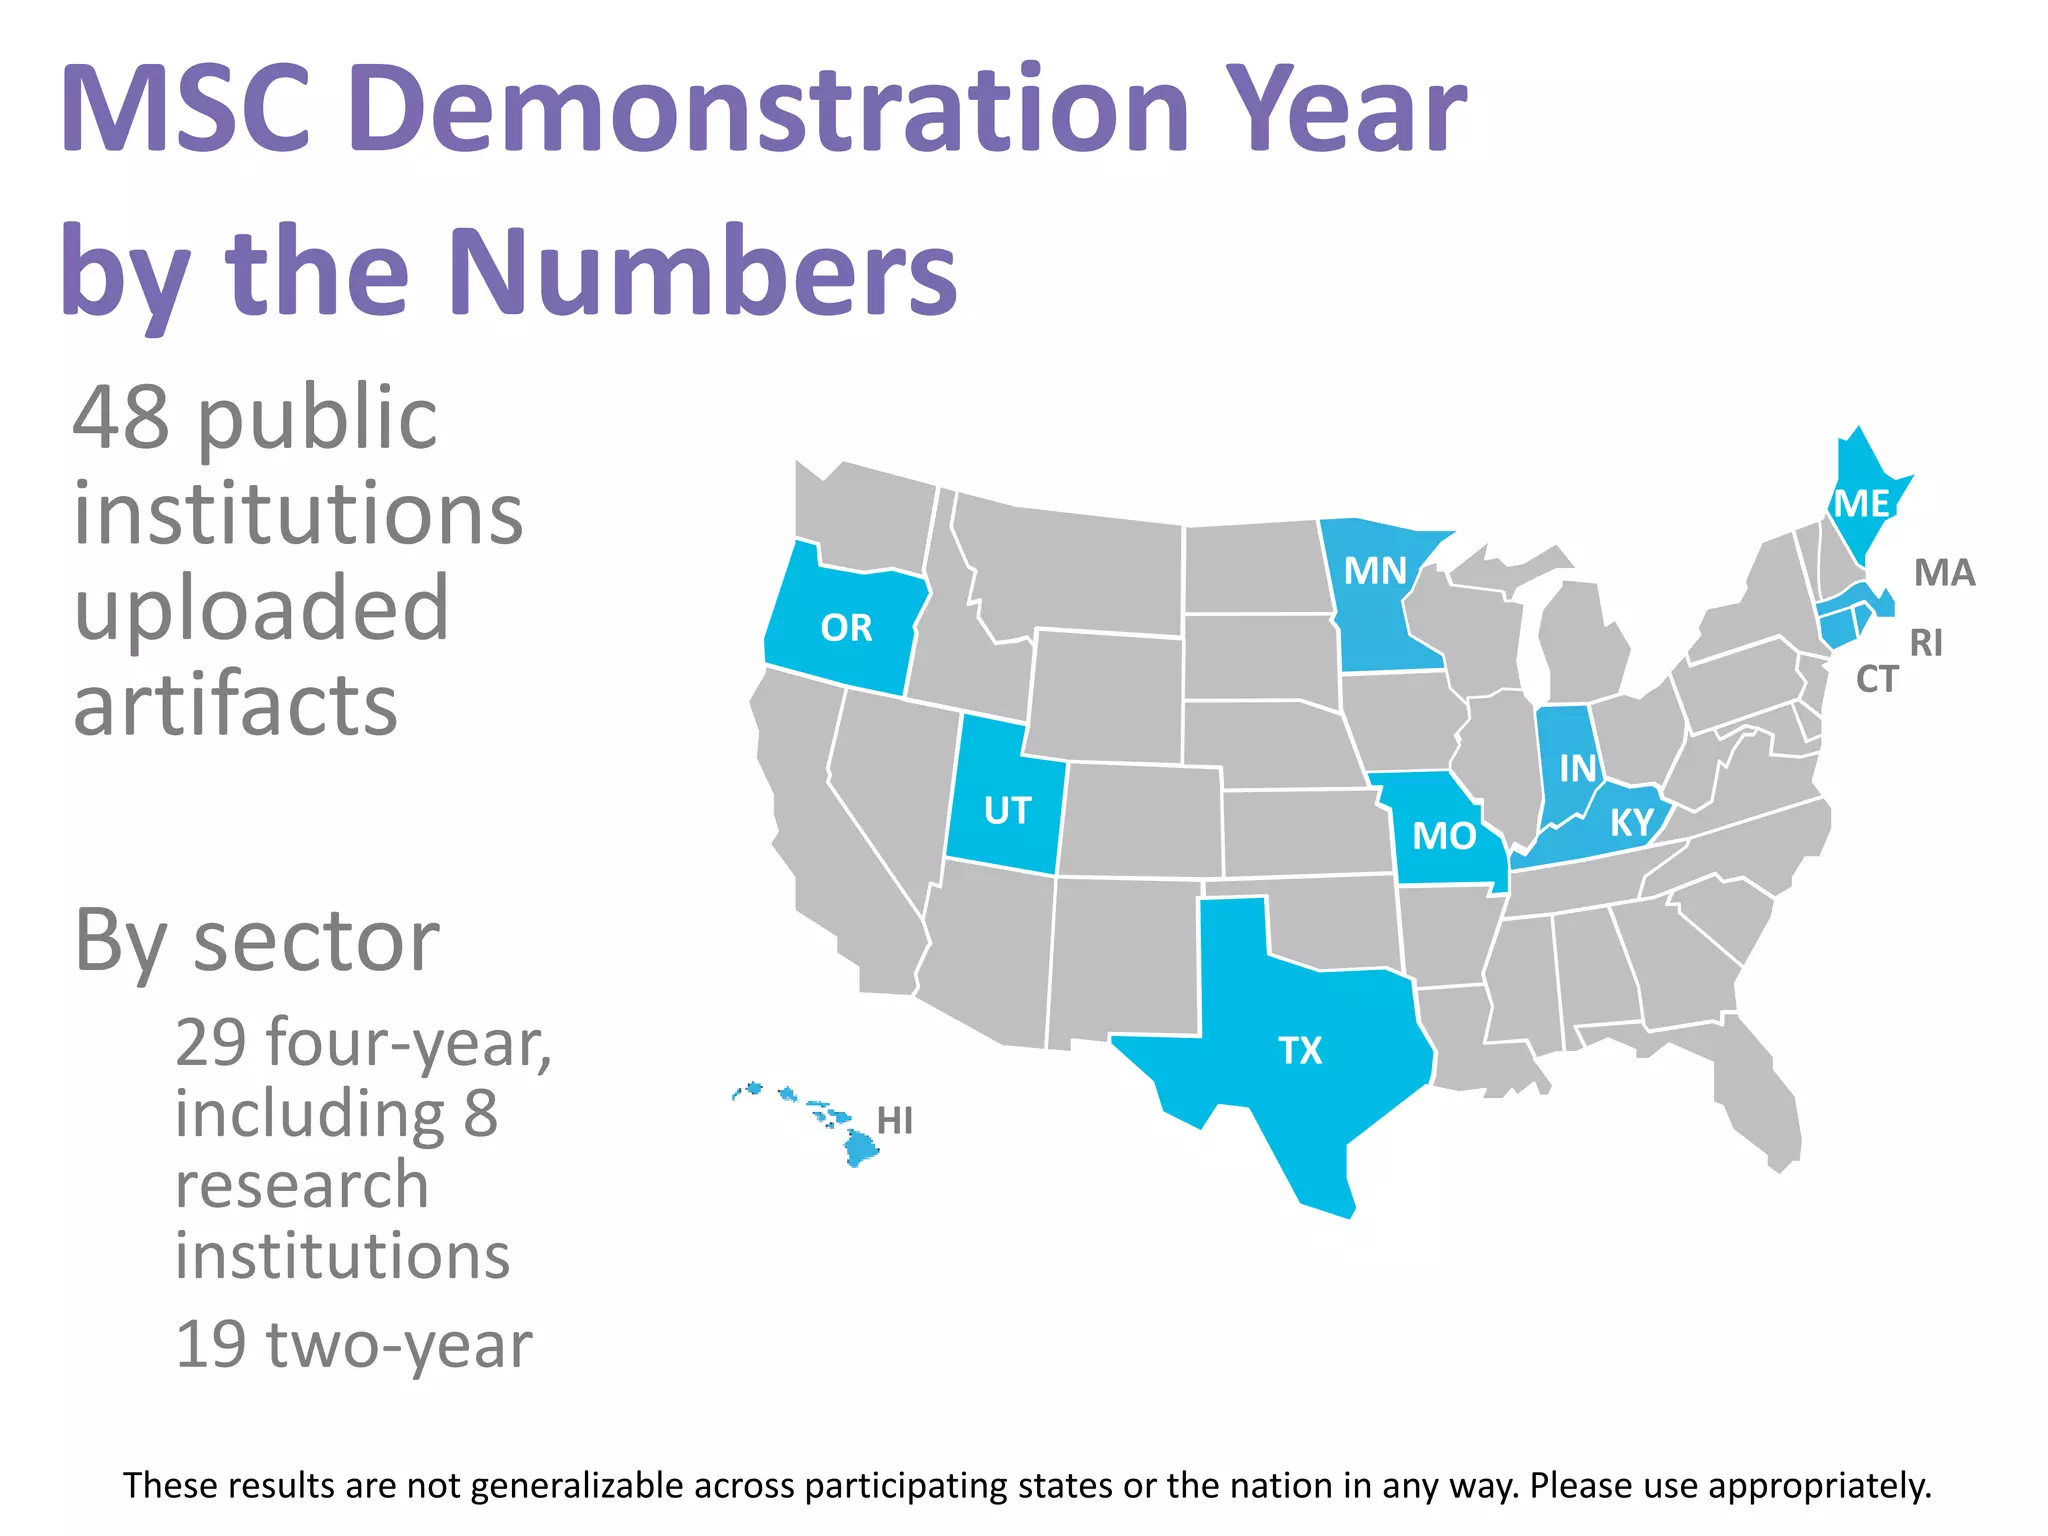
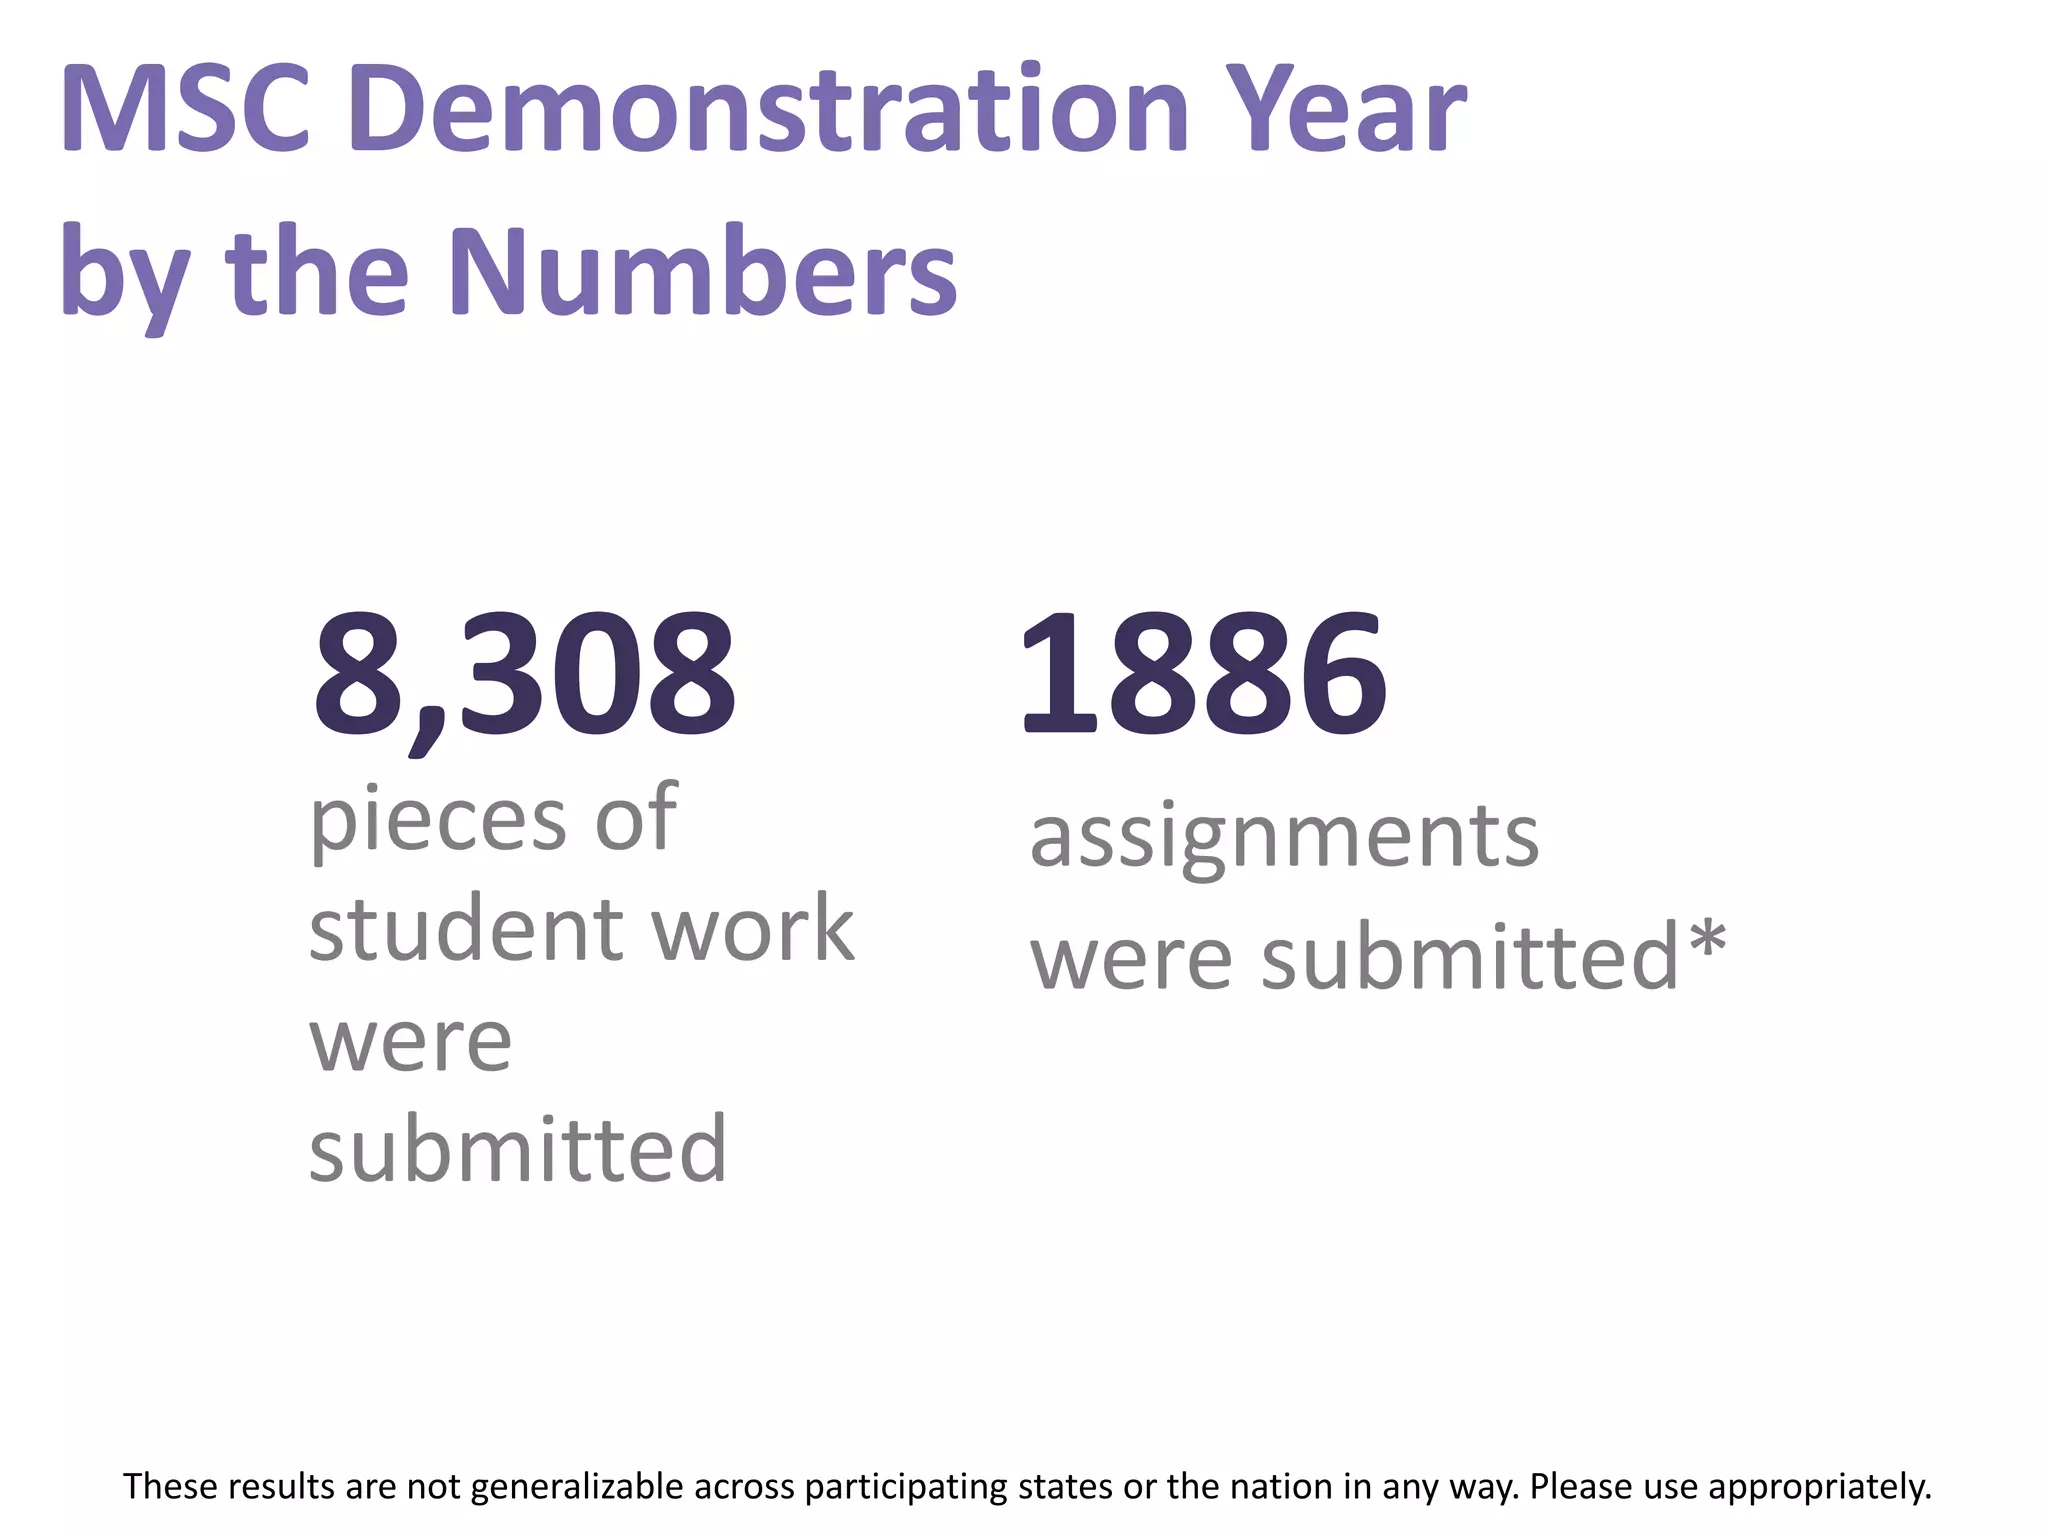
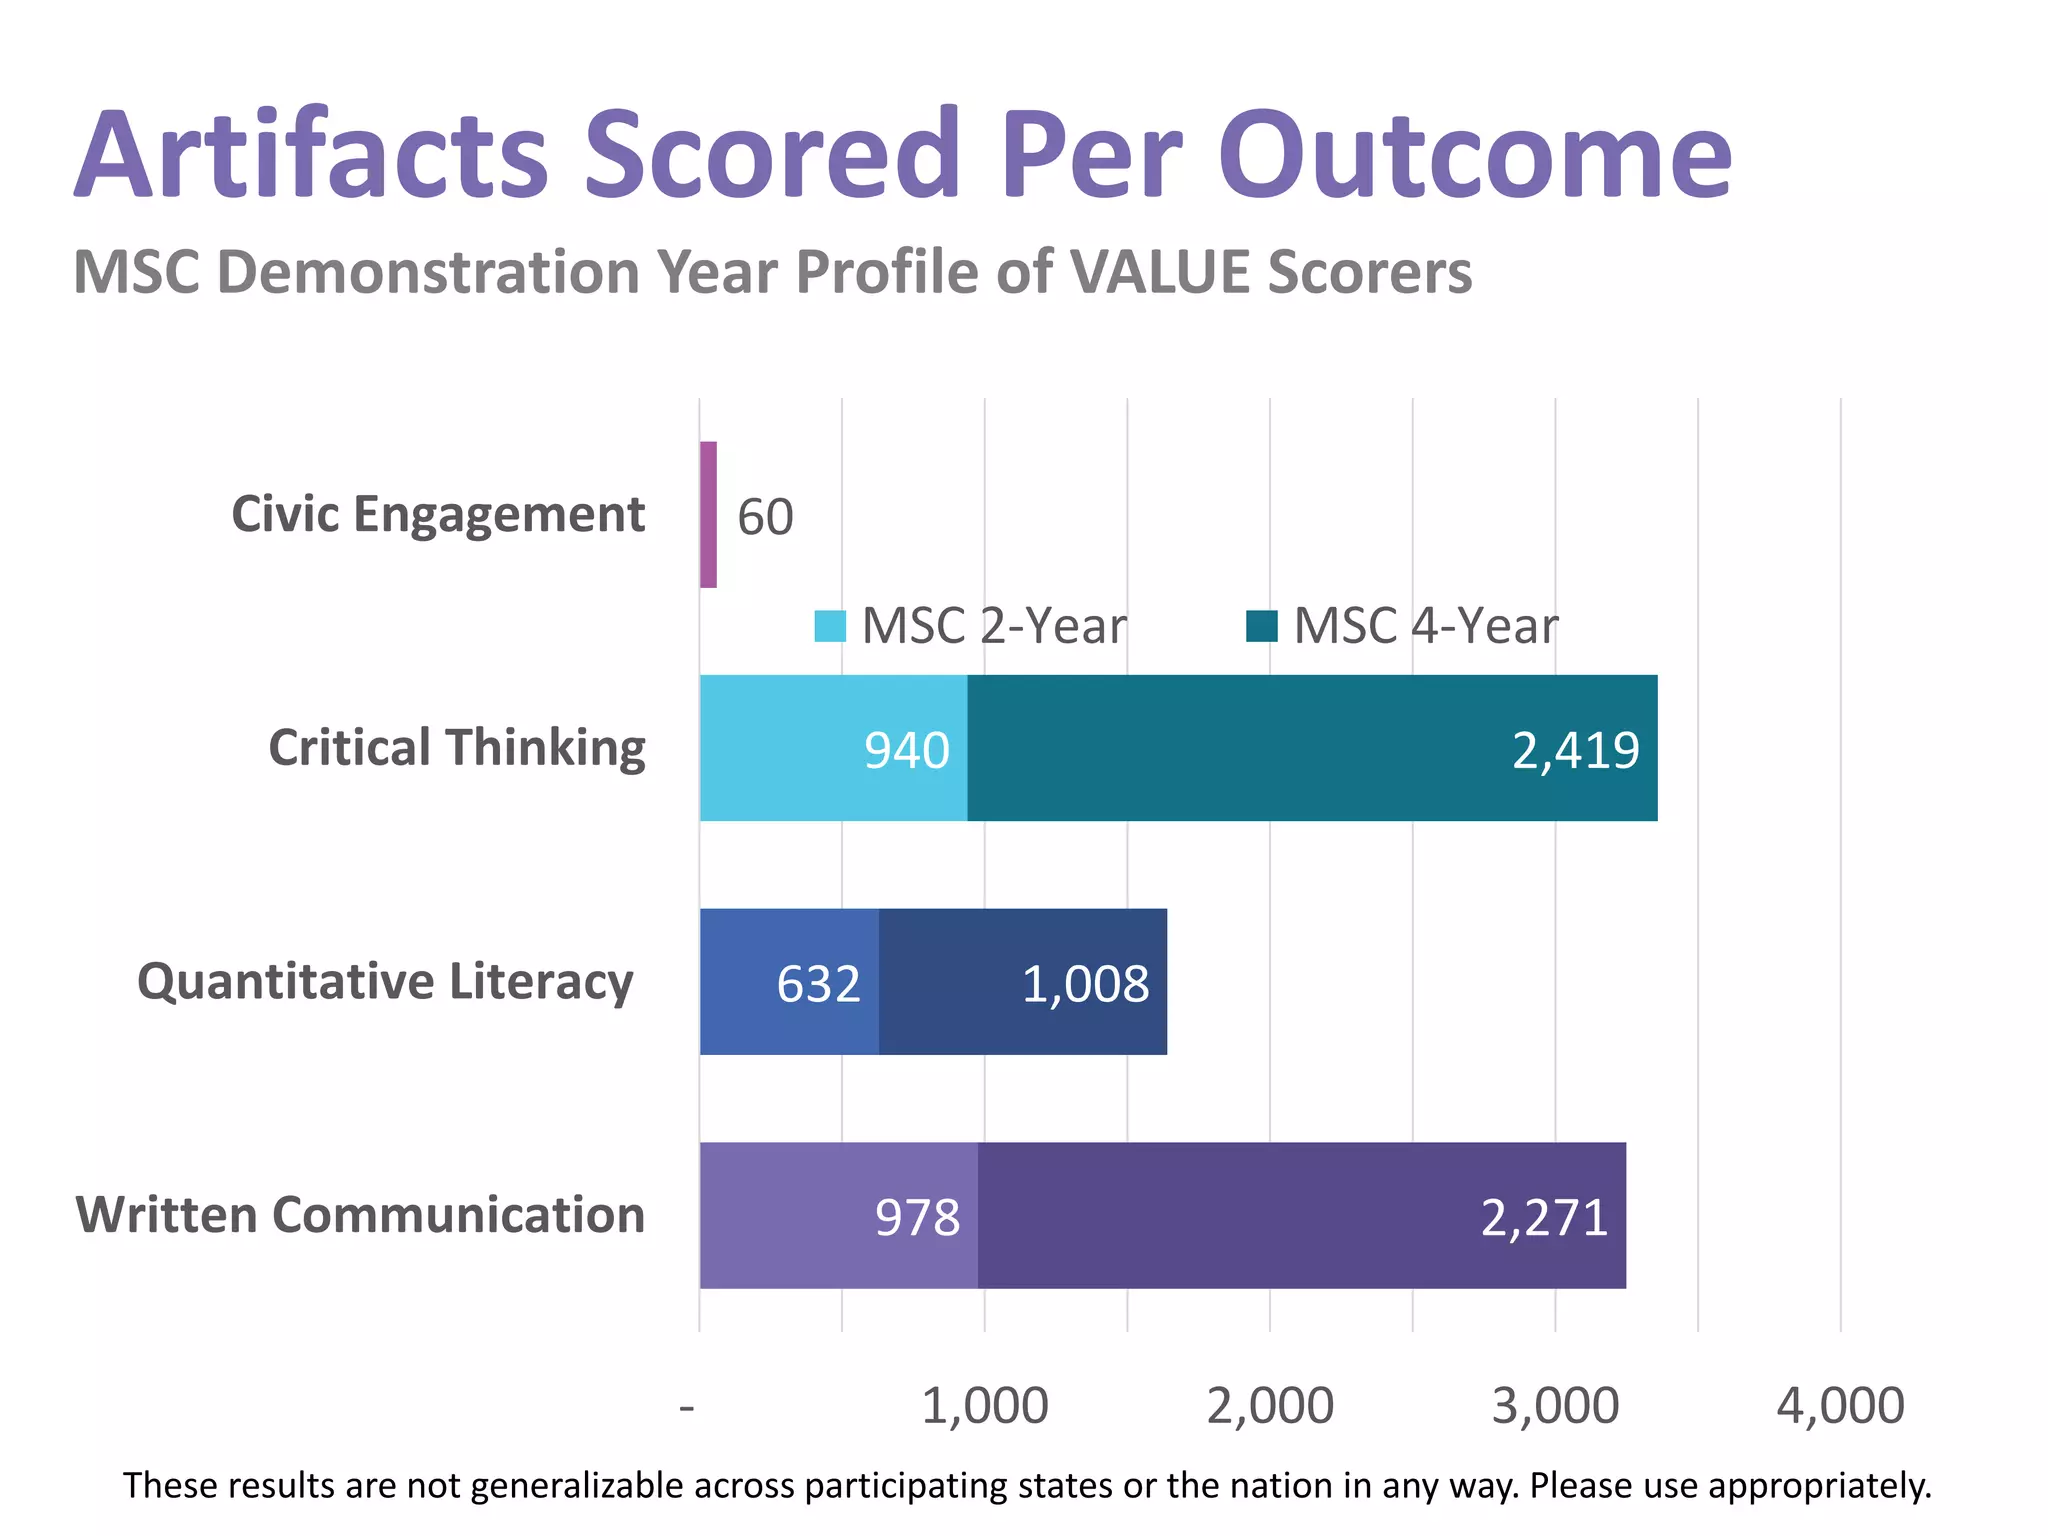
This document summarizes the results of a demonstration study involving 48 institutions across 12 states that used common rubrics to assess over 8,000 student work products. Key findings include:
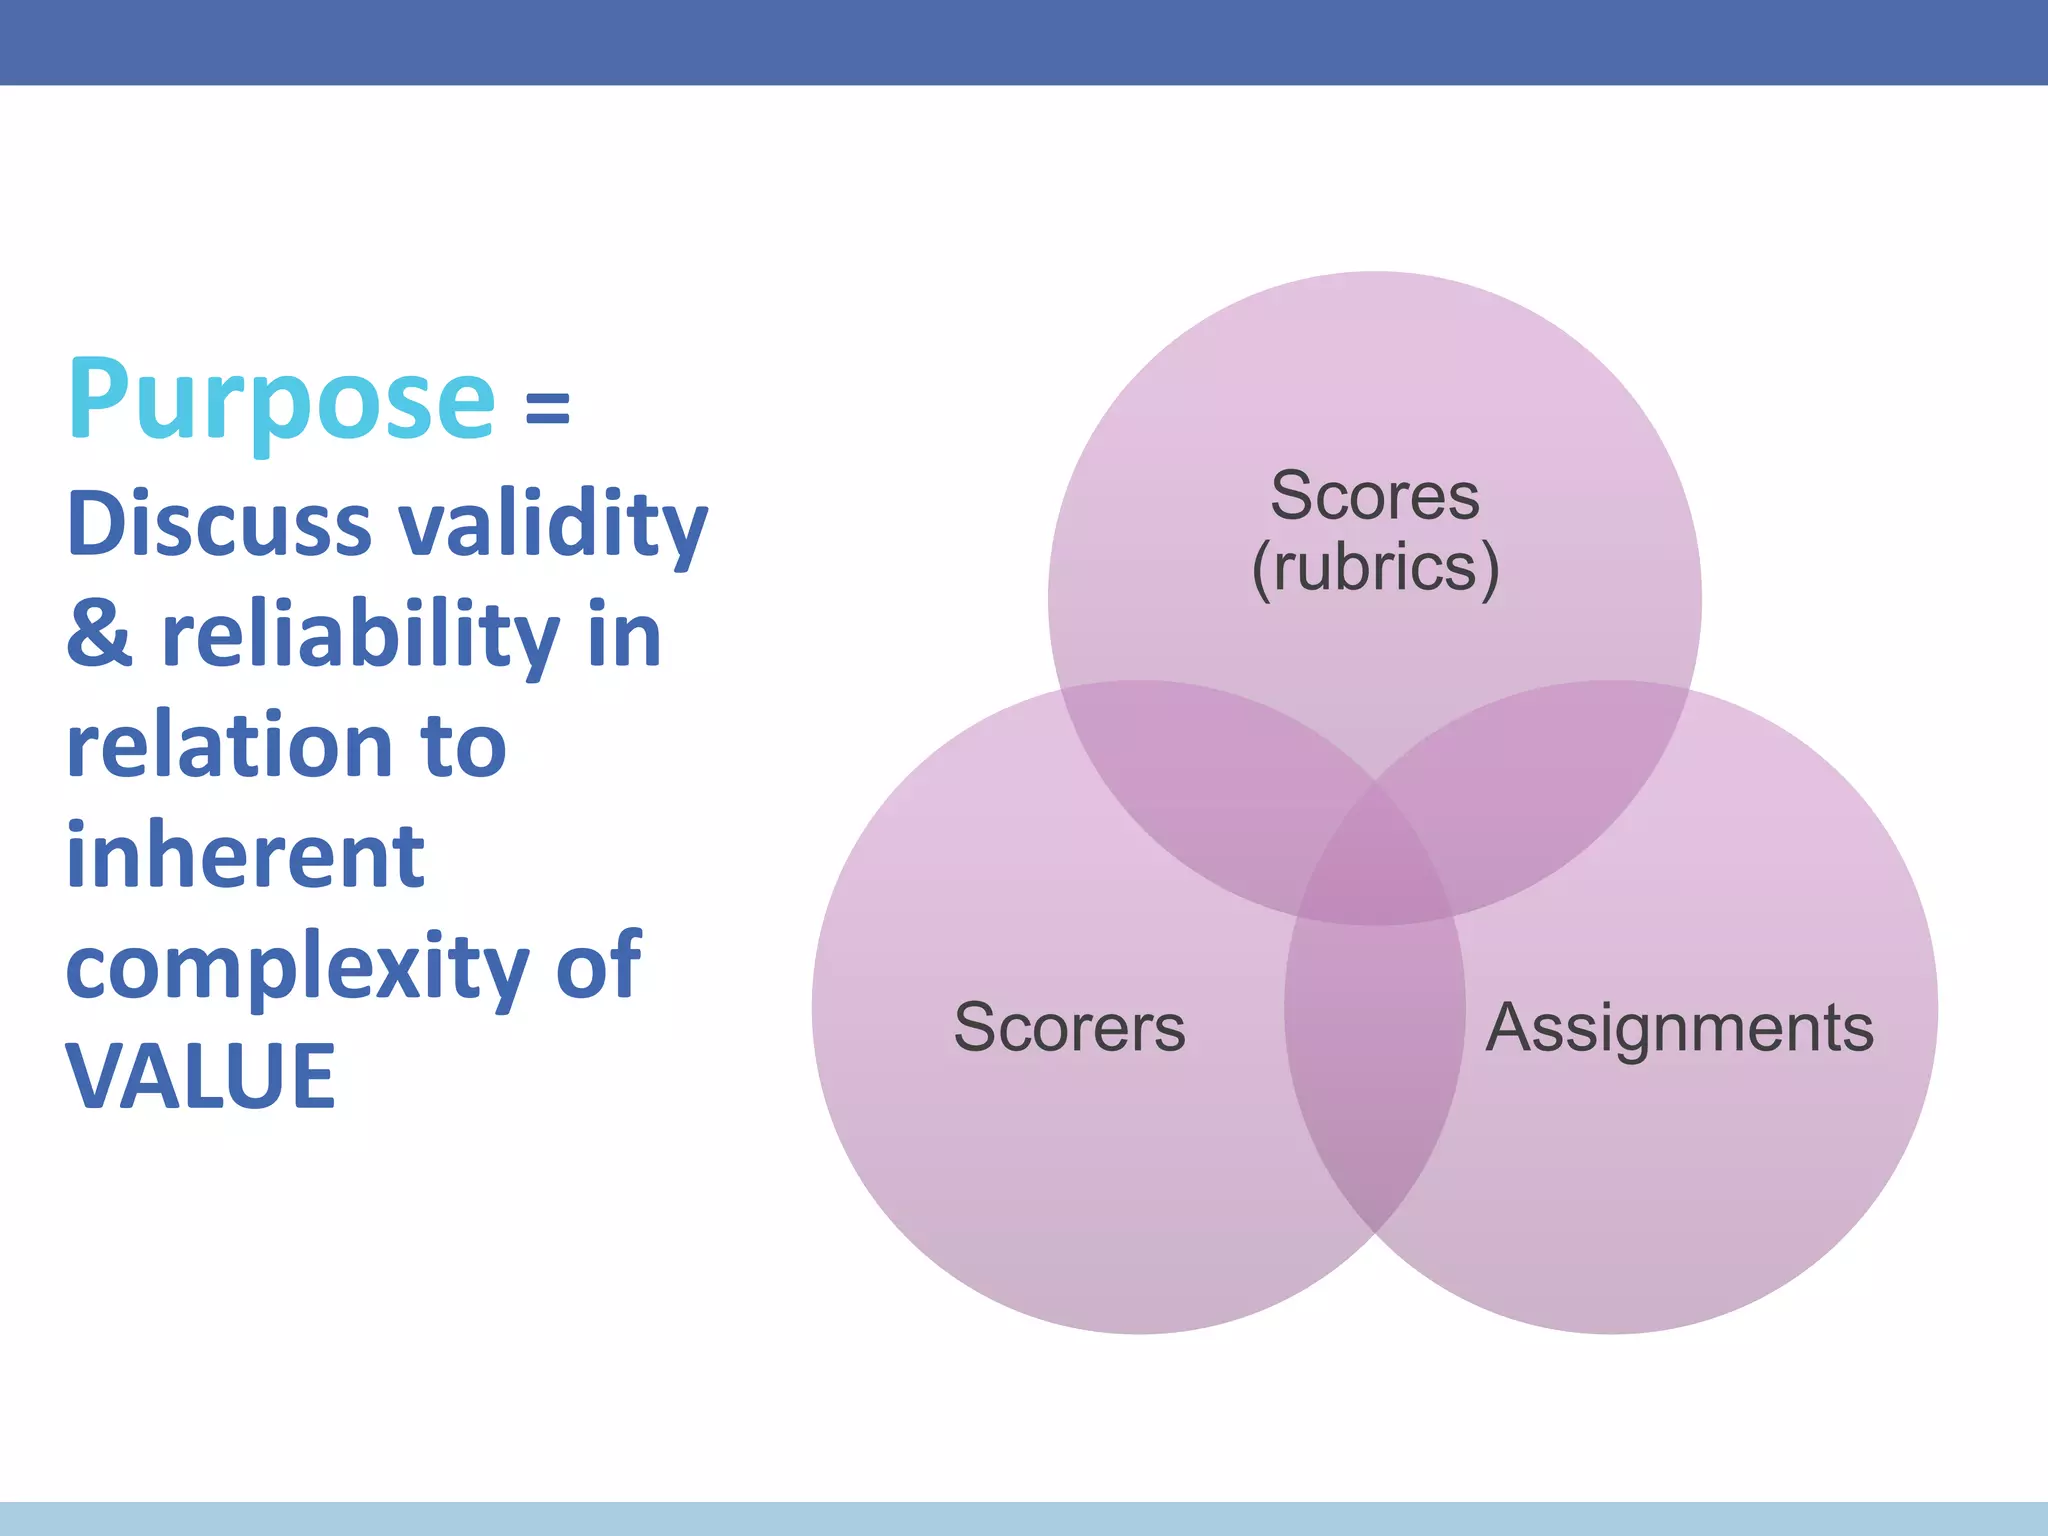
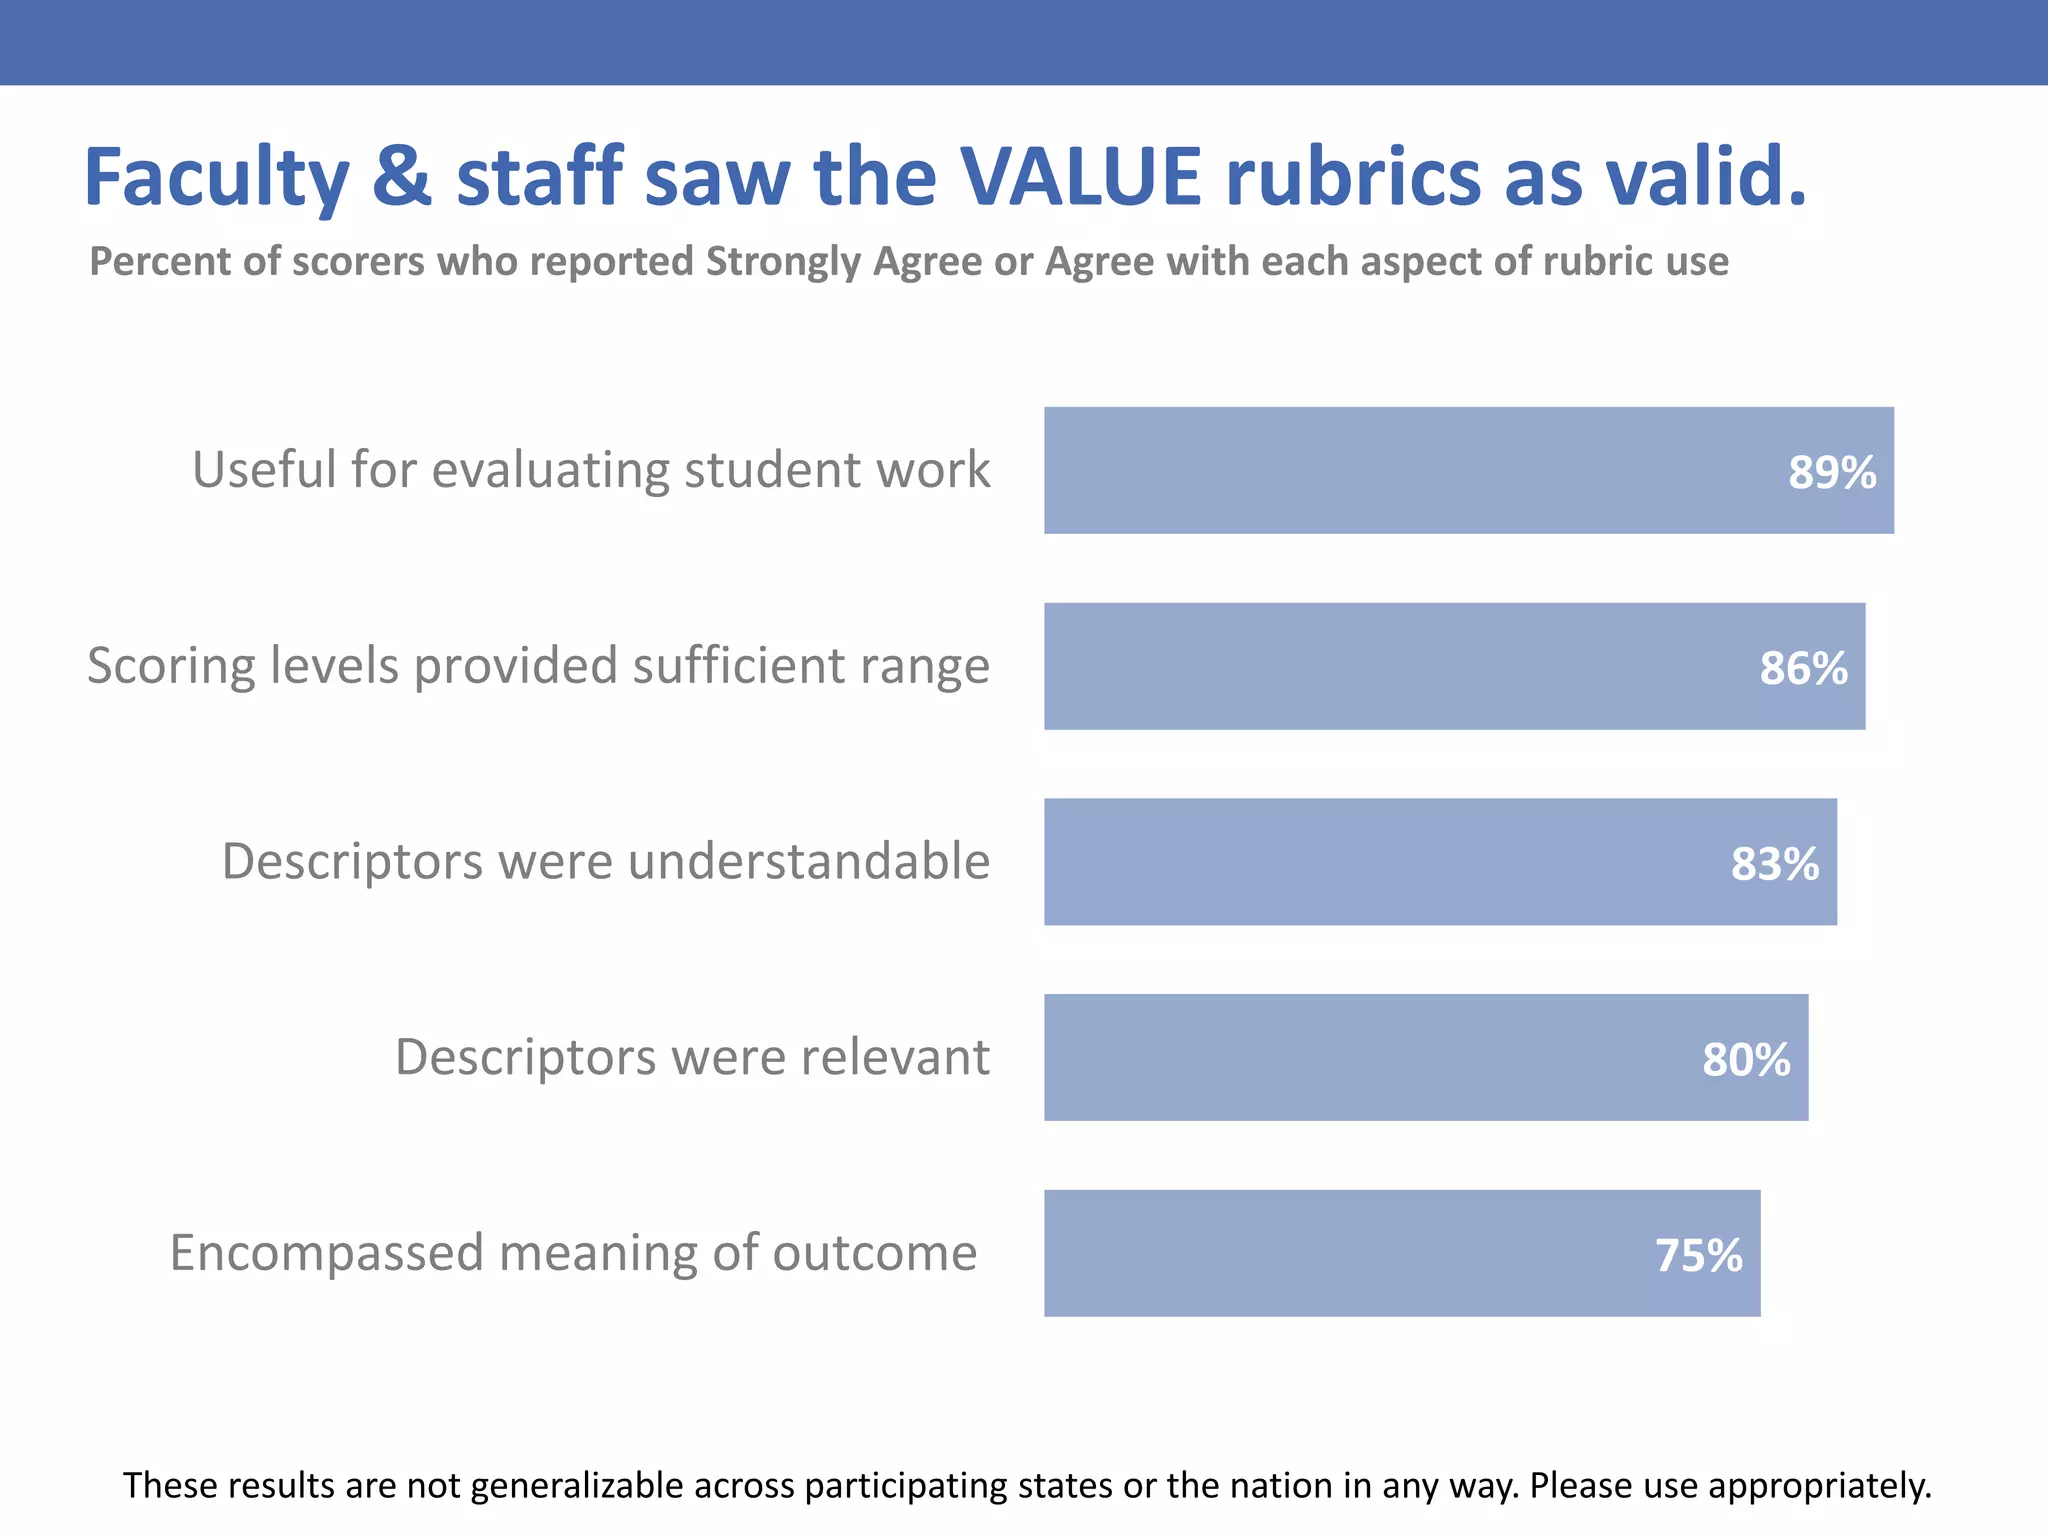
- Faculty generally found the VALUE rubrics to be valid assessments of student learning outcomes.
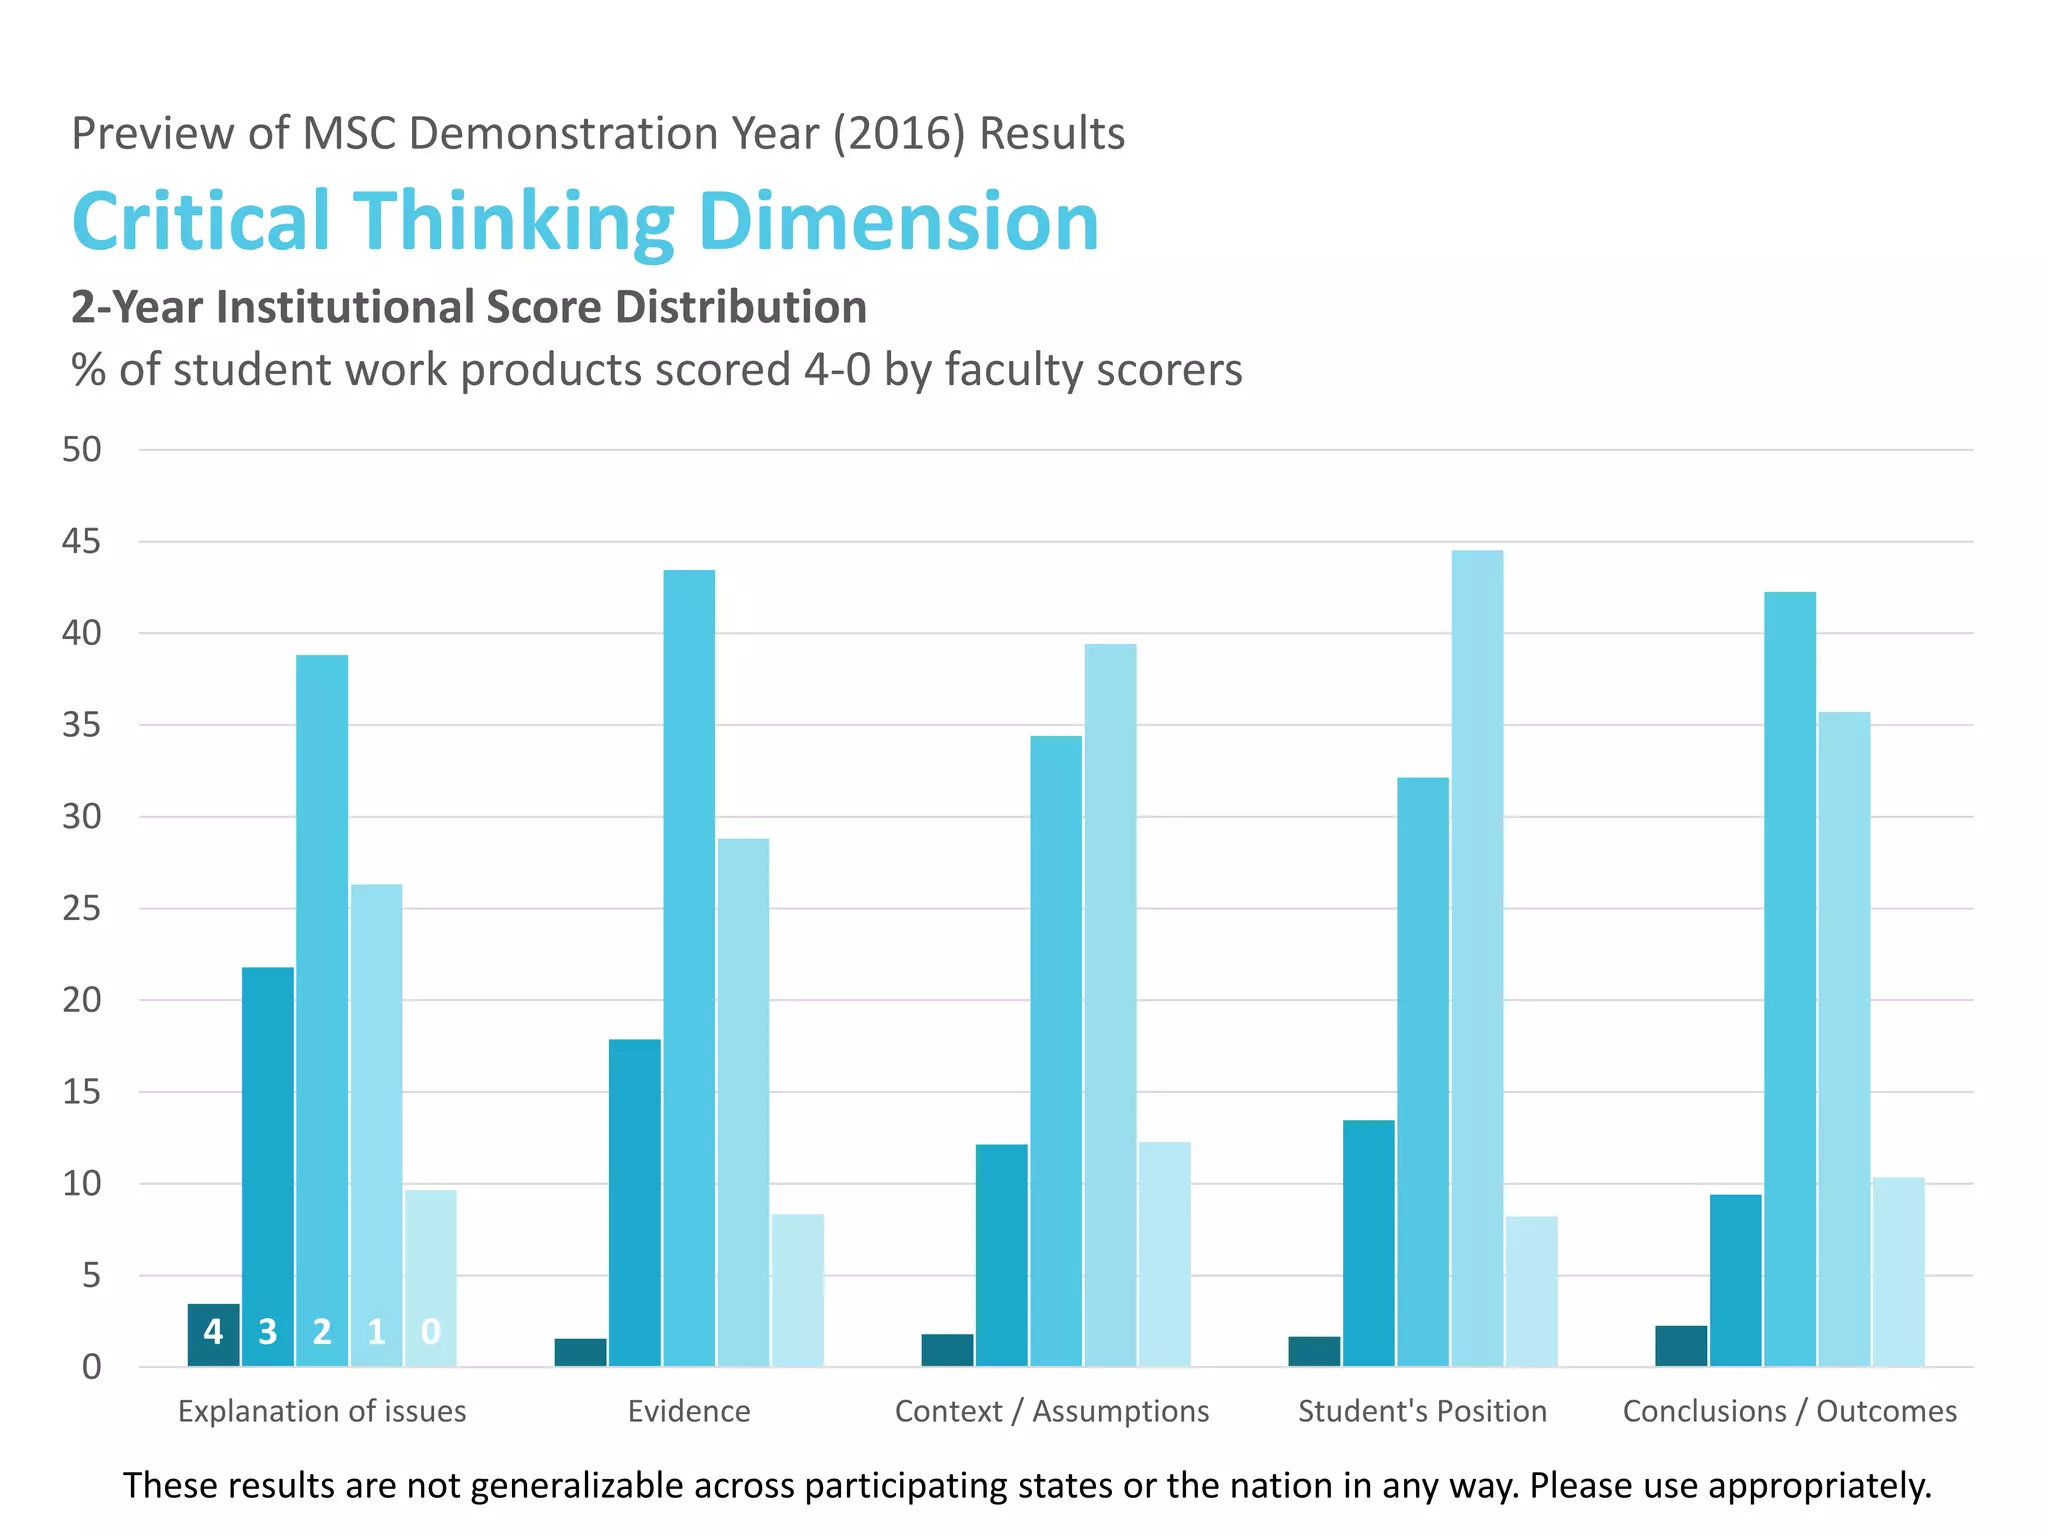
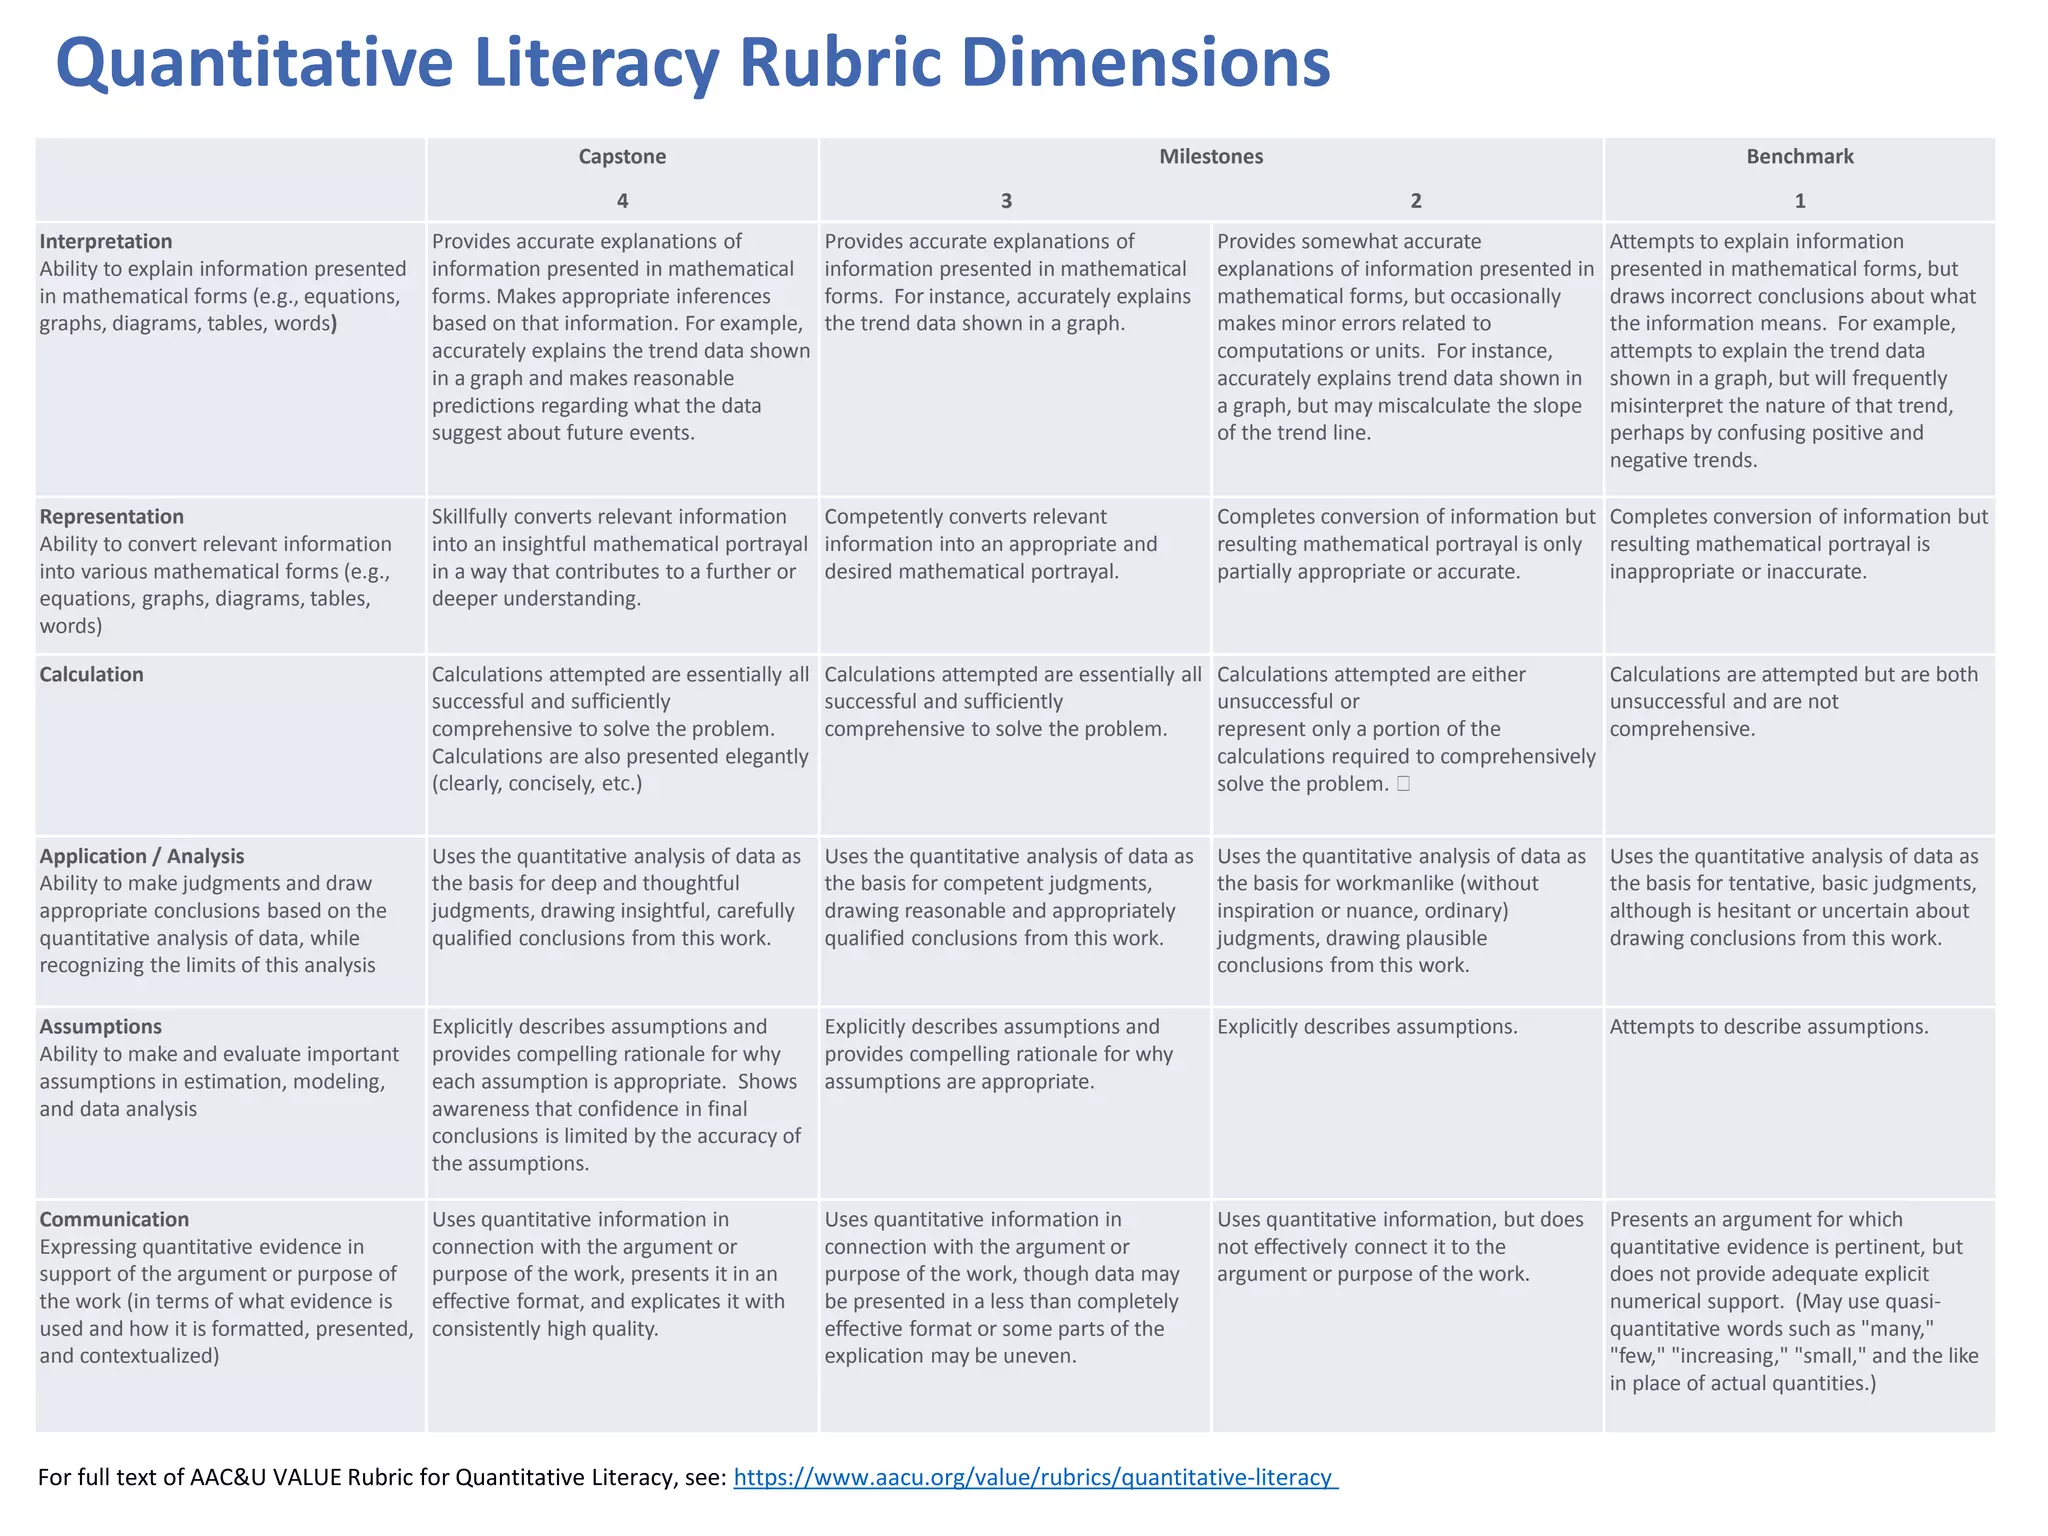
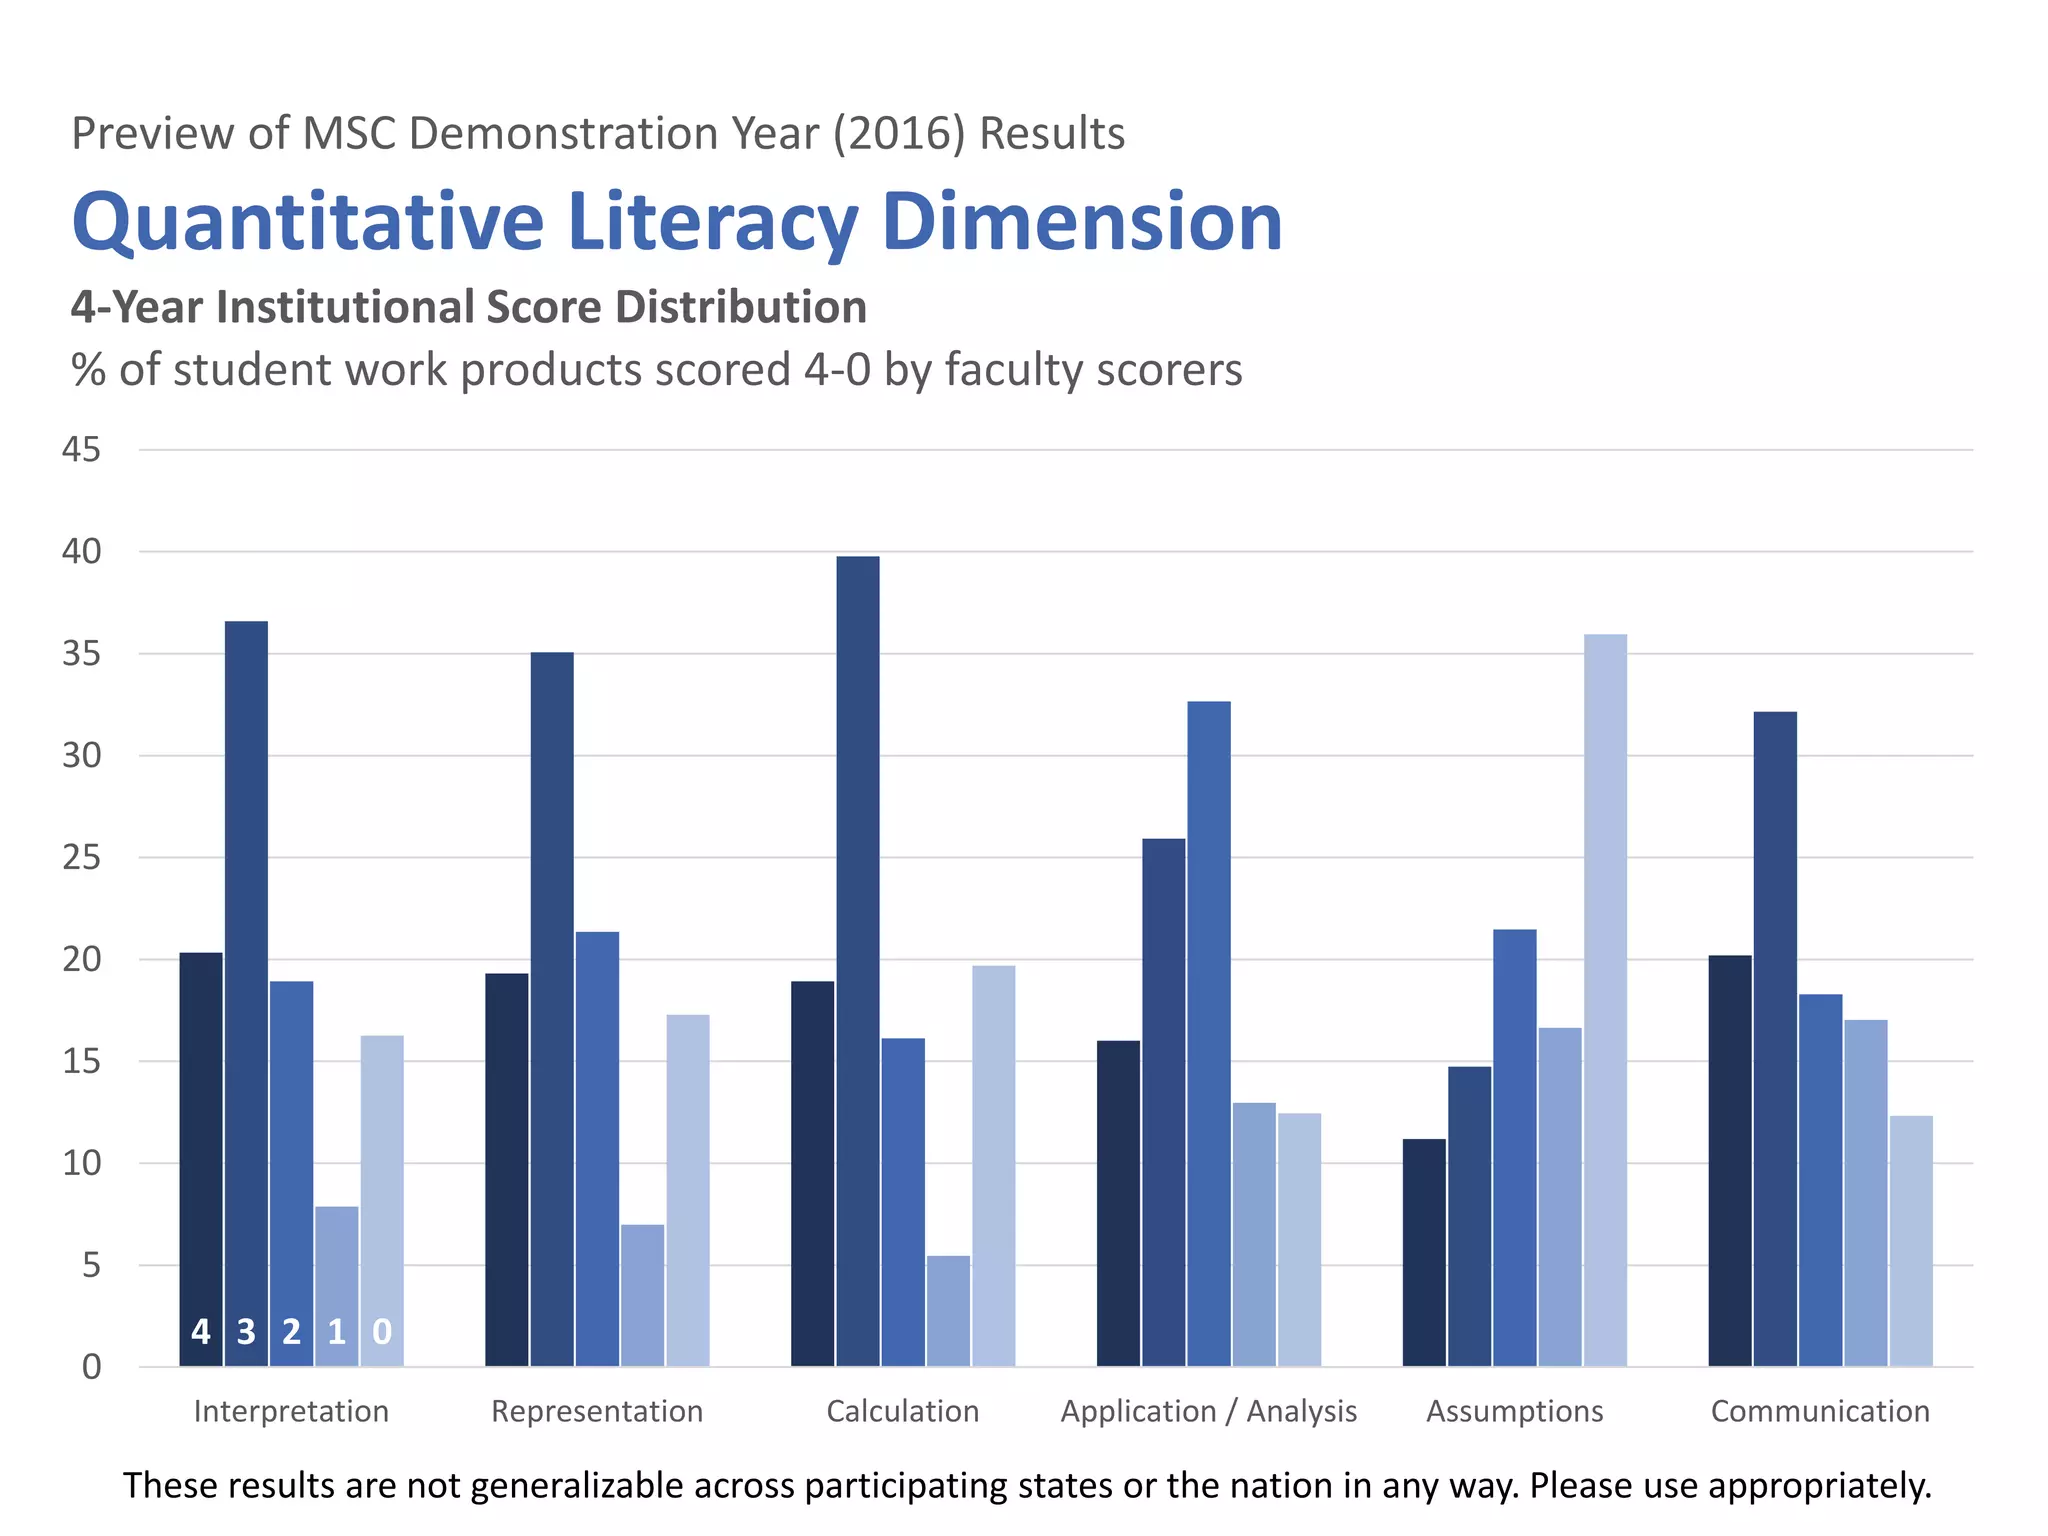
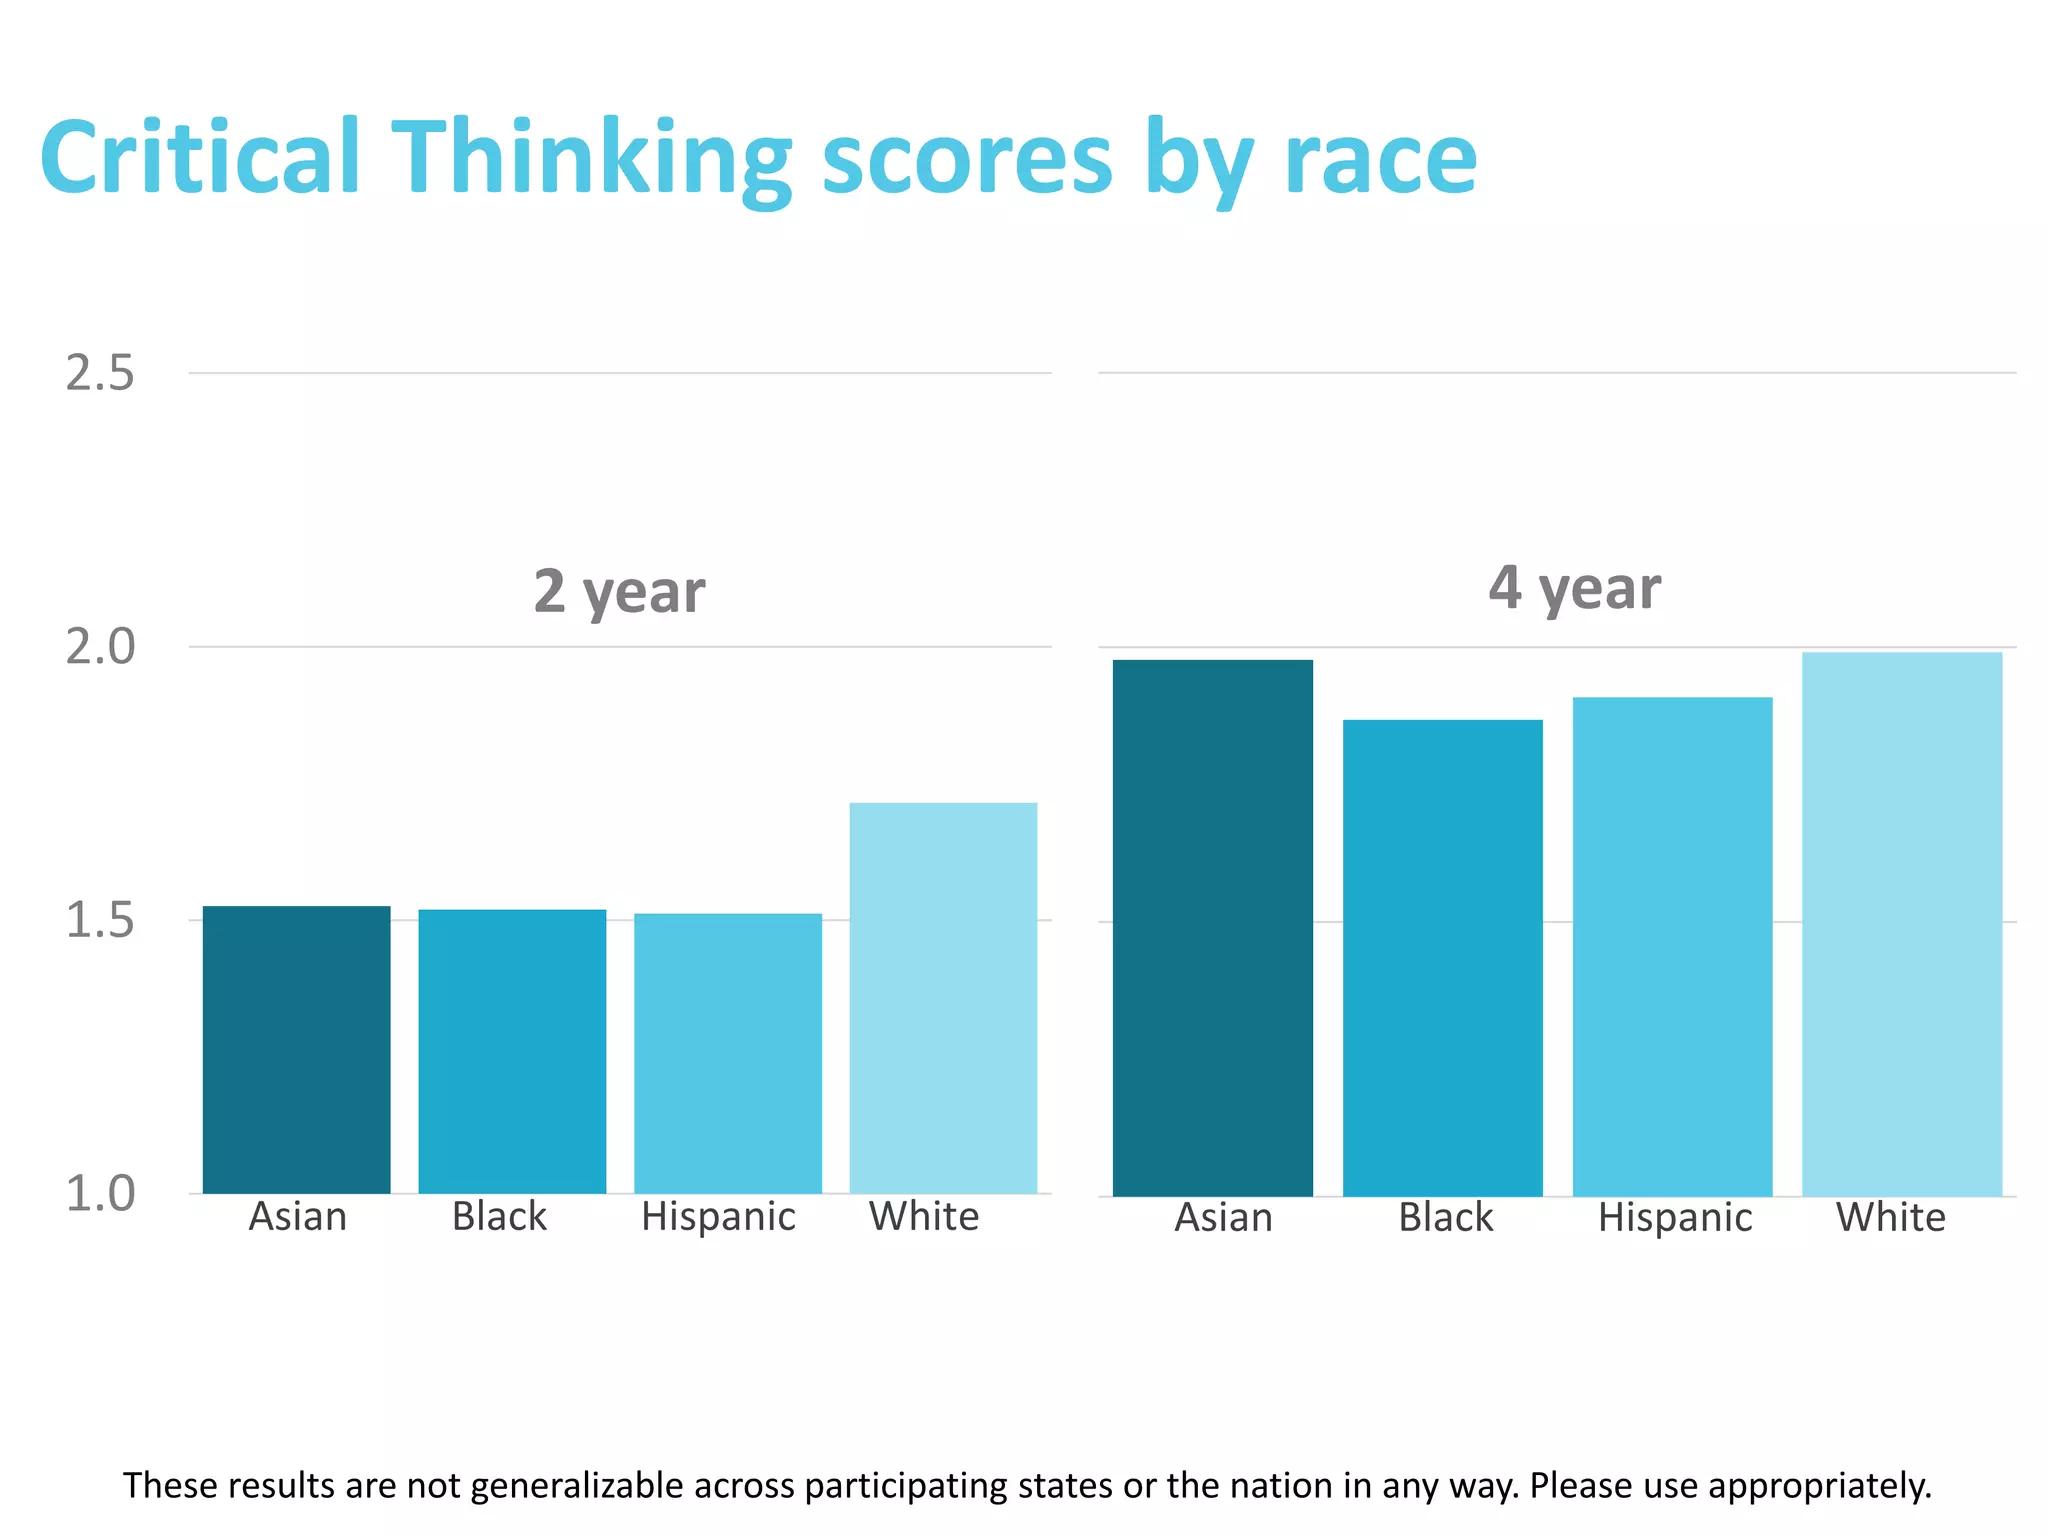
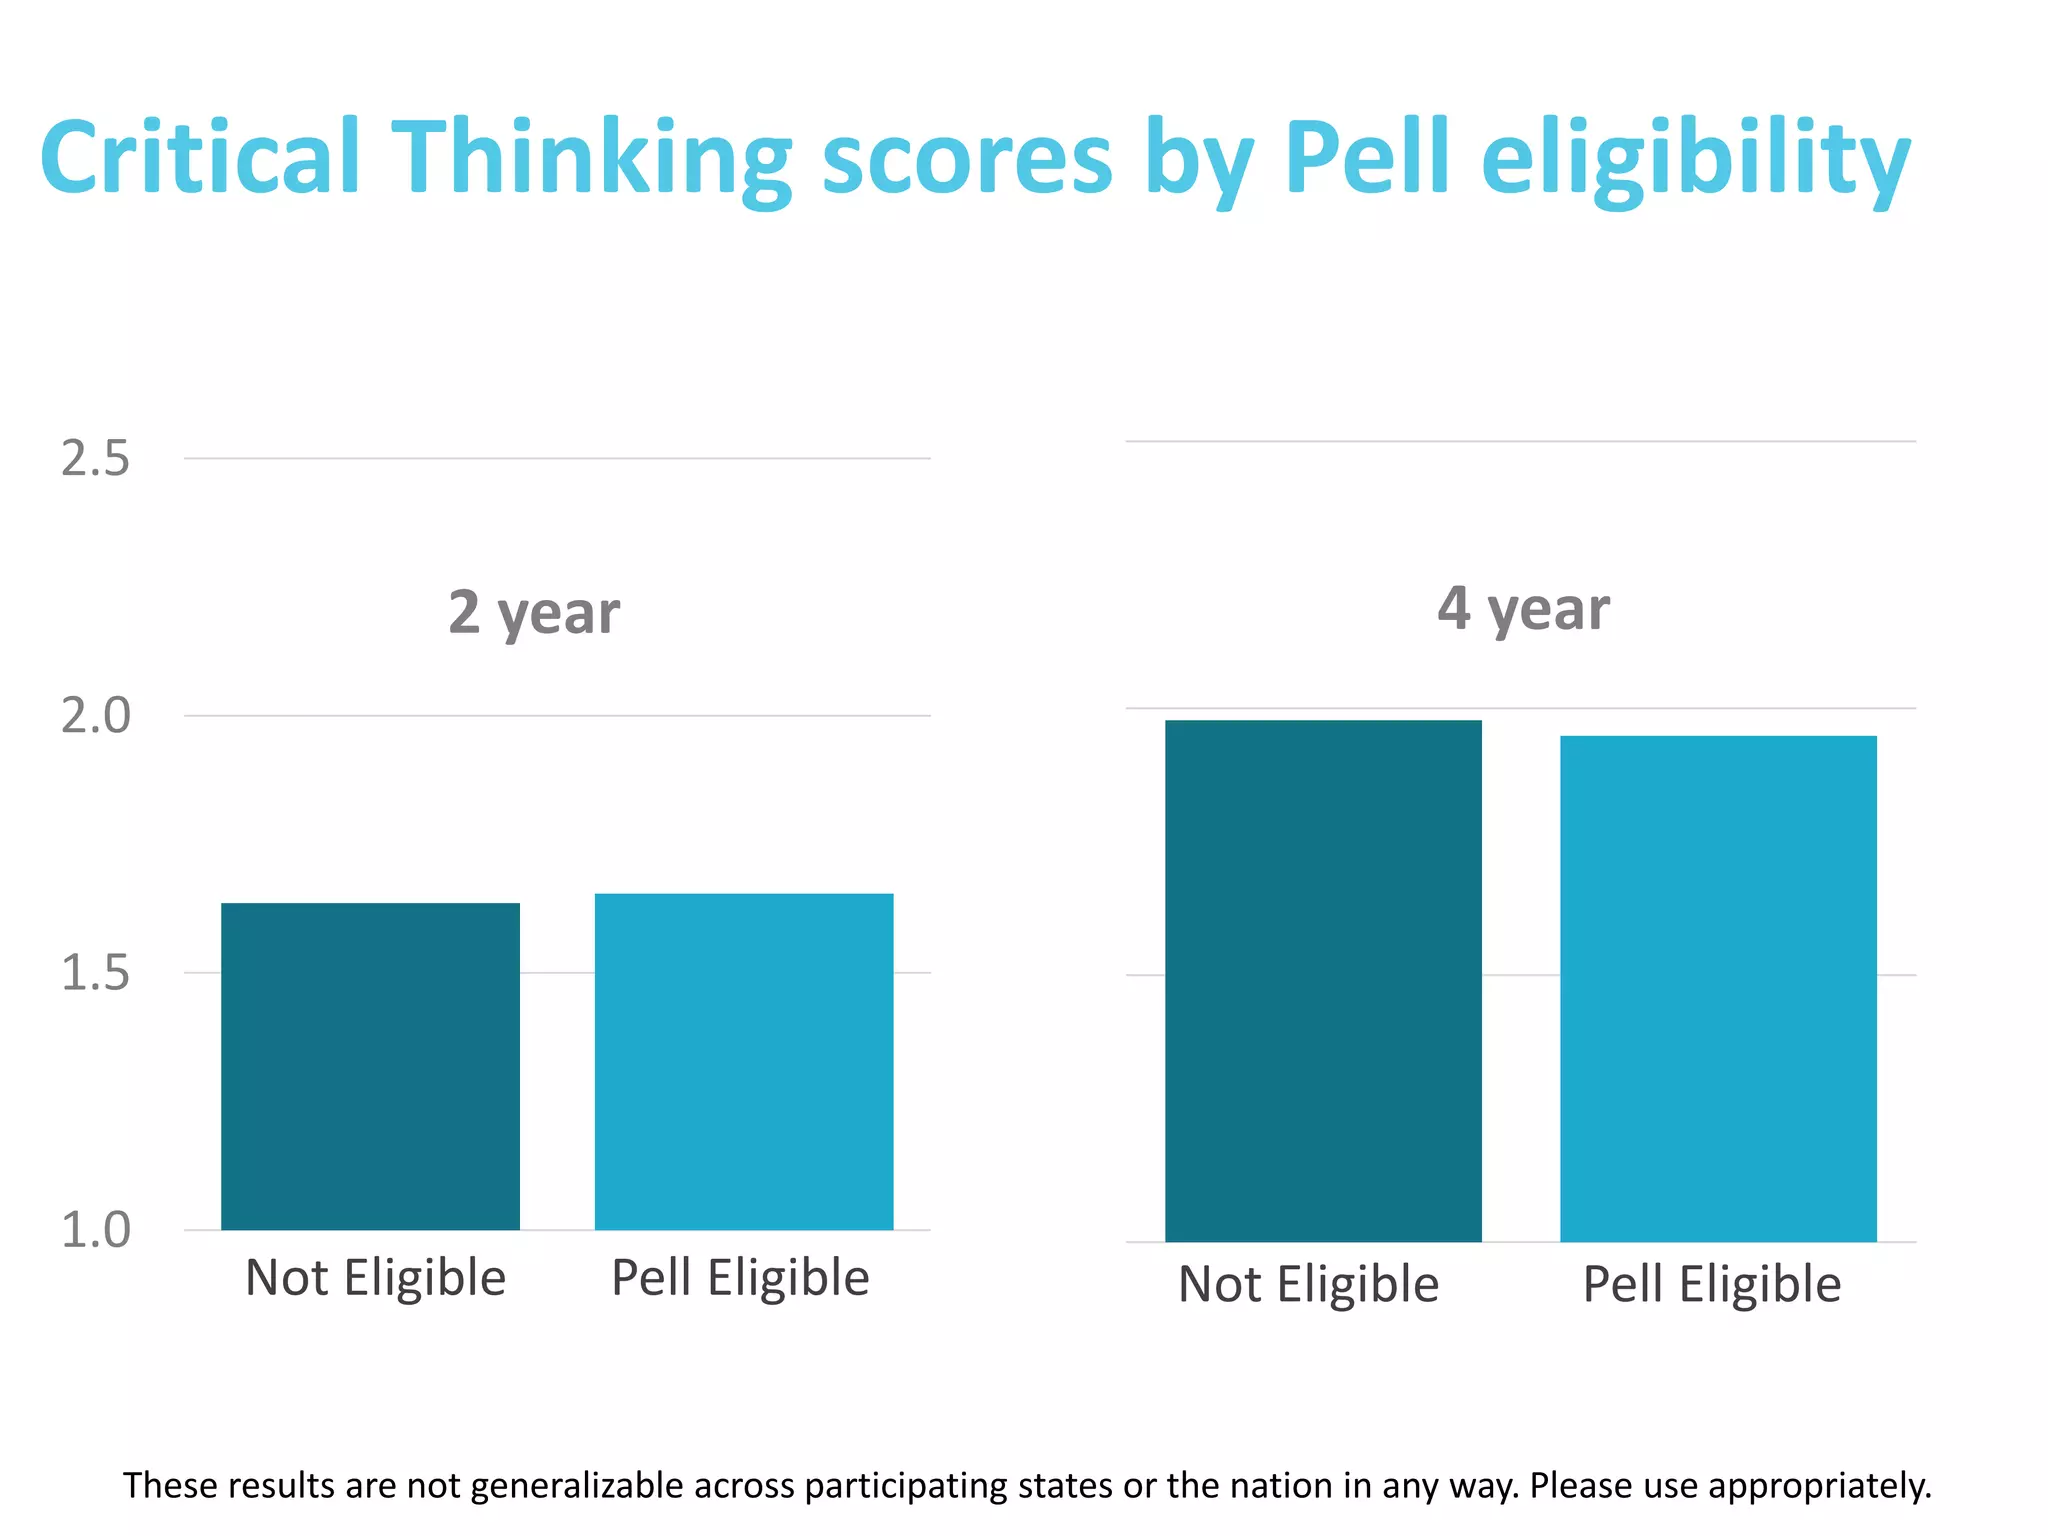
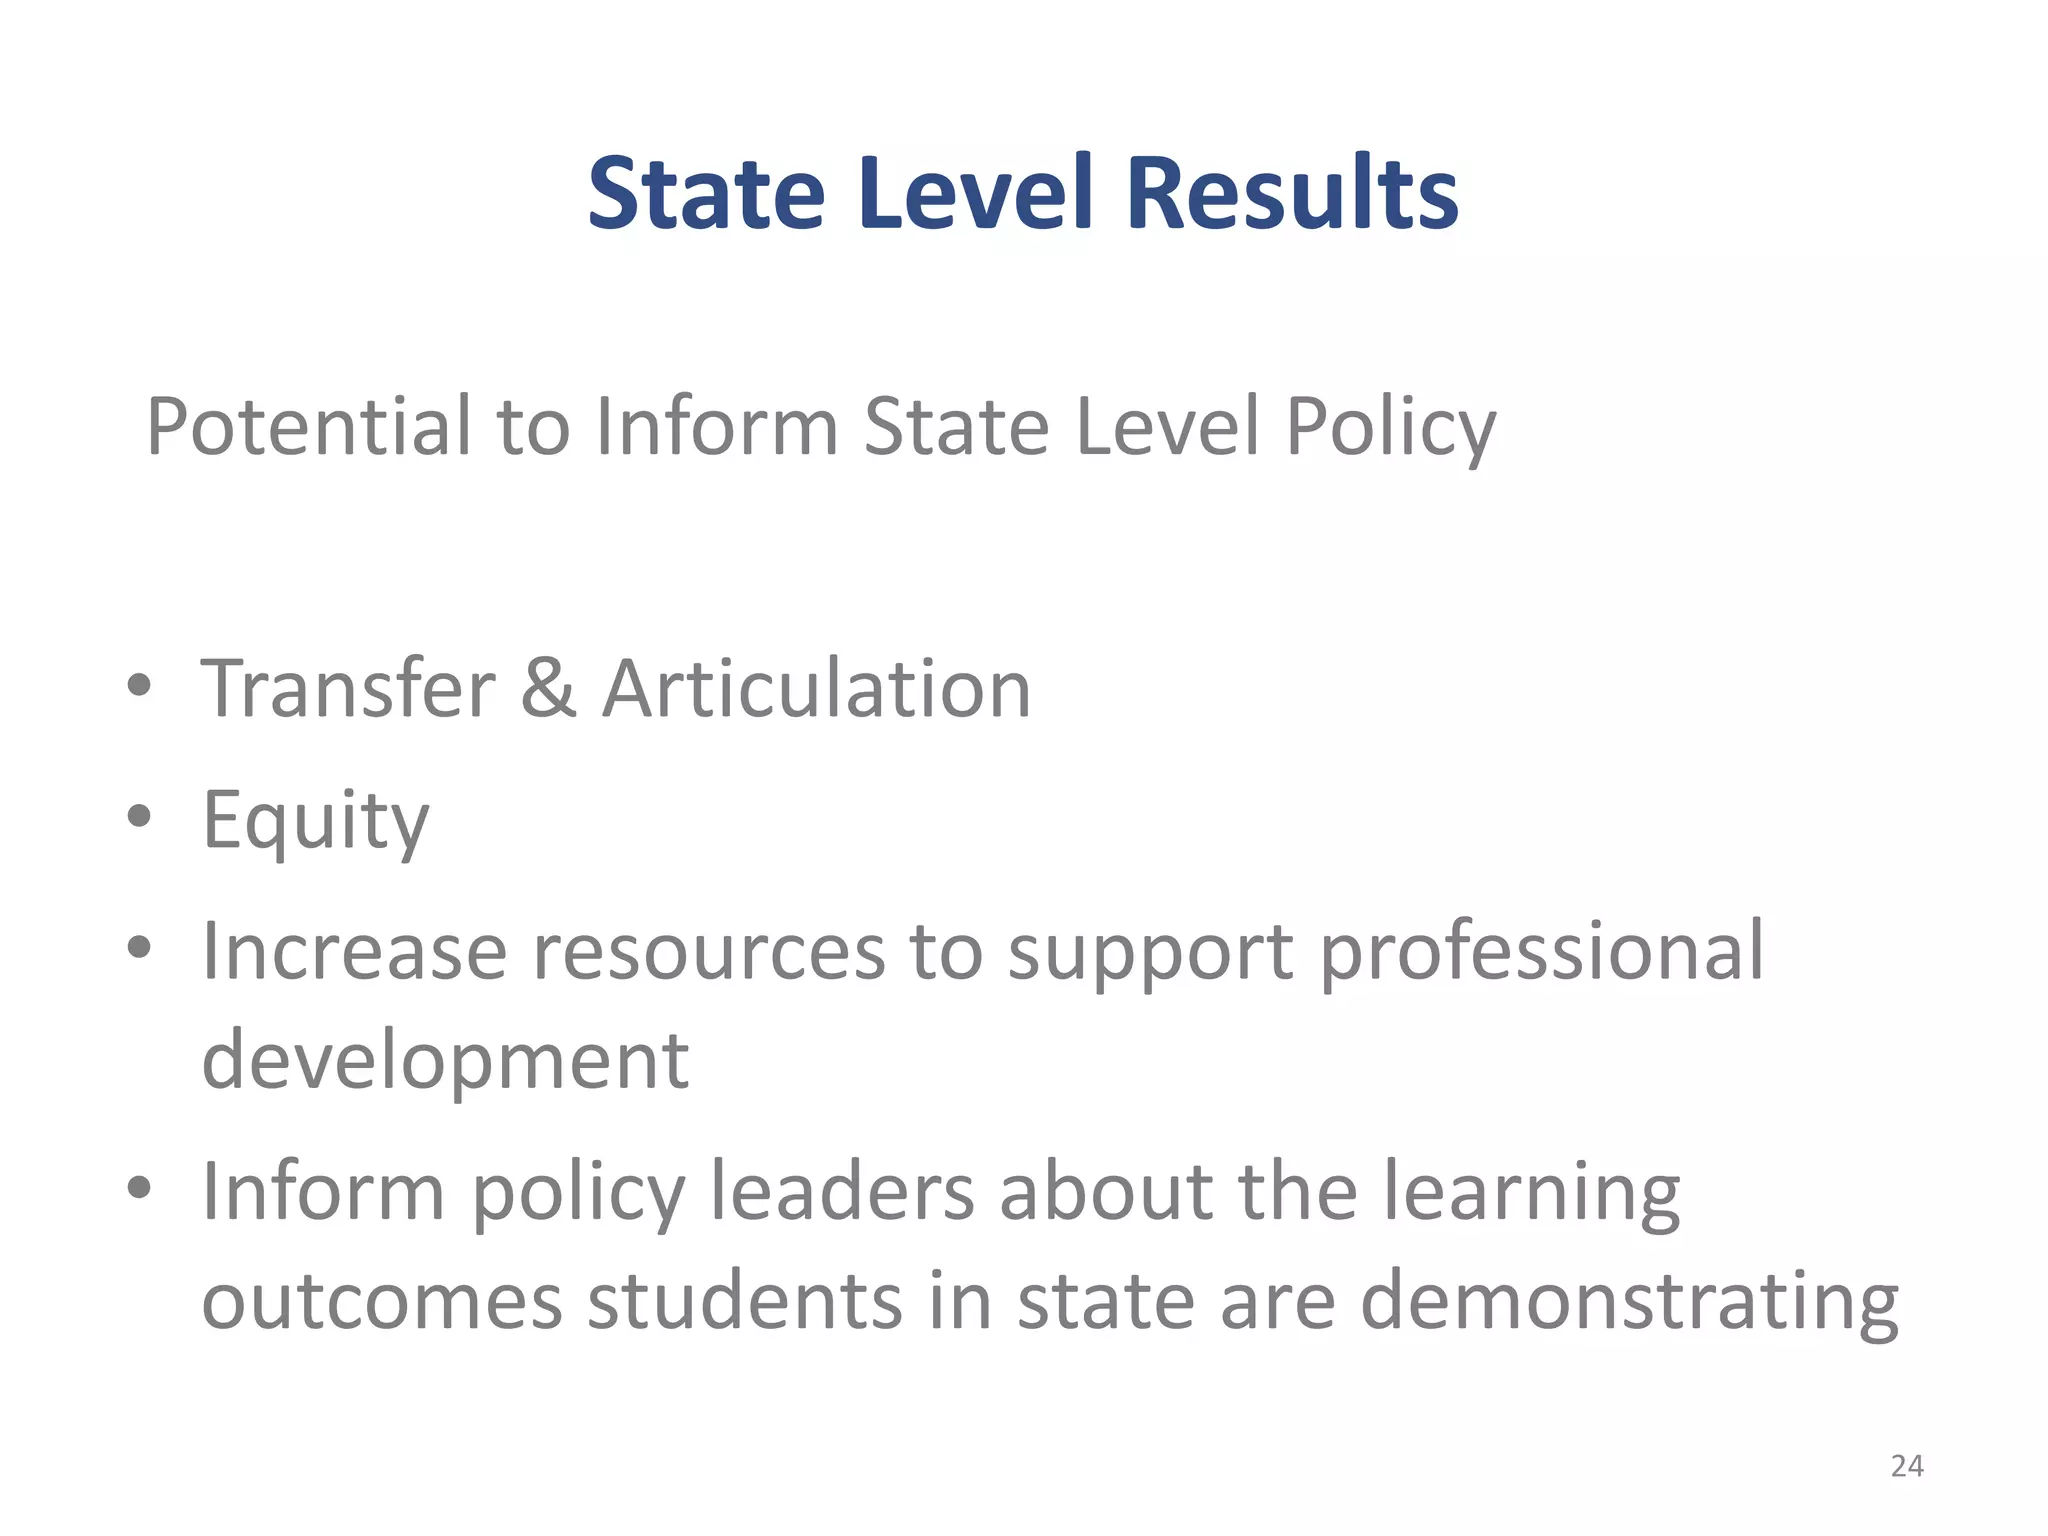
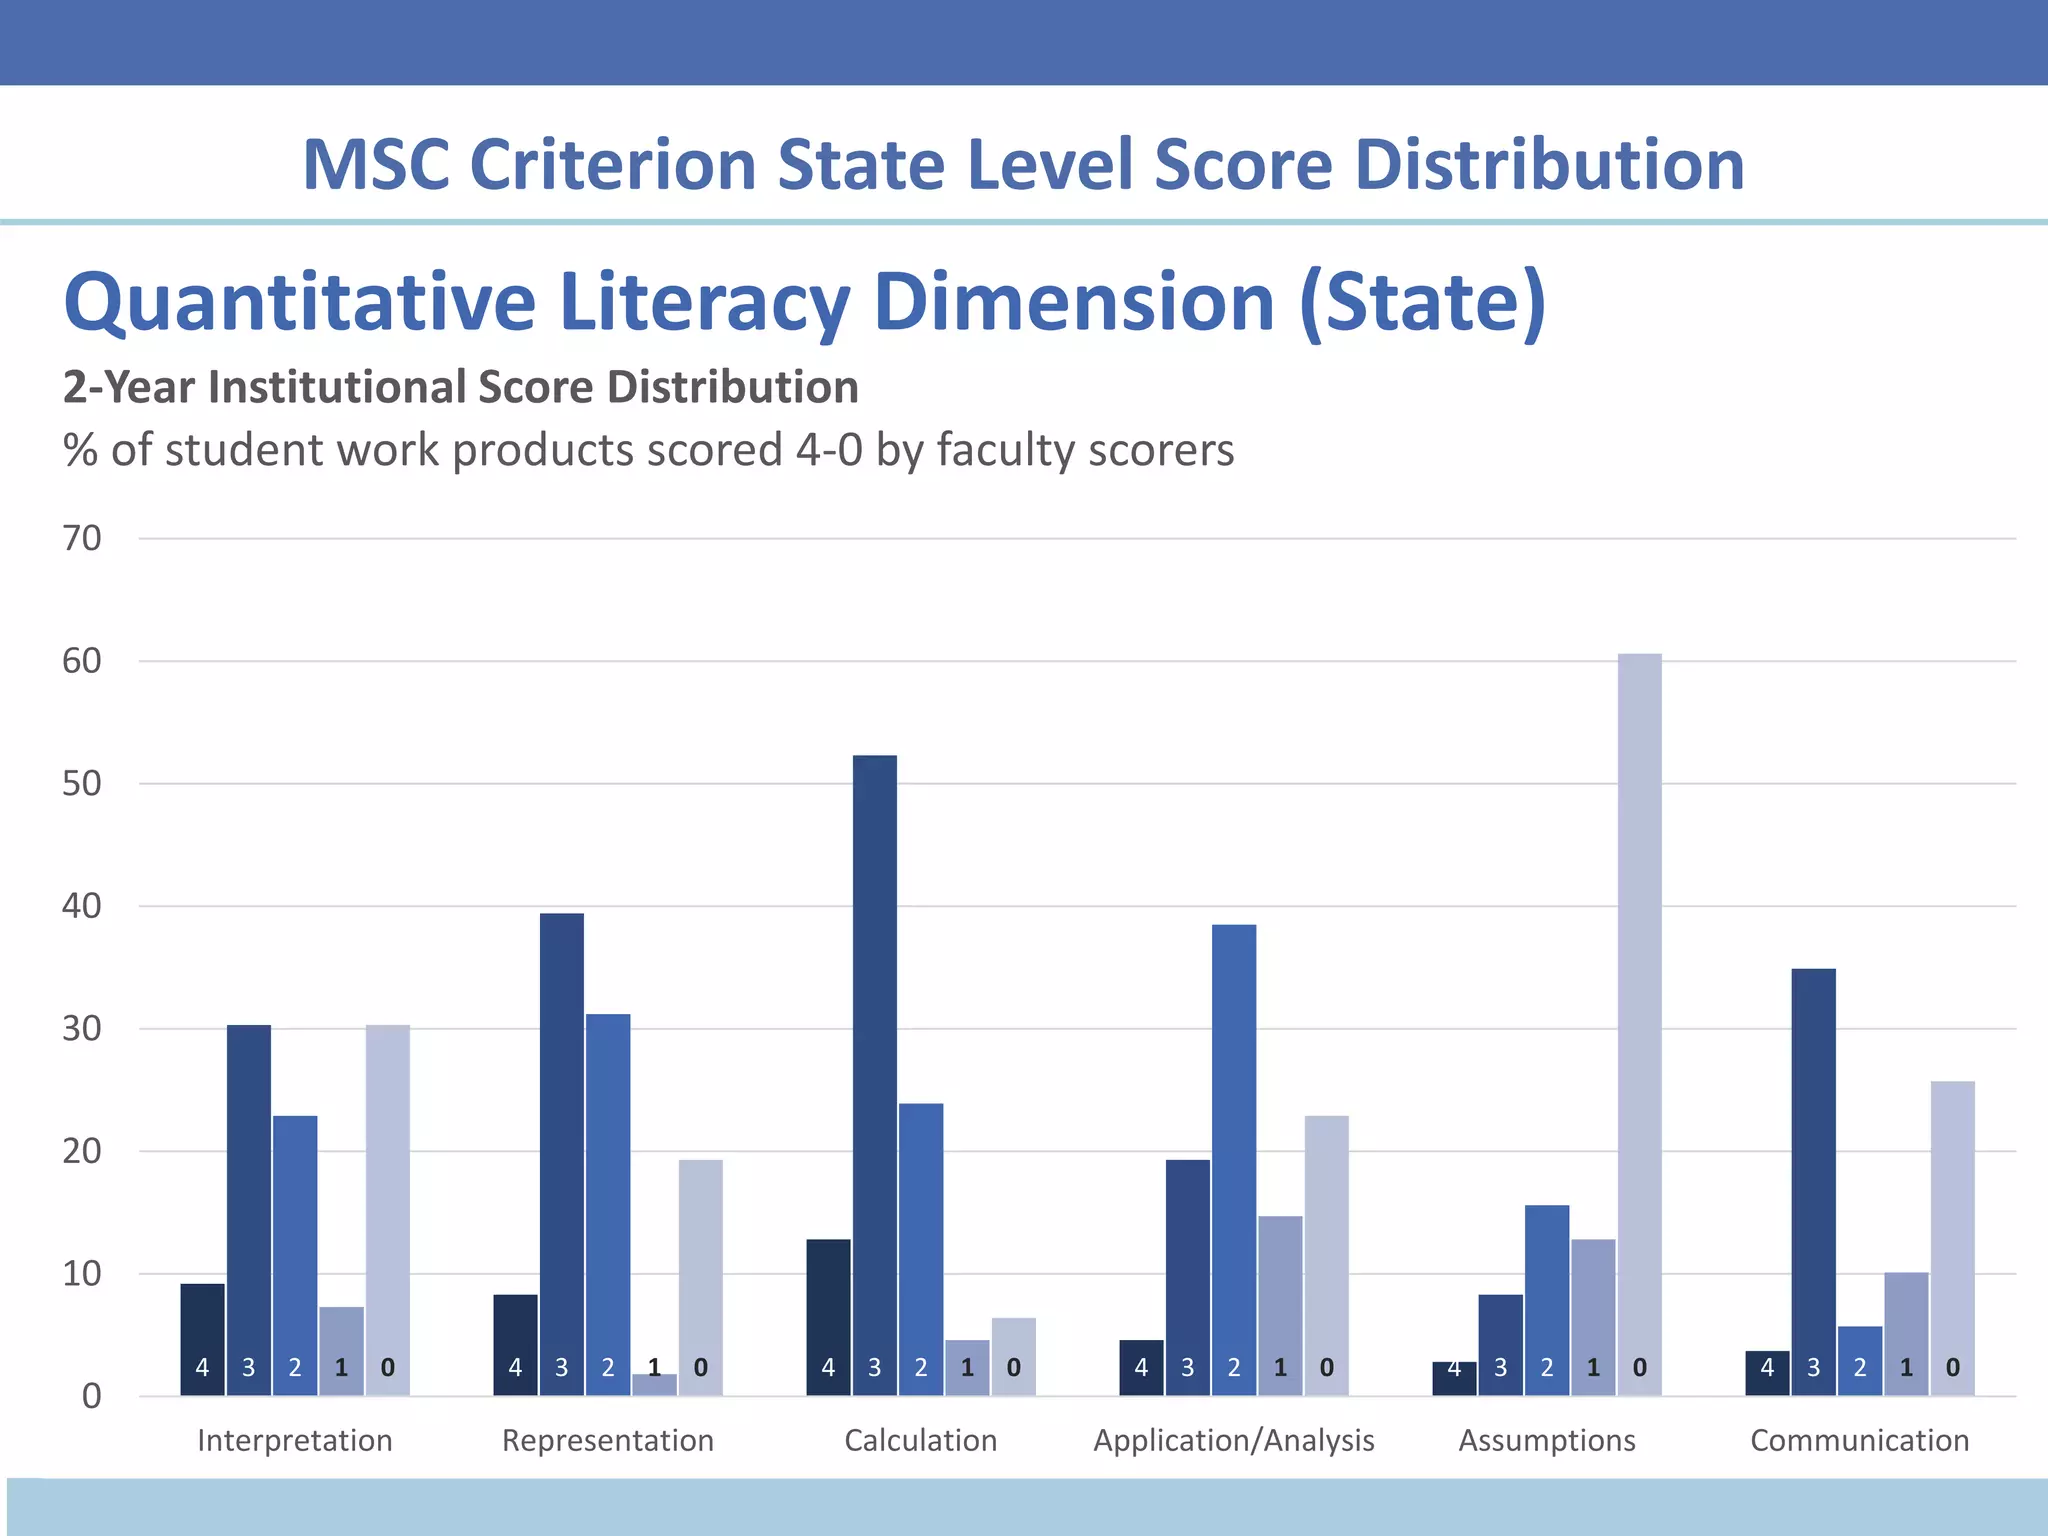
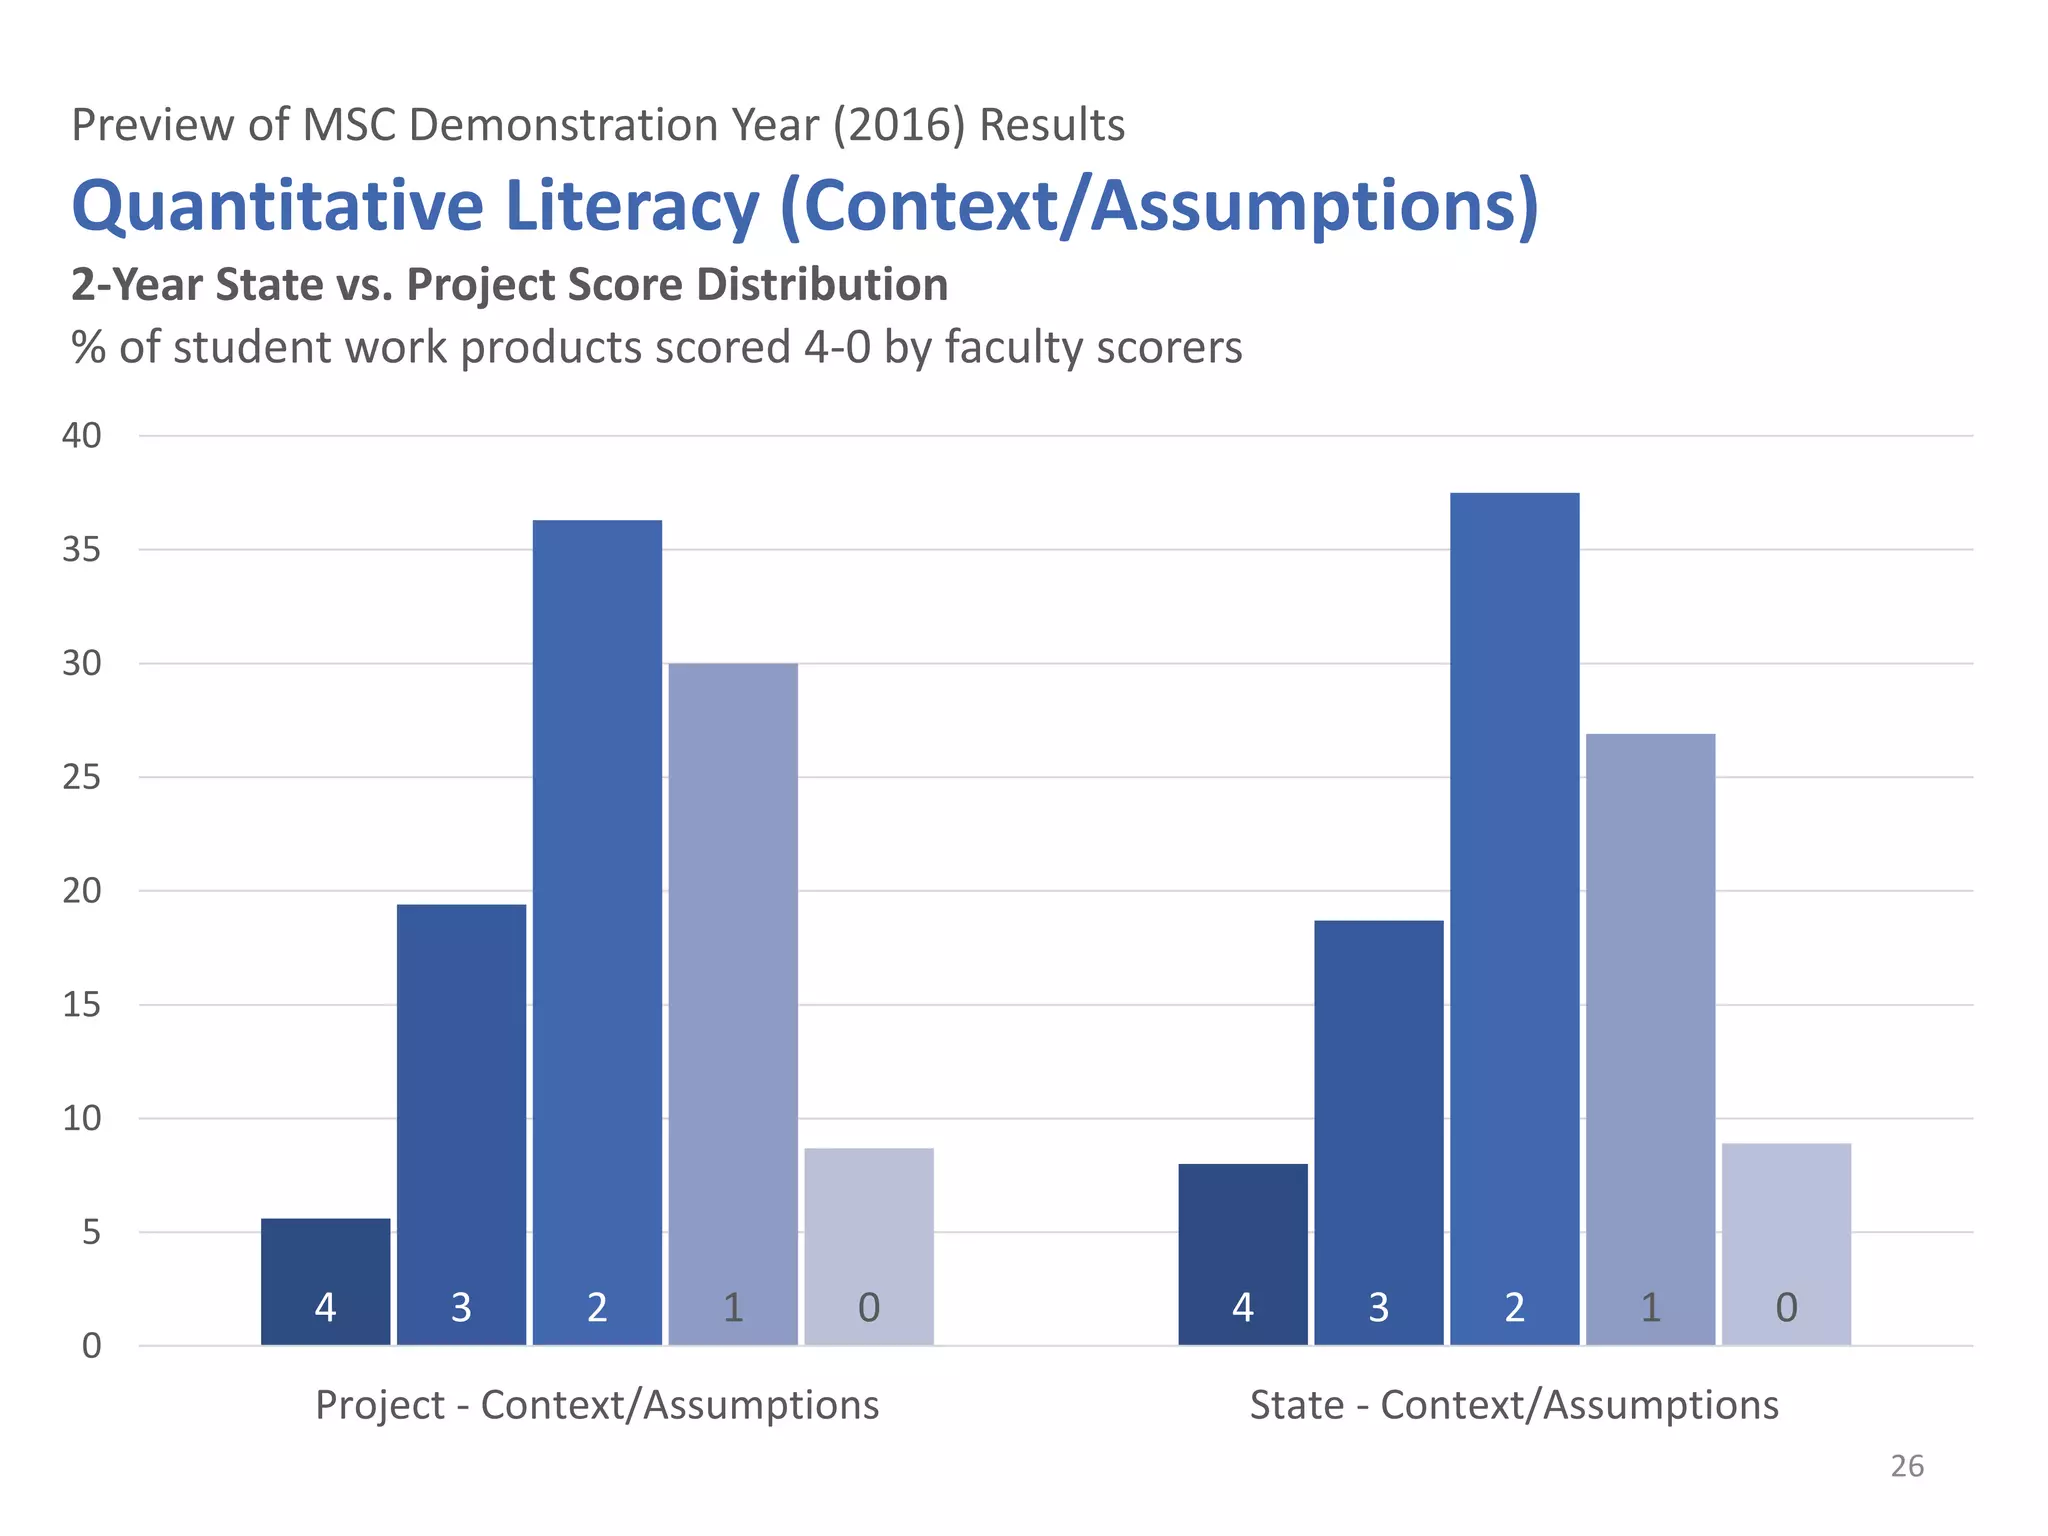
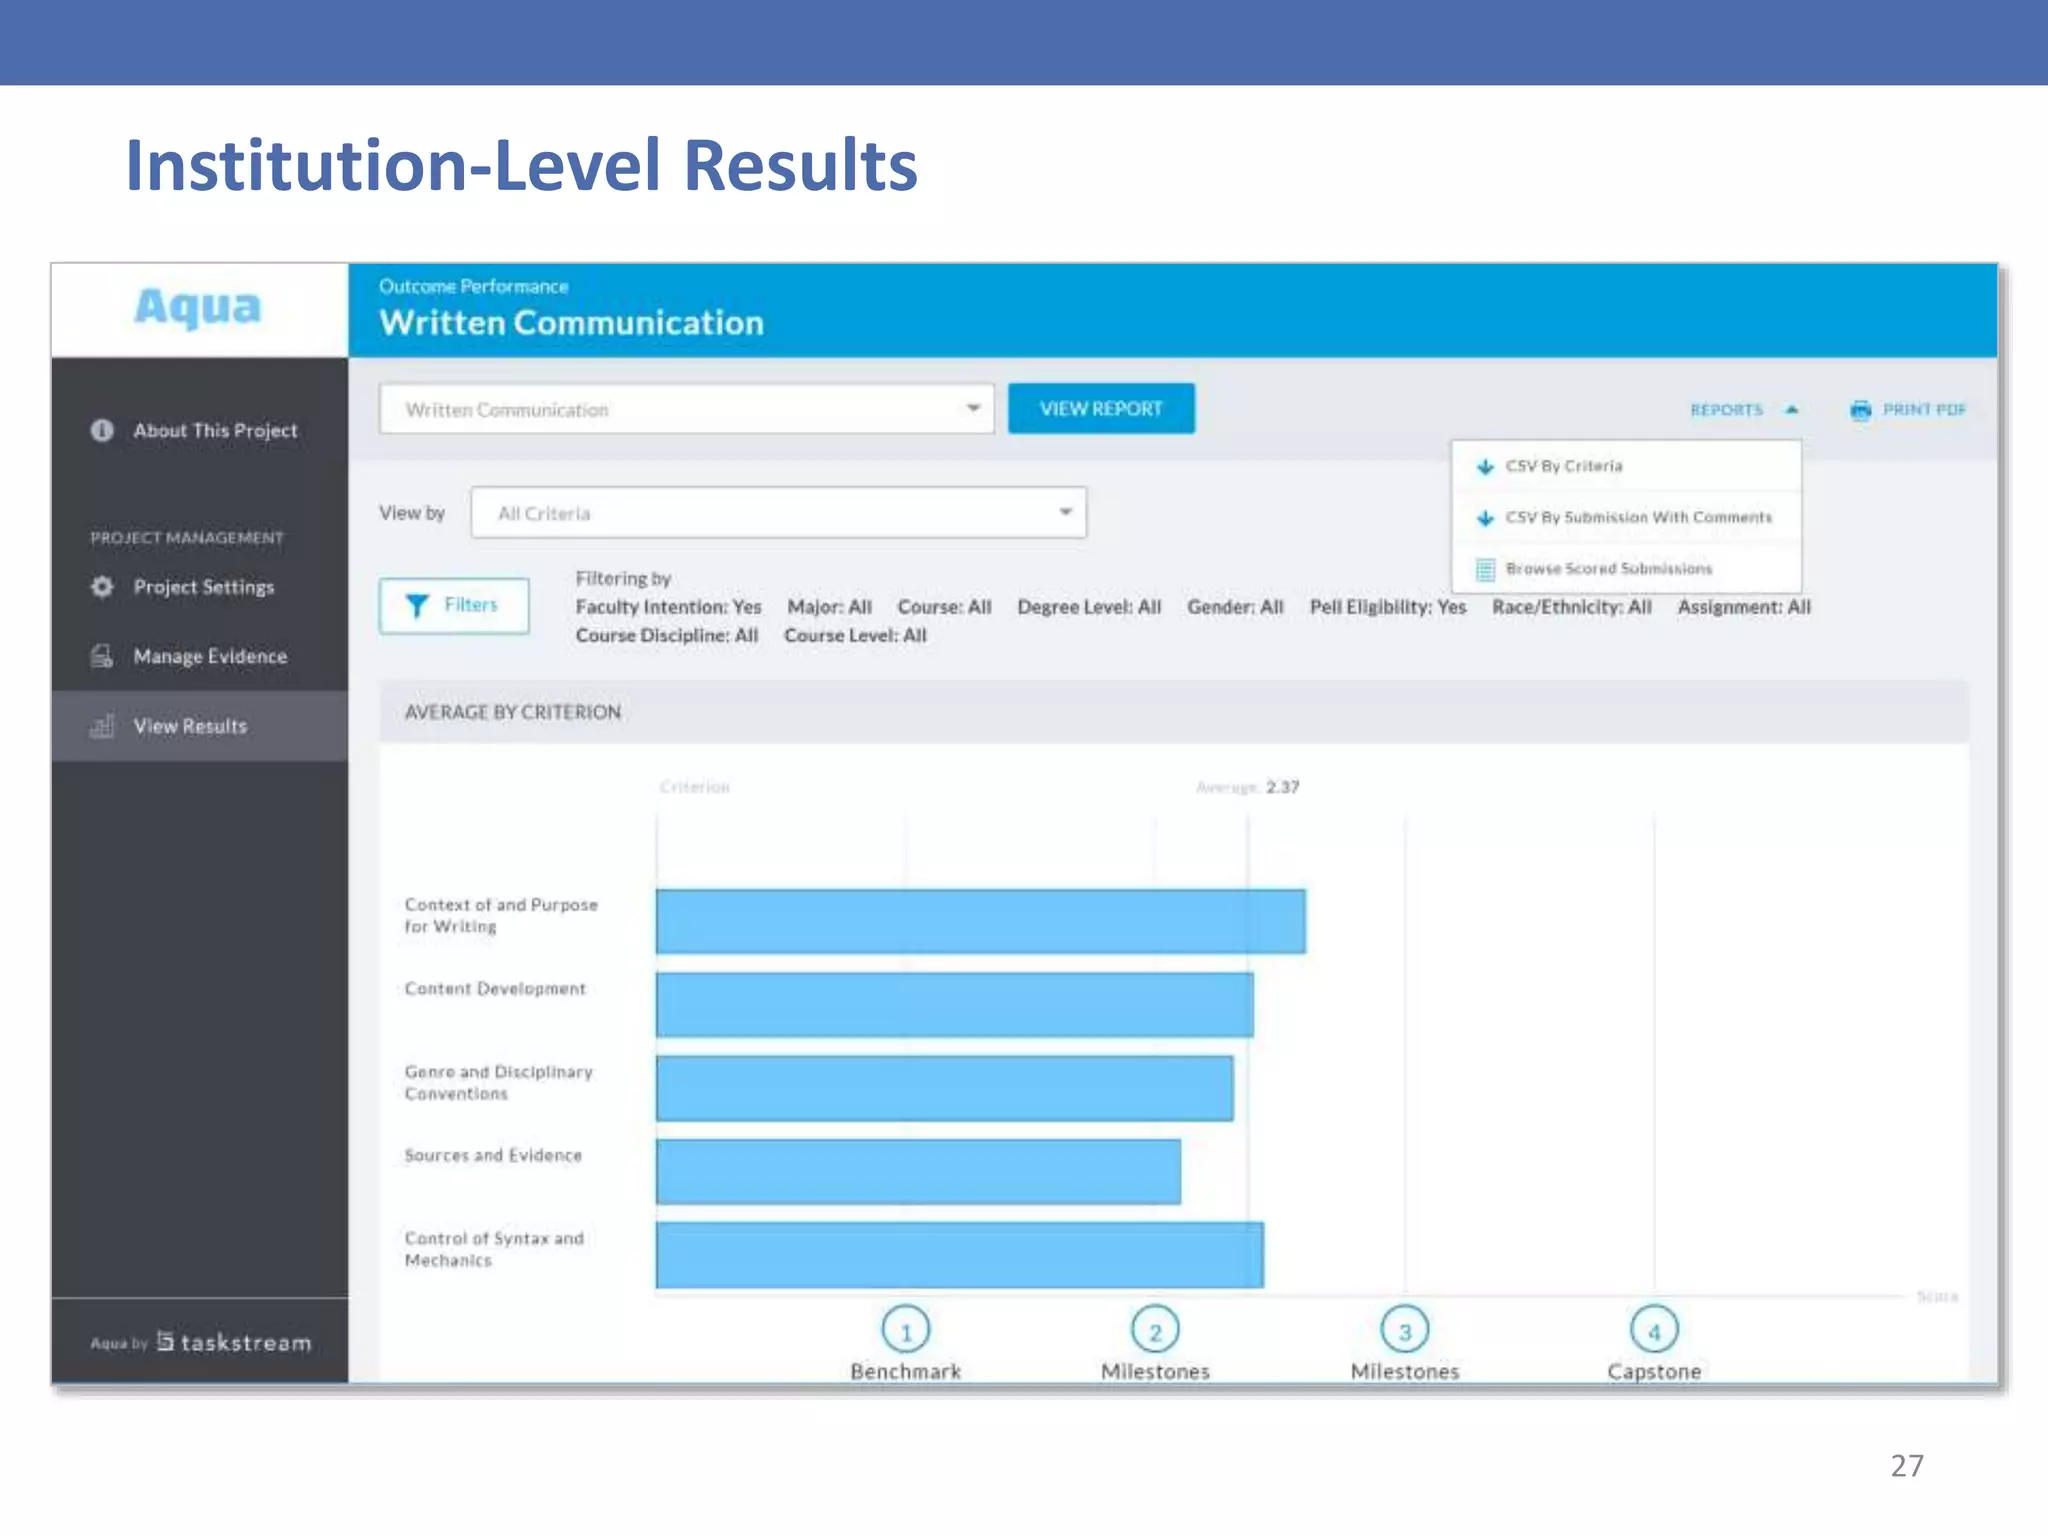
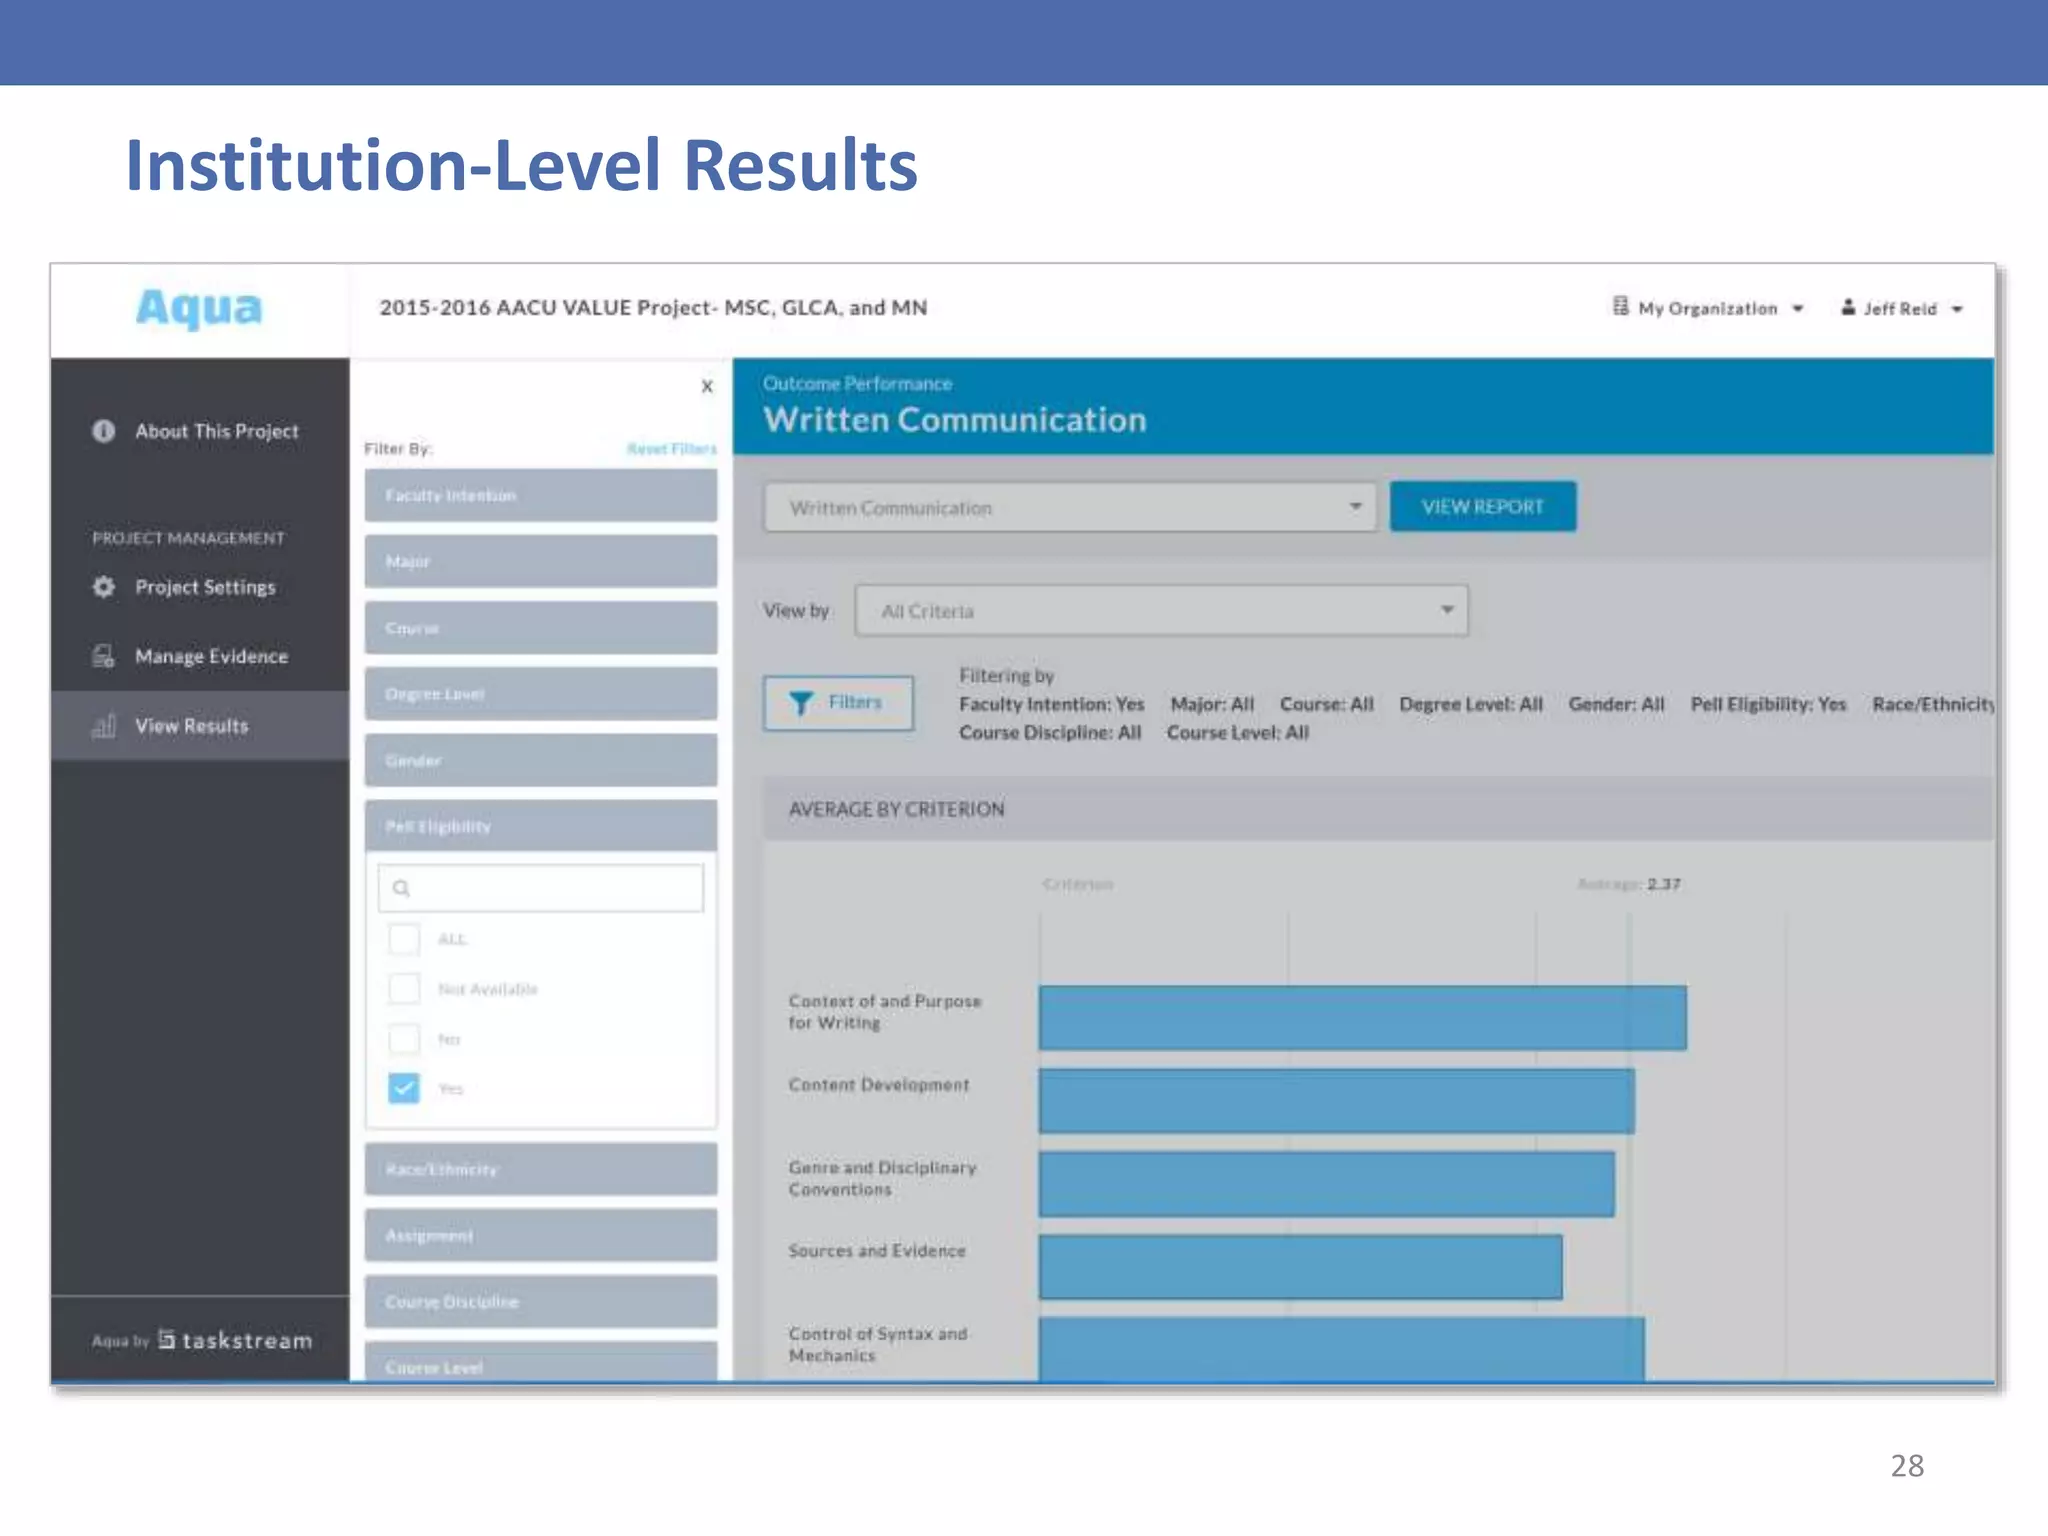
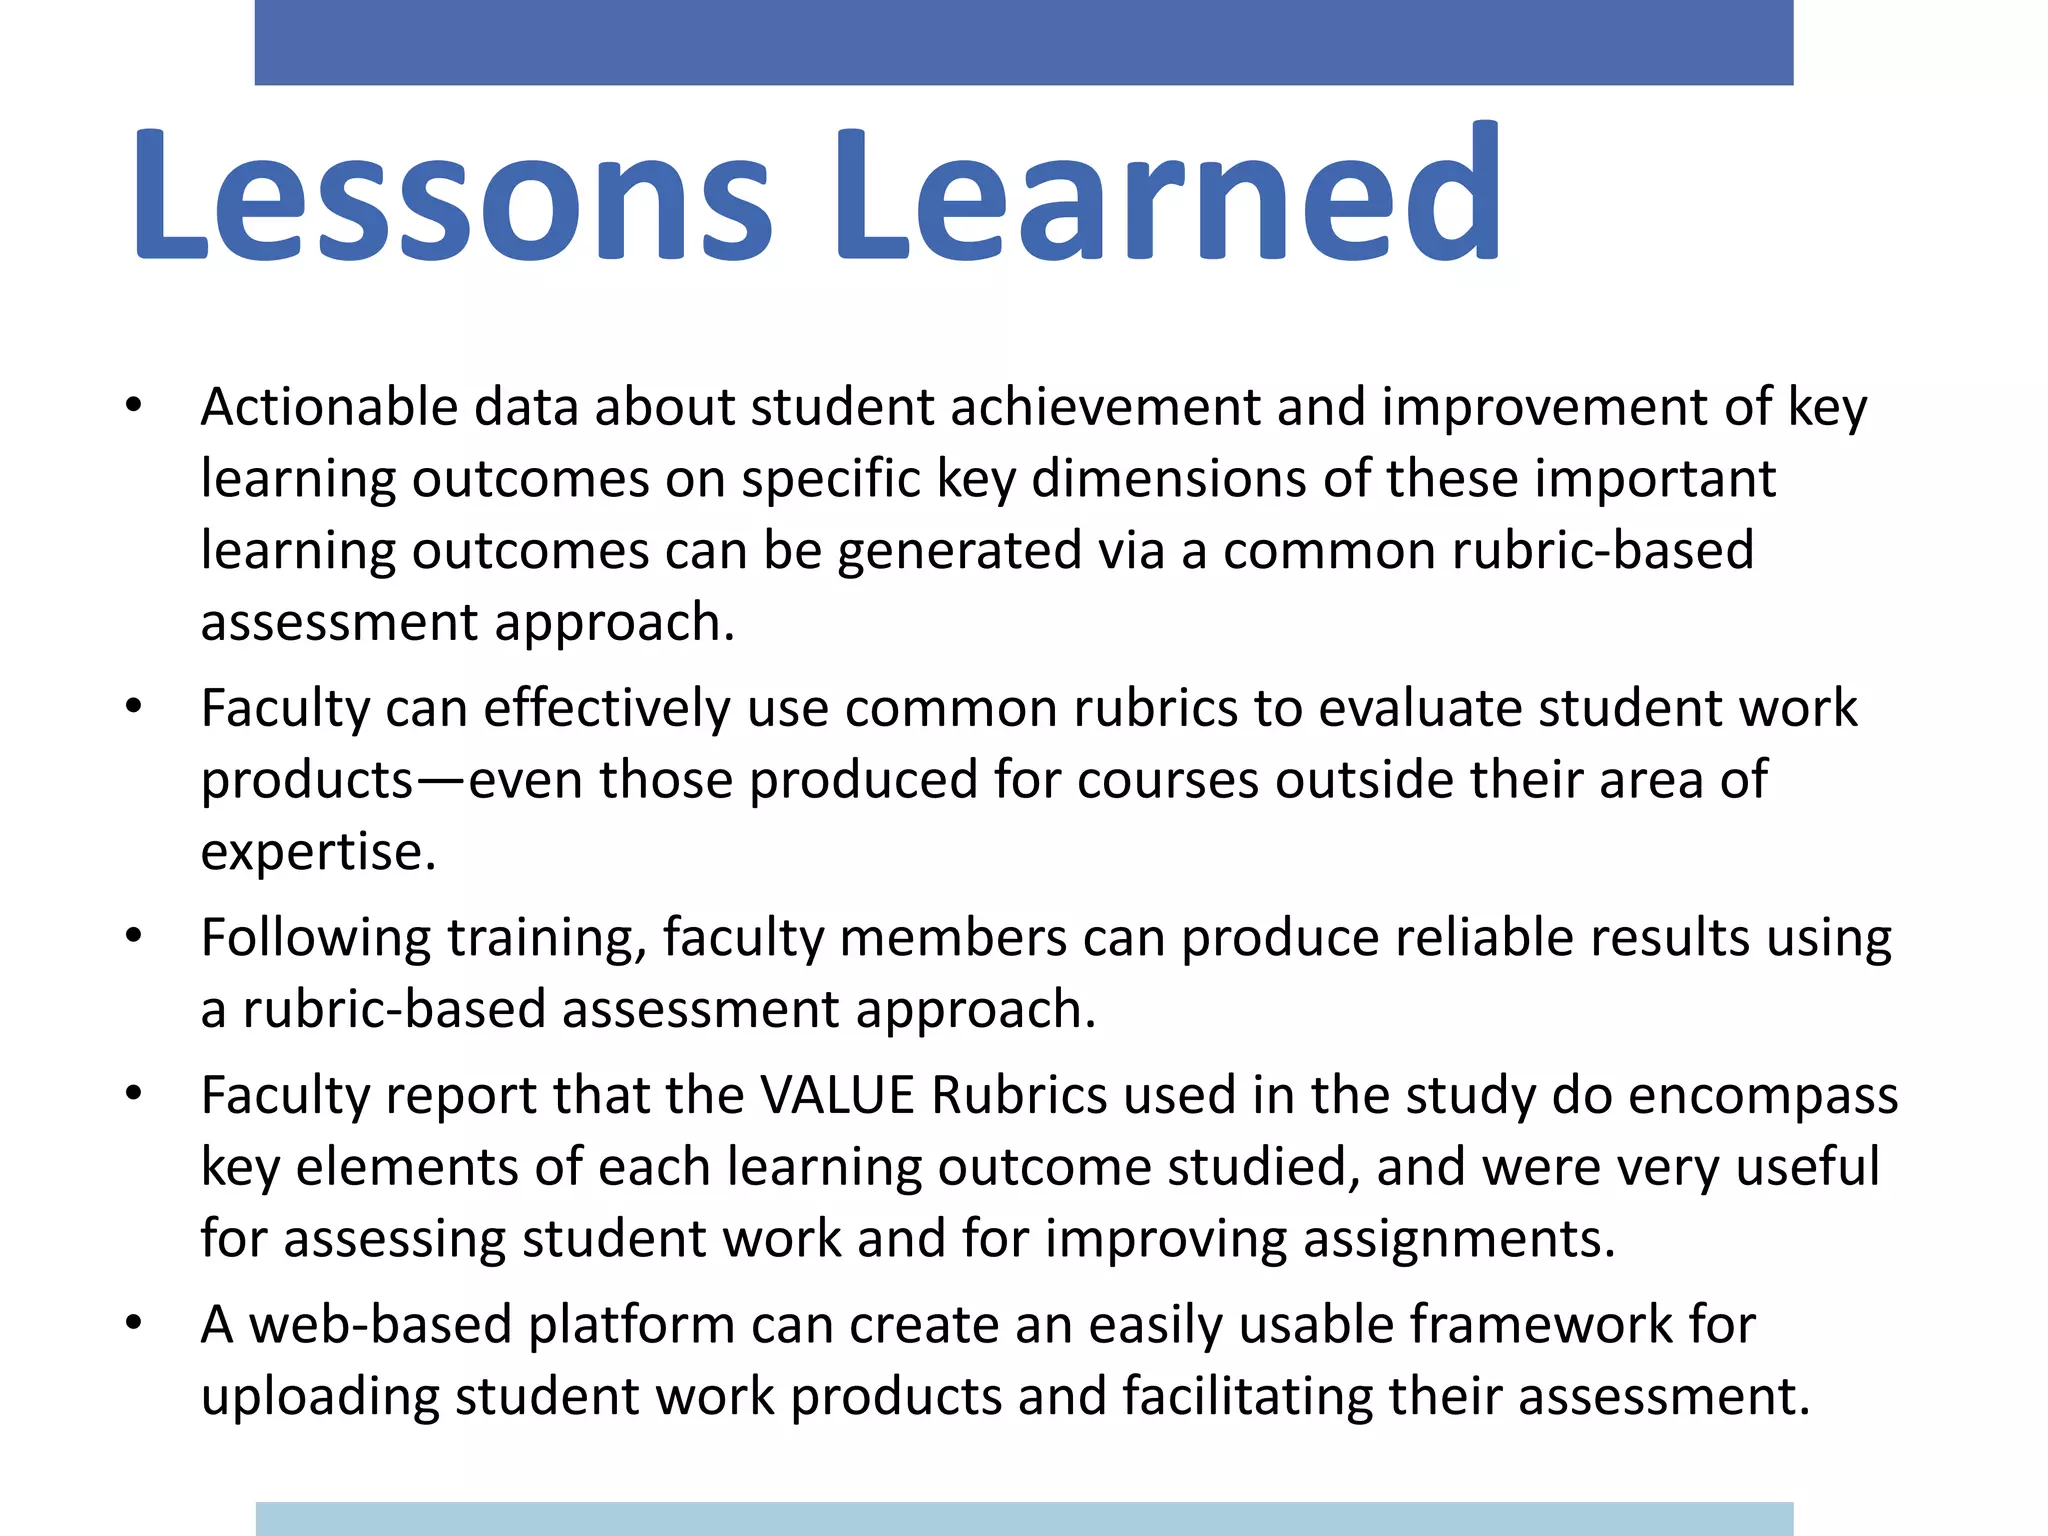
- Results provided actionable data on student achievement and areas for improvement in critical thinking, quantitative literacy, and other skills.
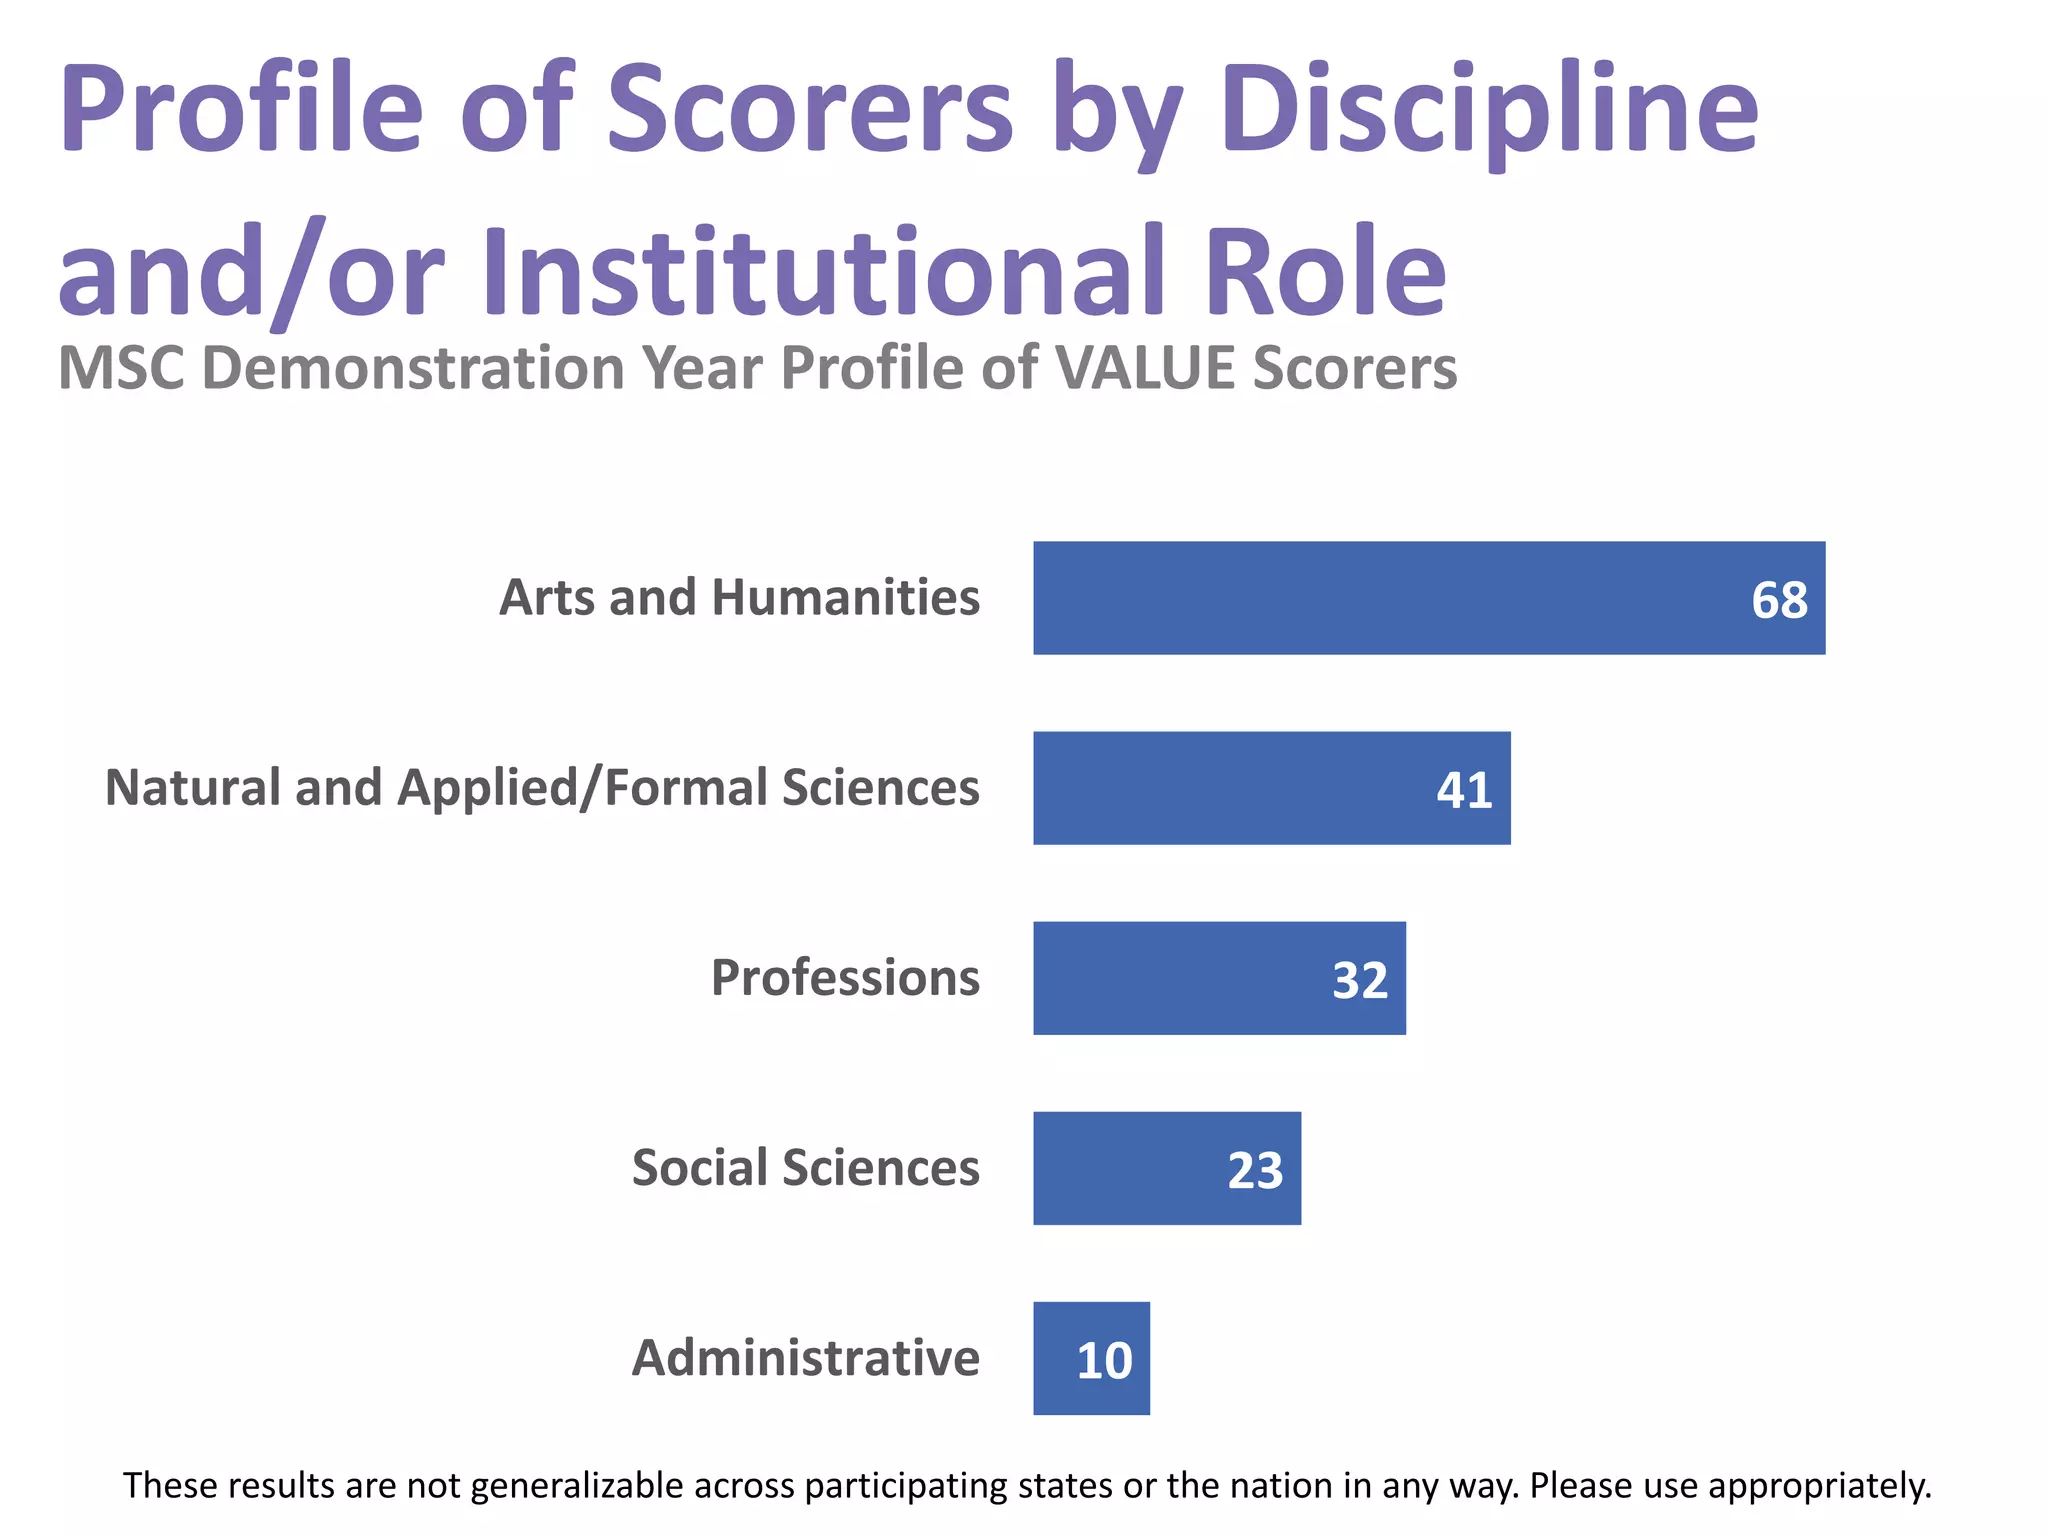
- Faculty reliably scored student work from other institutions and disciplines after training.
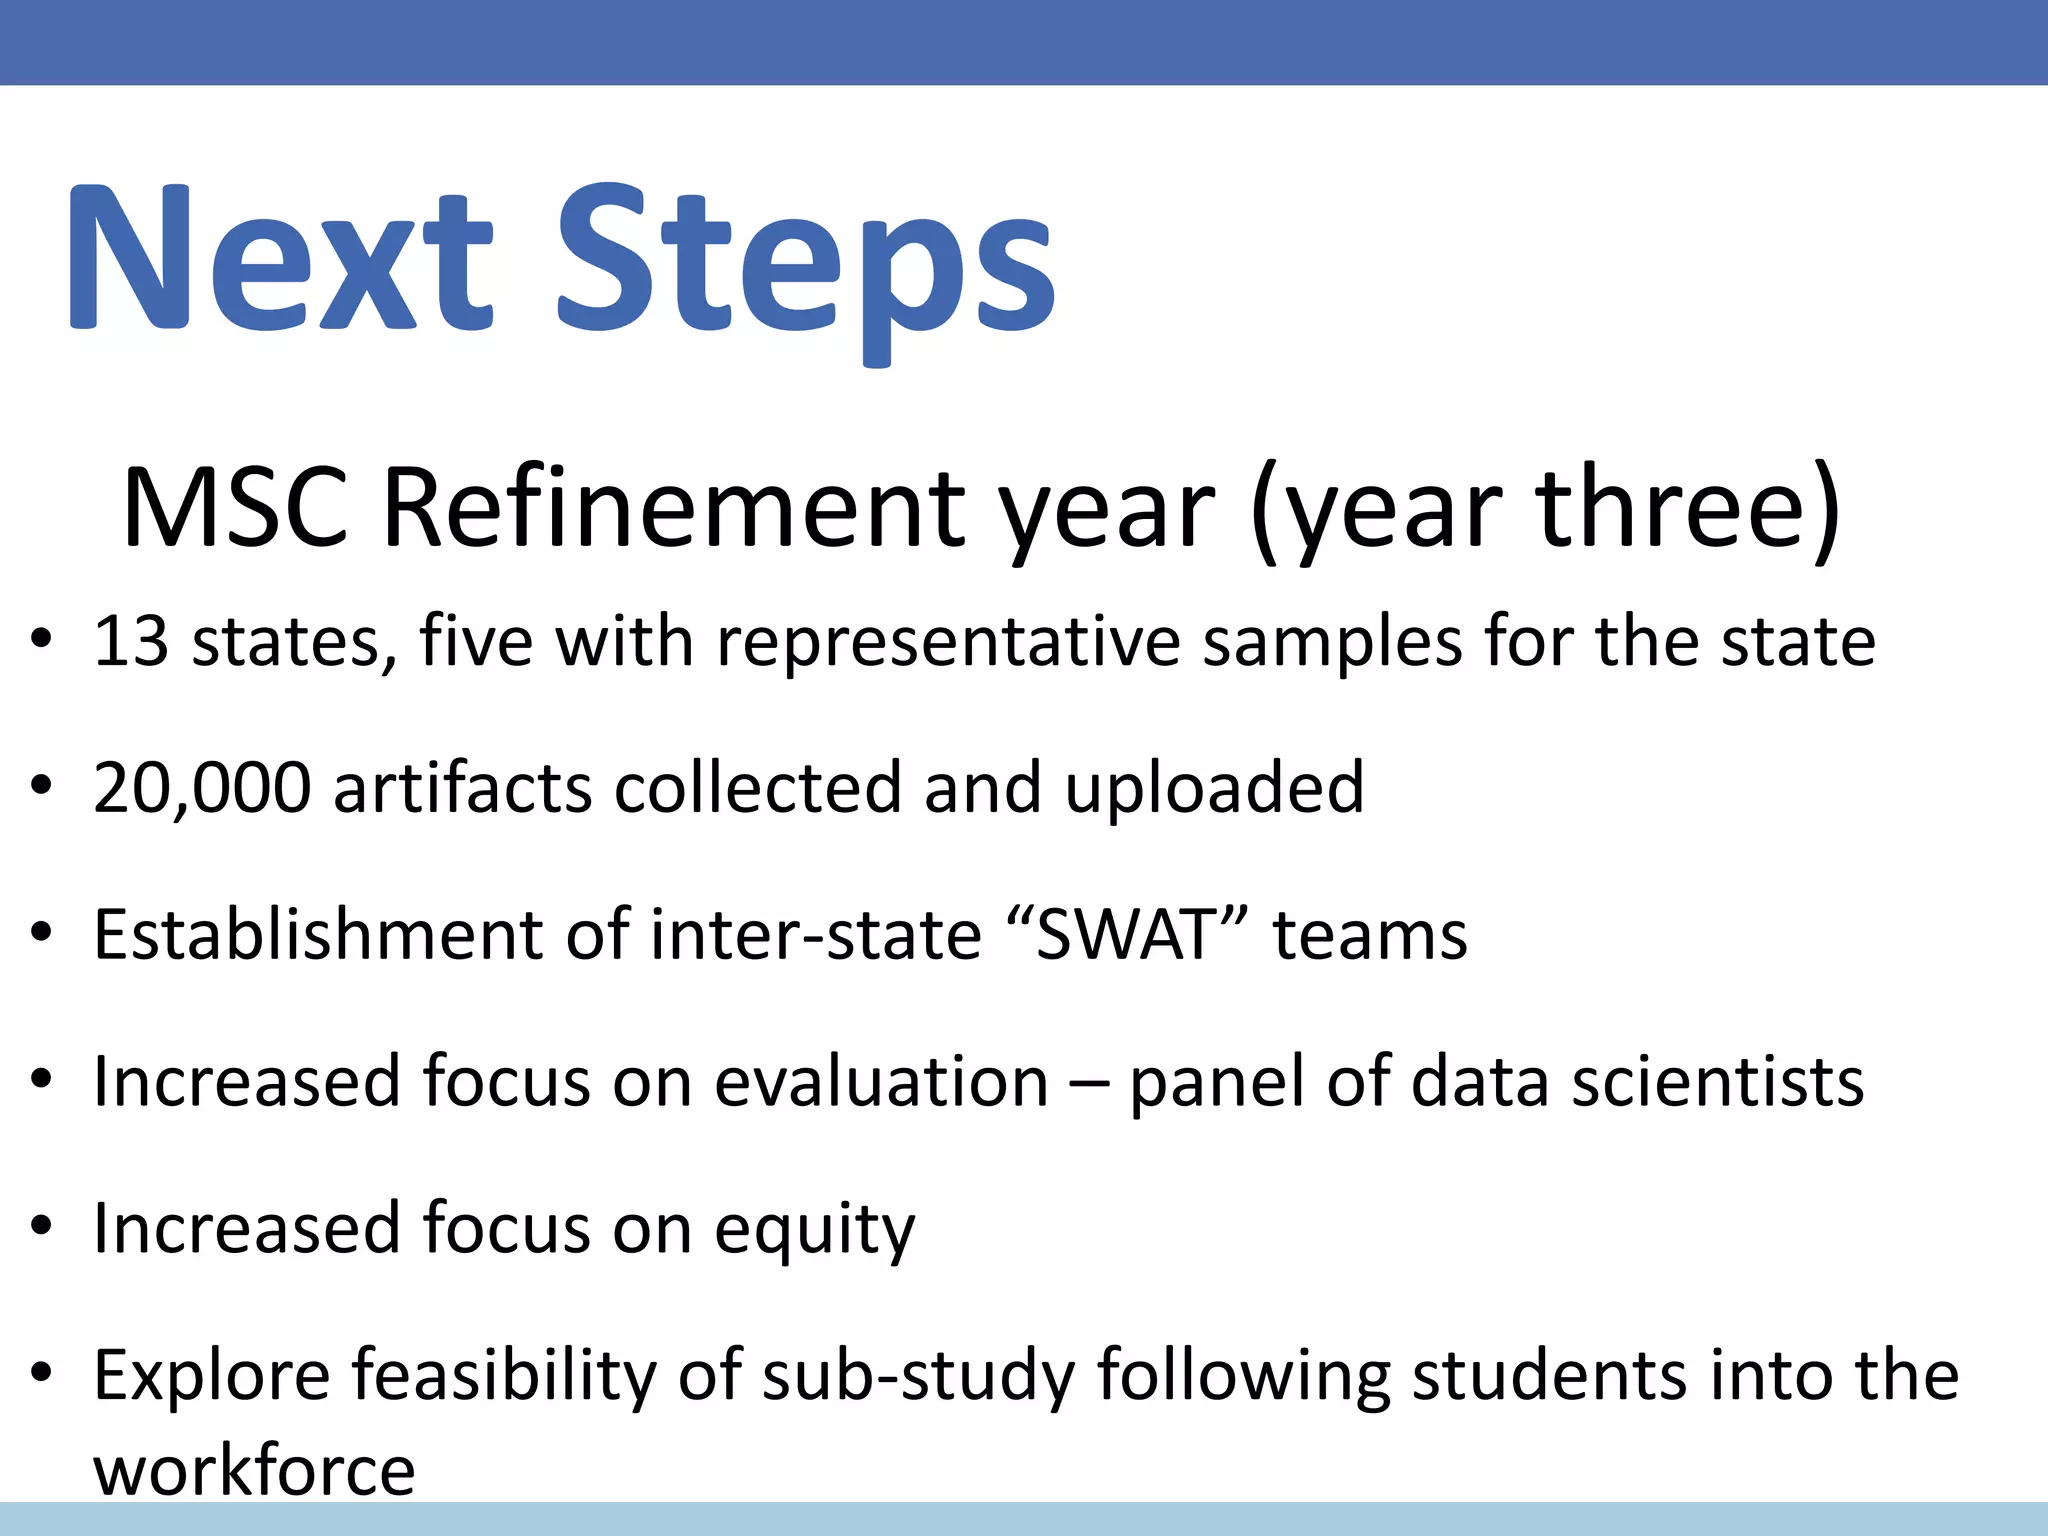
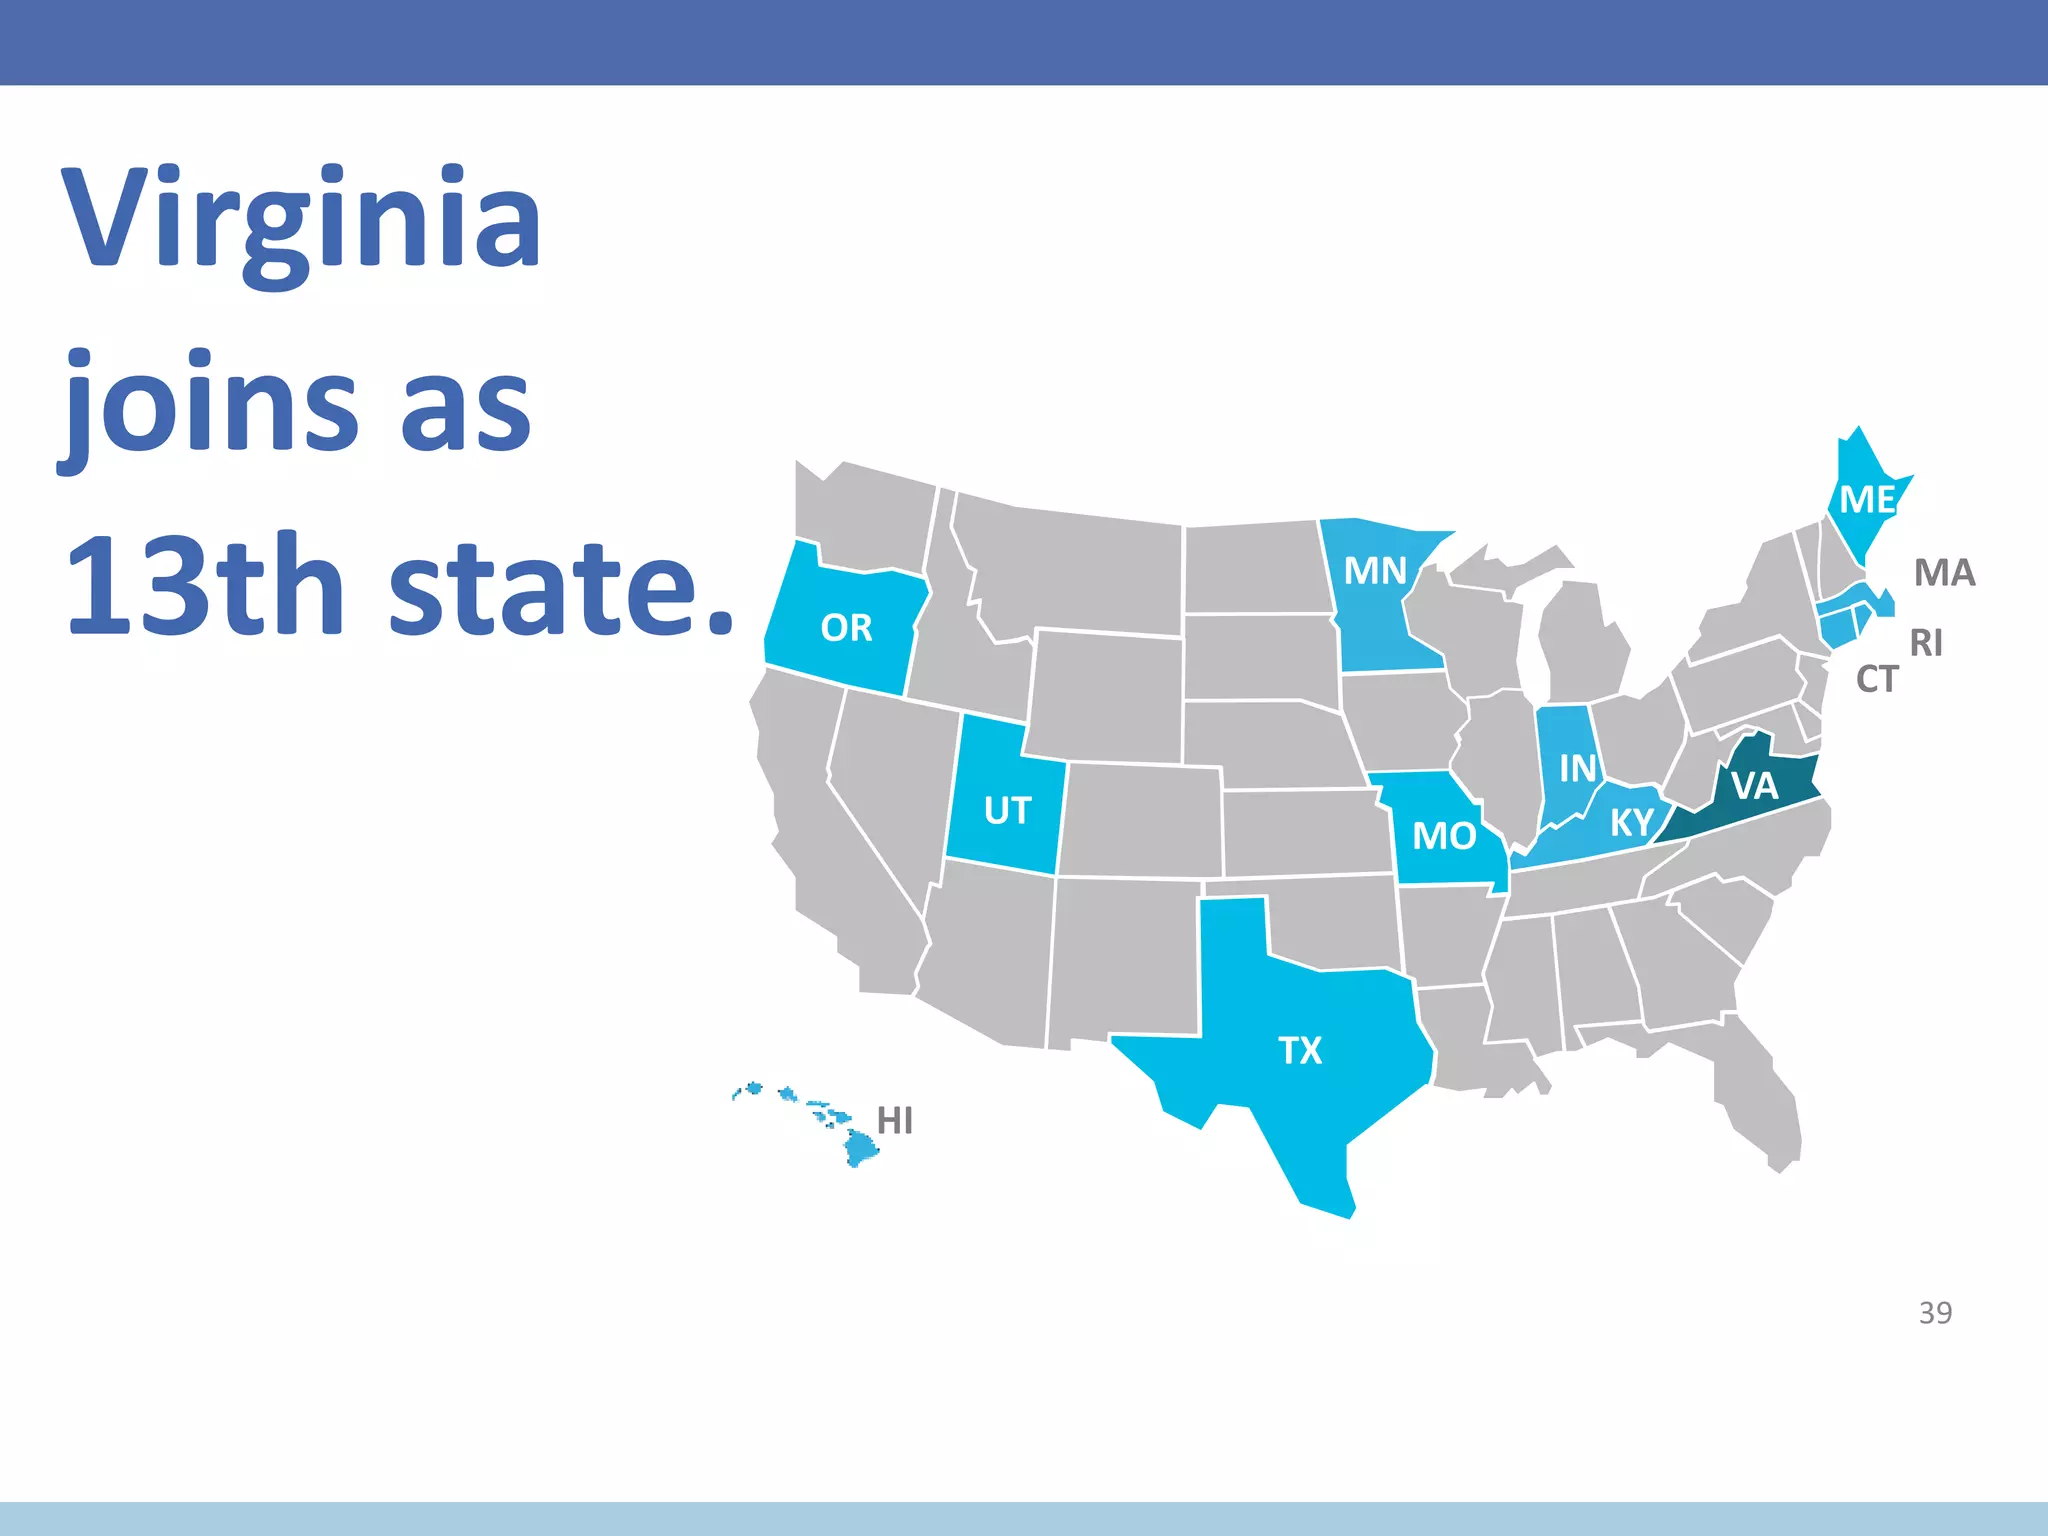
- Next steps include expanding the study to 13 states and 20,000 artifacts to further evaluate the approach and focus on equity.
2. 2
Today’s Moderator & Speakers
Catherine Wehlburg Julie Carnahan Terrel Rhodes
Proudly brought to you by
3. Purpose of Today
Preview “30,000 foot” initial results from the Multi-State
Collaborative Demonstration Year using the LEAP Value Rubrics
to inform teaching and learning.
Provide examples of detailed results to be released with full
report in January 2017
3
4. These slides summarize results from the
demonstration study involving 48 institutions in twelve
states using common rubrics to assess more than 8,000
student work products. The sample of student work in
the pilot represented the near-graduation students
across the participating institutions in the twelve states
only; therefore, the results are not generalizable for all
students in each participating state or nationwide.
4
5. VALUE Rubric Approach Assumptions
Learning is a process that occurs over time
Student work is best representation of motivated learning
Focus on what student does in key learning outcomes
Faculty & educator expert judgment
Results are useful & actionable for learning (& accountability)
5
7. The Multi-State Collaborative
• States committed to the importance of learning
outcomes and quality of a degree
• Mindful of students contribution to the states in
which they live
• Respectful that teaching & learning is
prerogative of faculty
• Focus is on improvement of student learning not
ranking states or institutions
7
9. Demonstration Year: Taking the vision
to scale from 9 to 12 states
Steering Committee
Point person from each
state and reps from
SHEEO & AAC&U
Institution Point
Persons
From each campus in
each state
p
OR
UT
TX
HI
MN
MO
IN
KY
ME
MA
RI
CT
10. Goals
Root assessment of learning
in authentic work & the
expertise of faculty
Establish benchmarks for
essential learning outcomes
Develop transparency of
shared standards of learning
to assist with transfer
OR
UT
TX
HI
MN
MO
IN
KY
ME
MA
RI
CT
Demonstration Year: Taking the vision
to scale from 9 to 12 states
12. MSC Demonstration Year
by the Numbers
48 public
institutions
uploaded
artifacts
By sector
29 four-year,
including 8
research
institutions
19 two-year
OR
UT
MN
MO
IN
KY
MA
RI
CT
OR
UT
TX
MN
MO
IN
KY
ME
HI
These results are not generalizable across participating states or the nation in any way. Please use appropriately.
13. MSC Demonstration Year
by the Numbers
8,308
assignments
were submitted*
pieces of
student work
were
submitted
1886
These results are not generalizable across participating states or the nation in any way. Please use appropriately.
14. MSC Demonstration Year Profile of VALUE Scorers
940
632
978
60
2,419
1,008
2,271
- 1,000 2,000 3,000 4,000
Civic Engagement
Critical Thinking
Quantitative Literacy
Written Communication
MSC 2-Year MSC 4-Year
Artifacts Scored Per Outcome
These results are not generalizable across participating states or the nation in any way. Please use appropriately.
15. Profile of Scorers by Discipline
and/or Institutional Role
68
41
32
23
10
Arts and Humanities
Natural and Applied/Formal Sciences
Professions
Social Sciences
Administrative
MSC Demonstration Year Profile of VALUE Scorers
These results are not generalizable across participating states or the nation in any way. Please use appropriately.
16. For full text of AAC&U VALUE Rubric for Critical Thinking, see: https://www.aacu.org/value/rubrics/critical-thinking.
Critical Thinking Rubric Dimensions
Capstone
4
Milestones
3 2
Benchmark
1
Explanation of issues Issue/problem to be considered
critically is stated clearly and
described comprehensively,
delivering all relevant information
necessary for full understanding.
Issue/problem to be considered
critically is stated, described, and
clarified so that understanding is
not seriously impeded by omissions.
Issue/problem to be considered
critically is stated but description
leaves some terms undefined,
ambiguities unexplored, boundaries
undetermined, and/or backgrounds
unknown.
Issue/problem to be considered
critically is stated without
clarification or description.
Evidence
Selecting and using information to
investigate a point of view or
conclusion
Information is taken from source(s)
with enough
interpretation/evaluation to
develop a comprehensive analysis
or synthesis.
Viewpoints of experts are
questioned thoroughly.
Information is taken from source(s)
with enough
interpretation/evaluation to
develop a coherent analysis or
synthesis.
Viewpoints of experts are subject to
questioning.
Information is taken from source(s)
with some
interpretation/evaluation, but not
enough to develop a coherent
analysis or synthesis.
Viewpoints of experts are taken as
mostly fact, with little questioning.
Information is taken from source(s)
without any
interpretation/evaluation.
Viewpoints of experts are taken as
fact, without question.
Influence of context and
assumptions
Thoroughly (systematically and
methodically) analyzes own and
others' assumptions and carefully
evaluates the relevance of contexts
when presenting a position.
Identifies own and others'
assumptions and several relevant
contexts when presenting a
position.
Questions some assumptions.
Identifies several relevant contexts
when presenting a position. May be
more aware of others' assumptions
than one's own (or vice versa).
Shows an emerging awareness of
present assumptions (sometimes
labels assertions as assumptions).
Begins to identify some contexts
when presenting a position.
Student's position (perspective,
thesis/hypothesis)
Specific position (perspective,
thesis/hypothesis) is imaginative,
taking into account the complexities
of an issue.
Limits of position (perspective,
thesis/hypothesis) are
acknowledged.
Others' points of view are
synthesized within position
(perspective, thesis/hypothesis).
Specific position (perspective,
thesis/hypothesis) takes into
account the complexities of an
issue.
Others' points of view are
acknowledged within position
(perspective, thesis/hypothesis).
Specific position (perspective,
thesis/hypothesis) acknowledges
different sides of an issue.
Specific position (perspective,
thesis/hypothesis) is stated, but is
simplistic and obvious.
Conclusions and related outcomes
(implications and consequences)
Conclusions and related outcomes
(consequences and implications) are
logical and reflect student’s
informed evaluation and ability to
place evidence and perspectives
discussed in priority order.
Conclusion is logically tied to a
range of information, including
opposing viewpoints; related
outcomes (consequences and
implications) are identified clearly.
Conclusion is logically tied to
information (because information is
chosen to fit the desired
conclusion); some related outcomes
(consequences and implications) are
identified clearly.
Conclusion is inconsistently tied to
some of the information discussed;
related outcomes (consequences
and implications) are oversimplified.
17. 4 3 2 1 0
0
5
10
15
20
25
30
35
40
45
50
Explanation of issues Evidence Context / Assumptions Student's Position Conclusions / Outcomes
Preview of MSC Demonstration Year (2016) Results
Critical Thinking Dimension
2-Year Institutional Score Distribution
% of student work products scored 4-0 by faculty scorers
These results are not generalizable across participating states or the nation in any way. Please use appropriately.
18. For full text of AAC&U VALUE Rubric for Quantitative Literacy, see: https://www.aacu.org/value/rubrics/quantitative-literacy
Quantitative Literacy Rubric Dimensions
Capstone
4
Milestones
3 2
Benchmark
1
Interpretation
Ability to explain information presented
in mathematical forms (e.g., equations,
graphs, diagrams, tables, words)
Provides accurate explanations of
information presented in mathematical
forms. Makes appropriate inferences
based on that information. For example,
accurately explains the trend data shown
in a graph and makes reasonable
predictions regarding what the data
suggest about future events.
Provides accurate explanations of
information presented in mathematical
forms. For instance, accurately explains
the trend data shown in a graph.
Provides somewhat accurate
explanations of information presented in
mathematical forms, but occasionally
makes minor errors related to
computations or units. For instance,
accurately explains trend data shown in
a graph, but may miscalculate the slope
of the trend line.
Attempts to explain information
presented in mathematical forms, but
draws incorrect conclusions about what
the information means. For example,
attempts to explain the trend data
shown in a graph, but will frequently
misinterpret the nature of that trend,
perhaps by confusing positive and
negative trends.
Representation
Ability to convert relevant information
into various mathematical forms (e.g.,
equations, graphs, diagrams, tables,
words)
Skillfully converts relevant information
into an insightful mathematical portrayal
in a way that contributes to a further or
deeper understanding.
Competently converts relevant
information into an appropriate and
desired mathematical portrayal.
Completes conversion of information but
resulting mathematical portrayal is only
partially appropriate or accurate.
Completes conversion of information but
resulting mathematical portrayal is
inappropriate or inaccurate.
Calculation Calculations attempted are essentially all
successful and sufficiently
comprehensive to solve the problem.
Calculations are also presented elegantly
(clearly, concisely, etc.)
Calculations attempted are essentially all
successful and sufficiently
comprehensive to solve the problem.
Calculations attempted are either
unsuccessful or
represent only a portion of the
calculations required to comprehensively
solve the problem.
Calculations are attempted but are both
unsuccessful and are not
comprehensive.
Application / Analysis
Ability to make judgments and draw
appropriate conclusions based on the
quantitative analysis of data, while
recognizing the limits of this analysis
Uses the quantitative analysis of data as
the basis for deep and thoughtful
judgments, drawing insightful, carefully
qualified conclusions from this work.
Uses the quantitative analysis of data as
the basis for competent judgments,
drawing reasonable and appropriately
qualified conclusions from this work.
Uses the quantitative analysis of data as
the basis for workmanlike (without
inspiration or nuance, ordinary)
judgments, drawing plausible
conclusions from this work.
Uses the quantitative analysis of data as
the basis for tentative, basic judgments,
although is hesitant or uncertain about
drawing conclusions from this work.
Assumptions
Ability to make and evaluate important
assumptions in estimation, modeling,
and data analysis
Explicitly describes assumptions and
provides compelling rationale for why
each assumption is appropriate. Shows
awareness that confidence in final
conclusions is limited by the accuracy of
the assumptions.
Explicitly describes assumptions and
provides compelling rationale for why
assumptions are appropriate.
Explicitly describes assumptions. Attempts to describe assumptions.
Communication
Expressing quantitative evidence in
support of the argument or purpose of
the work (in terms of what evidence is
used and how it is formatted, presented,
and contextualized)
Uses quantitative information in
connection with the argument or
purpose of the work, presents it in an
effective format, and explicates it with
consistently high quality.
Uses quantitative information in
connection with the argument or
purpose of the work, though data may
be presented in a less than completely
effective format or some parts of the
explication may be uneven.
Uses quantitative information, but does
not effectively connect it to the
argument or purpose of the work.
Presents an argument for which
quantitative evidence is pertinent, but
does not provide adequate explicit
numerical support. (May use quasi-
quantitative words such as "many,"
"few," "increasing," "small," and the like
in place of actual quantities.)
19. 4 3 2 1 0
0
5
10
15
20
25
30
35
40
45
Interpretation Representation Calculation Application / Analysis Assumptions Communication
Preview of MSC Demonstration Year (2016) Results
Quantitative Literacy Dimension
4-Year Institutional Score Distribution
% of student work products scored 4-0 by faculty scorers
These results are not generalizable across participating states or the nation in any way. Please use appropriately.
22. 1.0
1.5
2.0
2.5
Asian Black Hispanic White
Critical Thinking scores by race
2 year 4 year
These results are not generalizable across participating states or the nation in any way. Please use appropriately.
Asian Black Hispanic White
23. Critical Thinking scores by Pell eligibility
1.0
1.5
2.0
2.5
These results are not generalizable across participating states or the nation in any way. Please use appropriately.
2 year 4 year
Not Eligible Pell Eligible Not Eligible Pell Eligible
24. State Level Results
Potential to Inform State Level Policy
• Transfer & Articulation
• Equity
• Increase resources to support professional
development
• Inform policy leaders about the learning
outcomes students in state are demonstrating
24
25. MSC Criterion State Level Score Distribution
4 4 4 4 4 43 3 3 3 3 32 2 2 2 2 21 1 1 1 1 10 0 0 0 0 0
0
10
20
30
40
50
60
70
Interpretation Representation Calculation Application/Analysis Assumptions Communication
Quantitative Literacy Dimension (State)
2-Year Institutional Score Distribution
% of student work products scored 4-0 by faculty scorers
26. 26
4 43 32 21 10 0
0
5
10
15
20
25
30
35
40
Project - Context/Assumptions State - Context/Assumptions
Preview of MSC Demonstration Year (2016) Results
Quantitative Literacy (Context/Assumptions)
2-Year State vs. Project Score Distribution
% of student work products scored 4-0 by faculty scorers
31. Establishing the validity &
reliability of VALUE is a key priority
Nature & implications of complexity
32. Reality Check
There is no large-scale model for what we are doing.
The very variables other assessment approaches
“control” or “eliminate” VALUE embraces.
33. Purpose =
Discuss validity
& reliability in
relation to
inherent
complexity of
VALUE
Scores
(rubrics)
AssignmentsScorers
36. Faculty & staff saw the VALUE rubrics as valid.
Percent of scorers who reported Strongly Agree or Agree with each aspect of rubric use
75%
80%
83%
86%
89%
Encompassed meaning of outcome
Descriptors were relevant
Descriptors were understandable
Scoring levels provided sufficient range
Useful for evaluating student work
These results are not generalizable across participating states or the nation in any way. Please use appropriately.
37. Lessons Learned
• Actionable data about student achievement and improvement of key
learning outcomes on specific key dimensions of these important
learning outcomes can be generated via a common rubric-based
assessment approach.
• Faculty can effectively use common rubrics to evaluate student work
products—even those produced for courses outside their area of
expertise.
• Following training, faculty members can produce reliable results using
a rubric-based assessment approach.
• Faculty report that the VALUE Rubrics used in the study do encompass
key elements of each learning outcome studied, and were very useful
for assessing student work and for improving assignments.
• A web-based platform can create an easily usable framework for
uploading student work products and facilitating their assessment.
38. Next Steps
• 13 states, five with representative samples for the state
• 20,000 artifacts collected and uploaded
• Establishment of inter-state “SWAT” teams
• Increased focus on evaluation – panel of data scientists
• Increased focus on equity
• Explore feasibility of sub-study following students into the
workforce
MSC Refinement year (year three)
Students had to be 75% of the way to completion of institutional degree requirements
2,642 artifacts scored twice (36.6%) in order to measure inter-rater reliability
Terry
Terry
Terry
Terry
Terry
Note: Each work product was scored on 6 dimensions of quantitative literacy using a common AAC&U VALUE Rubric. See Slide 12 below for rubric dimension criteria. VALUE rubrics are available at www.aacu.org/value.
TR
Julie
Julie
Julie
Julie
Julie
JUlie
These are some of the results they see. Note the reporting options in the right corner
Same screen with the addition of things that can be filtered…
TR
TR
Comparing the validity & reliability of the VALUE process to standardized tests will always be an “apples” to “oranges” proposition.
Individual, faculty designed assignments taken straight off the syllabus, out of the classroom.
Scorer training sessions that are equal parts calibration to a consensus score and faculty development.
Approach to sampling that is designed to raise up – not wash out – diversity on our campuses.
Unscripted: There is no such thing as a “common” prompt or assignment.
“Big tent” welcome to ALL faculty – adjunct, two-year, four-year, curricular, co-curricular.
Not an approximation of learning from a curriculum, but OF THE CURRICULUM.
Potential for longitudinal assessment across a students’ undergraduate career.