Remote sensing and GIS tools are now essential for forest resource assessment and management due to decreased data costs and improved resolution. These tools can help address challenges of monitoring isolated or non-compliant activities cost-effectively. Indufor provides remote sensing services including resource monitoring, compliance assessment, and mapping for projects involving REDD+, carbon, and certification. Services typically cost $0.30-0.40 per hectare and provide automated detection of changes like harvesting or encroachment.
The goal for pro-poor mitigation activity, is to develop a low-cost protocol to quantify greenhouse gas emissions and to identify mitigation options for smallholders at whole-farm and landscape levels. Learn more: www.ccafs.cgiar.org
Reducing Emissions from Deforestation and Degradation (REDD+) requires better monitoring, measurement and verification (MRV) to assess carbon and non-CO2 greenhouse gases. With REDD likely to evolve into a whole landscape accounting approach which includes Agriculture, Forestry and Other Land Uses (AFOLU), reliable and cost efficient MRV across complex landscapes is becoming increasingly important.
Experts from the World Agroforestry Centre present four case studies that showcase work on measuring carbon in complex landscapes and agro- ecosystems with trees: Western Kenya; the Peruvian Amazon; the peatlands of West Kalimantan, Indonesia and the Africa Soil Information Service project. There are also insights about choosing the right tools and methods for different contexts, ensuring measurements are accurate, statistically relevant, and can be scaled up.
CSP Training series : solar resource assessment 2/2Leonardo ENERGY
Fifth session of the 2nd Concentrated Solar Power Training dedicated to solar resource assessment.
* DNI Variability, Frequency Distributions
* Typical Meteorological Years
* DNI measurements: broadband vs. spectral, and their limitations
* What is circumsolar radiation and why should we care in CSP/CPV?
* How much diffuse irradiance can be used in concentrators?
* How to measure and model the circumsolar irradiance?
* Spectral irradiance standards and their use for PV/CPV rating
* The AM1.5 direct standard spectrum: Why did it change? Why AM1.5?
* Use of the SMARTS radiative code to evaluate clear-sky spectral irradiances
* Sources of measured spectral irradiance data
* Spectral effects on silicon and multijunction cells and their dependence on climate
Modelled and Analysed the watershed Dynamics in Mahanadi River Basin. Finally came up with watershed Management Plan to minimise the future LUCC in Mahanadi River Basin
Digital Ortho Image Creation of Hall County Aerial Photos Papermpadams77
Special Topics Project Paper “Digital Ortho Image Creation of Hall County Aerial Photos” which I presented at the Florida Academy of Science and Georgia Academy of Science Joint Conference held in Jacksonville, FL March 14th and 15th of 2008
Key lecture for the EURO-BASIN Training Workshop on Introduction to Statistical Modelling for Habitat Model Development, 26-28 Oct, AZTI-Tecnalia, Pasaia, Spain (www.euro-basin.eu)
Country experiences in improving national forest monitoringCIFOR-ICRAF
Ruandha Agung Sugardiman, from the Republic of Indonesia’s Ministry of Forestry, gave this presentation on 28 November 2012 at a joint CIFOR and GOFC-GOLD (Global Observation of Forest Cover and Land Dynamics) UNFCCC COP18 side-event in Doha, Qatar.
A flagship CTO event, this has grown into a platform for knowledge-sharing among peer groups steering ICT projects in e-delivery of health care, education and governance. This Forum echoes the Commonwealth's 2013 theme: The Road Ahead for Africa.
Multi-Spectral Analysis of Satellite Imagery for Inventory of Sensitive Marin...Keith VanGraafeiland
An inventory of benthic marine habitats can be obtained from recent satellite images. During Sub Sea Survey 2008 in Galveston Texas opportunities to preform multi-spectral analysis against satellite imagery were discussed in this presentation.
GIS and Remote Sensing in Diagnosis and Management of Problem Soil with audio...KaminiKumari13
GIS and Remote Sensing in Diagnosis and Management of Problem Soil for agriculture, soil science, agronomy, forestry, land management and planning with audio by Dr. Kamini Roy
Beyond Seminars - Deep Learning for fusion of Sentinel-1 and Sentinel-2 data ...ENVISION H2020
Iason Tsardanidis presents in the BEYOND Centre his work on ENVISION H2020 project regarding Deep Learning for fusion of Sentinel-1 and Sentinel-2 data and grassland mowing detection to promote peer-to-peer learning between the various teams of BEYOND!
NZ Rural Broadband - Making Precision Agriculture PossibleLynetteMowlem
IITP Canterbury Branch event held 22 November 2012 - see details in event notice at http://www.iitp.org.nz/events/canterbury/668-NZ_Rural_Broadband_Making_Precision_Agriculture_Possible
Small-scale deforestation monitoring in Juma REDD projectCIFOR-ICRAF
Effectively monitoring deforestation is a crucial component for the success of REDD (Reducing Emissions from Deforestation and forest Degradation). In this presentation, Florian Reimer from South Pole Carbon compared techniques for monitoring small-scale deforestation in Juma reserve, exploring three classification methods: PRODES, CLASlite and ImageSVM. He found that using one model over another could avoid underdetection worth roughly US$1 million over four years, a compelling argument for careful selection of techniques depending on the characteristics of the region.
Florian Reimer gave this presentation on 8 March 2012 at a workshop organised by CIFOR, ‘Measurement, Reporting and Verification in Latin American REDD+ Projects’, held in Petropolis, Brazil. Credible baseline setting and accurate and transparent Measurement, Reporting and Verification (MRV) of results are key conditions for successful REDD+ projects. The workshop aimed to explore important advances, challenges, pitfalls, and innovations in REDD+ methods — thereby moving towards overcoming barriers to meeting MRV requirements at REDD+ project sites in two of the Amazon’s most important REDD+ candidate countries, Peru and Brazil. For further information about the workshop, please contact Shijo Joseph via s.joseph (at) cgiar.org
Similar to Indufor ..forest intelligence ..remote sensing and gis .... bau with a bit more intelligence (20)
Small-scale deforestation monitoring in Juma REDD project
Indufor ..forest intelligence ..remote sensing and gis .... bau with a bit more intelligence
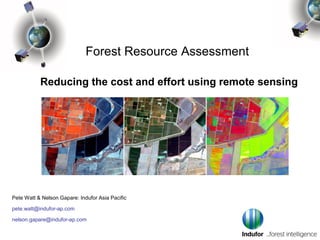
1. Forest Resource Assessment
Reducing the cost and effort using remote sensing
Pete Watt & Nelson Gapare: Indufor Asia Pacific
pete.watt@indufor-ap.com
nelson.gapare@indufor-ap.com
2. ….remote sensing and GIS as business as usual services
Looking back
10-15 years ago remote sensing and GIS were treated as specialist stand alone
tools only used for specific tasks. Today, you simply can’t do that, the
boundaries between spatial analytics and decision making are too intertwined to
look at these tools separately.
And now..
From land use, land cover, change detection/monitoring, to compliance
assessment, valuation and due diligence, remote sensing/geospatial technology
are fundamental. More so, the cost of data has dropped significantly while the
resolution has improved to sub-meter levels.
The increasing demand for historical data to set baselines and reference levels
– yes, think REDD+, ETSs, VCS and so on means we do need to smarten up in
pre-processing, classification. That’s just what we have been doing with the
likes of RapidEye, SPOT5, Landsat to name a few. Have a look at some of the
work we have been doing.
4. Multi-faceted challenges – e.g. regulatory compliance
What are the challenges?
• Illegal activities can be sporadic and varying
• Activities can be located in isolated areas
• Compliance monitoring can be difficult
• Resource classification can be complicated
• Shortage of human capacity for ground monitoring
and assessment
• Costs of monitoring and enforcement can be high
• Strategic planning can be difficult without
reasonable ground intelligence
5. Remote sensing – a multi -faceted solution
• Remote sensing eliminates key challenges such as
• Isolation of locations and accessibility
• Identification of temporal changes
• Detection of unsanctioned activities
• Cost
2011 Uncorrected
2010 Reference
2011 Normalised
6. What are the costs?
Imagery Costs
• Imagery from the archive 0.95
euro/km2 or EUR 950 for 100,000
ha (approx USD1300)
• Tasking images – new collections
minimum 20% cloud cover is 0.95
euro/km2 but order area is 250,000
Detected Encroachment
ha. (approx. 3100 USD)
Indufor’s Detection Cost and
Reporting Solution
Indufor has developed routines that
allow detection and mapping of forest
change i.e. roads or clearance (at 0.5
ha scale).
If suitable imagery are available this
service is priced at about USD30 to 40
cents/ha based on a minimum coverage
area of 100,000 ha.
7. For example…..Monitoring Compliance?
Location: South America
Application:
Monitoring of harvesting
and roading operation in
forest concessions
Solution:
5 m satellite imagery used
to automatically detect &
record harvesting and
roading areas.
8. Further examples - Mining Operations
Location: South America
Application:
Detection of mining
encroachment in forest
Concessions
Solution:
5 m satellite imagery used
to automatically detect &
record mining areas.
9. And you can link the log….to a location
Selective harvest monitoring
10. A tool for rapid intelligence gathering
Disease detection - Australia
Mapping non-sanctioned logging- Brazil
Fire detection - China
11. Resources Identification and Verification
Location: Global
Application:
Area verification is an integral part of the
valuation and the due diligence process.
Solution:
Indufor routinely use satellite images and
Pine other spatial datasets to verify the extent
and status of resources.
The process applied uses in-house
routines that assess the quality of the
resource and area.
12. Detection of Harvesting using Satellite Imagery
Location: China, 2012
Species : Eucalyptus
Application:
Due to airborne data collection restrictions no
information is available to update the progress of
harvesting or land clearance operations
Solution:
Satellite Image Cost-effective 5 m satellite imagery used to
automatically detect harvested and cleared
areas. These outputs are provided in a GIS
format and allow the calculation and tracking of
harvesting
GIS output
13. On-going Detection of Harvesting Operations
Location: Australia
Species : Pine
Application:
Due to the cost of aerial
image collection only
infrequent information is
available to update the
progress of harvesting
and thinning operations
Solution:
Cost-effective 5 m
satellite imagery used to
automatically detect &
record harvest areas.
14. Forest Carbon Projects
Satellite imagery Satellite imagery
2006 2010
Location: Papua New Guinea & Laos, 2012
Application:
Establishment of forest reference levels and
2009
reference carbon emissions levels, and
projection of future land use change for
Voluntary Carbon Markets (VCS Standard)
Solution:
2019 • Using satellite imagery to determine historical
land use and land cover change
• Projecting future deforestation by modelling
relationships between historical trends and
2059 drivers of deforestation
Projected forest cover loss (purple)
15. Mapping Plantation Performance
Location: New Zealand
Species : Pine
Application:
Monitoring plantation
status by detecting
gaps, areas of poor
growth or incorrectly
attributed areas in the
GIS.
Solution:
Using satellite imagery a
prediction model is
applied that colour
codes anomalies to
allow targeted
5 m Satellite image Variation Map (green ok – red issues) intervention
16. Science References
• Watt, P.J., & Watt M.S., Meredith A.W, 2011. Forest planning applications using RapidEye satellite data. New Zealand
Journal of Forestry
• Watt, P.J., & Watt M.S (2011). Applying satellite imagery for forest planning. New Zealand Journal of Forestry (56) 1
• Watt, P.J. 2005. An evaluation of LiDAR and optical satellite data for the measurement of structural attributes in British
upland conifer plantation forestry. Doctoral thesis. Department of Geography, University of Durham, England
• Watt, P.J. & Watt M.S 2012 (in review) Development of a national model of tree volume from LiDAR metrics for New
Zealand. International Journal of Remote Sensing
• Donoghue, D.N.M., Watt, P.J., Cox, N.J., Dunford, R.W., Wilson, J., Stables, S. and Smith, S. 2004. An evaluation of the
use of satellite data for monitoring early development of young Sitka spruce plantation forest growth, Forestry, 77, 383-396.
• Donoghue, D.N.M., Watt, P.J., Cox, N.J, Wilson, J. 2007 .Remote sensing of species mixtures in conifer plantations using
LiDAR height and intensity data. Remote Sensing of Environment.
• Donoghue, D.N.M. & Watt, P.J. 2006. Using LiDAR to compare forest height estimates from IKONOS and Landsat ETM+
data in Sitka spruce plantation forests, International Journal Of Remote Sensing 27 (11): 2161-2175.
• Dymond, J.R. , Gapare, N., Burgess, D.W., Shepherd, J.D., Newsome, P.F., Watt, P.J. (2012). Environmental Science &
Policy (16)1-8. Remote sensing of land-use change for Kyoto Protocol reporting: the New Zealand Case
17. Resource Mapping
Indufor Asia Pacific Ltd Indufor OY
Auckland City Helsinki
New Zealand Finland
www.indufor-ap.com www.indufor.fi