Numerous studies have found an average increase in extreme precipitation for both the U.S. and Northern Hemisphere mid-latitude land areas, consistent with the expectations arising from the observed increase in greenhouse gas concentrations (now more than 40% above pre-industrial levels). However, there are important regional variations in these trends that are not fully explained. These trend studies are typically based on direct analyses of observational station data. Such analyses confront multiple challenges, such as incomplete data and uneven spatial coverage of stations. Central scientific questions related to this general finding are: Are there changes in weather system phenomenology that are contributing to this observed increase? What is the contribution of increases in atmospheric water vapor? There are also questions related to application of potential future changes in planning. Because of the rarity (by definition) of extreme events, trends are mostly found only when aggregating over space. When would we expect to see a signal at the local level? What are the uncertainties surrounding future changes and their potential incorporation into future design? Further development of statistical/mathematical methods, or innovative application of existing methods, is desirable to aid scientists in exploring these central scientific questions. This talk will describe characteristics of the observation record and the issues surrounding the above questions.
Numerous studies have found an average increase in extreme precipitation for both the U.S. and Northern Hemisphere mid-latitude land areas, consistent with the expectations arising from the observed increase in greenhouse gas concentrations (now more than 40% above pre-industrial levels). However, there are important regional variations in these trends that are not fully explained. These trend studies are typically based on direct analyses of observational station data. Such analyses confront multiple challenges, such as incomplete data and uneven spatial coverage of stations. Central scientific questions related to this general finding are: Are there changes in weather system phenomenology that are contributing to this observed increase? What is the contribution of increases in atmospheric water vapor? There are also questions related to application of potential future changes in planning. Because of the rarity (by definition) of extreme events, trends are mostly found only when aggregating over space. When would we expect to see a signal at the local level? What are the uncertainties surrounding future changes and their potential incorporation into future design? Further development of statistical/mathematical methods, or innovative application of existing methods, is desirable to aid scientists in exploring these central scientific questions. This talk will describe characteristics of the observation record and the issues surrounding the above questions.
The climate and earth sciences have recently undergone a rapid transformation from a data-poor
to a data-rich environment. In particular, massive amount of data about Earth and its
environment is now continuously being generated by a large number of Earth observing satellites
as well as physics-based earth system models running on large-scale computational platforms.
These massive and information-rich datasets offer huge potential for understanding how the
Earth's climate and ecosystem have been changing and how they are being impacted by humans’
actions. This talk will discuss various challenges involved in analyzing these massive data sets
as well as opportunities they present for both advancing machine learning as well as the science
of climate change in the context of monitoring the state of the tropical forests and surface water
on a global scale.
On March 11, 2016, ICLR held a Friday Forum workshop entitled 'Mapping extreme rainfall statistics for Canada', led by Dr. Slobodan Simonovic of Western University.
Climate change is expected to increase the frequency and intensity of extreme rainfall events, affecting rainfall intensity-duration-frequency (IDF) curve information used in the design, maintenance and operation of water infrastructure in Canada. Presented in this lecture are analyses of precipitation data from 567 Environment Canada hydro-meteorological stations using the IDF_CC tool. Results for the year 2100 based on Canadian climate model and an ensemble of 22 GCMs have been generated. A spatial interpolation method was used to produce Canadian precipitation maps for events of various return periods. Results based on the Canadian climate model indicate a reduction in extreme precipitation in central regions of Canada and increases in other regions. Relative to the ensemble approach, the Canadian climate model results (a) suggest more spatial variability in change of IDFs, and (b) the ensemble approach generated generally lower values than the Canadian climate model.
Dr. Simonovic has extensive research, teaching and consulting experience in water resources systems engineering. He teaches courses in water resources and civil engineering systems. He actively works for national and international professional organizations. Dr. Simonovic’s primary research interest focuses on the application of systems approach to management of complex water and environmental systems. Most of his work is related to the integration of risk, reliability, and uncertainty in hydrology and water resources management. He has received a number of awards for excellence in teaching, research and outreach. He has published over 450 professional publications and three major textbooks. He was inducted to the Canadian Academy of Engineering in June of 2013.
Two Dimensional Flood Inundation Modelling In Urban Area Using WMS, HEC-RAS a...Amro Elfeki
This research presents a two-dimensional flood inundation modelling in urbanized areas when some features such as roads, buildings, and fences have great effect on flood propagation. Wadi Qows located in Jeddah City, Saudi Arabia was chosen as case study area because of the flood occurrence of 2009 causing lots of losses either economic or loss of life. The WMS and HEC-RAS program were used for a hydraulic simulation based on channel geometry built by incorporating urban features into DEM using GIS effectively. A resampling method of DEM 90 × 90 m become 10 × 10 m grid cell sizes was conducted to produce a higher resolution DEM suitable for urban flood inundation modelling. The results show that a higher resolution leads to increasing the average flood depth and decreasing the flood extent. Although the change of the grid cell sizes does not affect its elevation values, this approach is helpful to perform flood simulations in urban areas when high resolution DEM availability is limited. In addition, the integration of WMS, HEC-RAS and GIS are powerful tools for flood modelling in rural, mountainous and urban areas.
https://www.researchgate.net/publication/330004725_Two_Dimensional_Flood_Inundation_Modelling_in_Urban_Areas_Using_WMS_HEC-RAS_and_GIS_Case_Study_in_Jeddah_City_Saudi_Arabia_IEREK_Interdisciplinary_Series_for_Sustainable_Development
International Journal of Computational Engineering Research(IJCER)ijceronline
International Journal of Computational Engineering Research(IJCER) is an intentional online Journal in English monthly publishing journal. This Journal publish original research work that contributes significantly to further the scientific knowledge in engineering and Technology.
Determining The Coefficient Of Tr, Α And River Length (L) Of Flood Runoff Mod...iosrjce
IOSR Journal of Mechanical and Civil Engineering (IOSR-JMCE) is a double blind peer reviewed International Journal that provides rapid publication (within a month) of articles in all areas of mechanical and civil engineering and its applications. The journal welcomes publications of high quality papers on theoretical developments and practical applications in mechanical and civil engineering. Original research papers, state-of-the-art reviews, and high quality technical notes are invited for publications.
Rainfall-Runoff Modelling using Modified NRCS-CN,RS and GIS -A Case StudyIJERA Editor
Study of rainfall and runoff for any area and modeling it, is one of the important aspects for planning and
development of water resources. The development of water resources and its effective management plays a vital
role in development of any country more particularly in India, which is an agricultural based economy. Hence it
is intended to develop a model of Rainfall and runoff to a river basin and also apply the methodology to Sarada
River Basin which has drainage area of 1252.99 Sq.km. The basin is situated in Vishakhapatnam district of
Andhra Pradesh, India. The rainfall and runoff data has been collected from the gauging stations of the basin
apart from rainfall data from nearby stations. MNRCS-CN method has been adopted to calculate runoff. Various
hydrological parameters like soil information, rainfall, land use and land cover (LU/LC) were considered to use
in MNRCS-CN method. The depth of runoff has been computed for different land use patterns using, IRS-P4-
LISS IV data for the study area. Based on the analysis, land use/land cover pattern of Sarada River Basin has
been prepared. The land use/land cover patterns were also visually interpreted and digitized using ERDAS
IMAGINE software. The raster data was processed in ERDAS and geo-referenced and various maps viz. LU/LC
maps, drainage map, contour map, DEM (Digital elevation model) have been generated apart from rainfall
potential map using GIS tool. The estimated runoff using MNRCS-CN model has been simulated and compared
with that of actual runoff. The performance of the model is found to be good for the data considered. The
coefficient of determination R2
value for the observed runoff and that of the computed runoff is found to be
more than 0.72 for the selected watershed basin.
DSD-INT 2018 Experiences from modelling a branched lowland river in NE German...Deltares
Presentation by Rita Ley, Federal Institute of Hydrology, Germany, at the Delft3D - User Days (Day 1: Hydrology and hydrodynamics), during Delft Software Days - Edition 2018. Monday, 12 November 2018, Delft.
DSD-INT 2019 Lake Kivu - 3D hydrodynamic modelling of a deep and strongly str...Deltares
Presentation by Wouter Kranenburg, Deltares, at the Delft3D - User Days (Day 2: Hydrodynamics), during Delft Software Days - Edition 2019. Tuesday, 12 November 2019, Delft.
Intensity-Duration-Frequency Curves and RegionalisationAM Publications
Storm sewers make up a large percentage of drainage system in an urban setup. The design of these
components are based on rainfall intensities of a specific design period for that location. These can be derived from
intensity-duration-frequency (IDF) relationship. These IDF relationships are derived from historical rainfall, using
an extreme value distribution for maximum rainfall intensity. In the present study the IDF curves and parameter
regionalisation were studied for various kinds of basins. These equation parameters can be then used to understand
the spatial variation of rainfall intensity in the study area. The parameter contour maps subsequently generated using
various interpolation method are then used for plotting IDF curves for any ungauged station in the basin.
Flood Risk Assessment Using GIS Tools, By Dr. Omar Elbadawy, CEDARE, Land and Water Days in Near East & North Africa, 15-18 December 2013, Amman, Jordan
The Wisconsin Department of Natural Resources directly
produces the state’s Digital Flood Insurance Rate Maps
(DFIRMs) under FEMA’s Map Modernization Program. This
presentation will discuss how we use an ArcMap 9.2 extension,
Flood Map Desktop 9™ (FMD), to create FEMA-compliant
DFIRM data, metadata, and map deliverables. The FMD tool
has greatly improved our program’s work flow and efficiency.
As we demonstrate the FMD structure and FMD toolbars, we
will discuss geodatabase creation and management, topology,
domain tables, formatting style files, symbology, label creation
and storage, data exporting, and project settings which form the
base templates for our maps.
Application of GIS in Post Flood Epidemics- A Case Study, Mumbai by Dr. Guru ...Priyanka_vshukla
The present study deals with the role of Geographical Information Systems (GIS) in mapping the disease prevalence in areas and indicating the severity of a particular disease in certain areas. The primary and secondary data’s were collected from field and Municipal hospital respectively.
Spatial mapping of different diseases (i.e. vector borne and water borne diseases) and pollution sources like water distribution lines passing through parallel or cross to the drains/garbage sites.
The available number of health facilities such as PHC, HP and major hospitals were located in the GIS environment for further analysis. Based on the overlay and integrate analyses classified and zoned as mild, moderate and severe categories of flood epidemics.
Environmental Management Modeling Activities at Los Alamos National Laborator...Velimir (monty) Vesselinov
esselinov, V.V., et al., Environmental Management Modeling Activities at Los Alamos National Laboratory (LANL), Department of Energy Technical Exchange Meeting, Performance Assessment Community of Practice, Hanford, April 13-14, 2010.
Scale-dependency and Sensitivity of Hydrological Estimations to Land Use and ...Beniamino Murgante
Scale-dependency and Sensitivity of Hydrological Estimations to Land Use and Topography for a Coastal Watershed in Mississippi - Vladimir J. Alarcon and Charles G. O’Hara
Presented by Charlotte MacAlister, Birhanu Zemadim , Teklu Erkossa , Amare Haileslassie, Dan Fuka, Tammo Steenhuis, Solomon Seyoum, Holger Hoff, Kinde Getnet, and Nancy Johnson to the Nile Basin Development Challenge Science and Reflection Workshop, Addis Ababa, 4-6 May 2011
2018 National Tanks Conference & Exposition: HRSC Data VisualizationAntea Group
Two of our High-Resolution Site Characterization (HRSC) Data Visualization posters featured at the 2018 NTC Conference in Louisville, KY.
1. Using Data Management and 3-Dimensional Data Visualization to Generate More Complete Conceptual Site Models and Streamline Site Closure
2. High-Resolution Site Characterization (HRSC) and 3-Dimensional Data Visualization for a Fractured Rock Site: A Path to Streamlined Closure
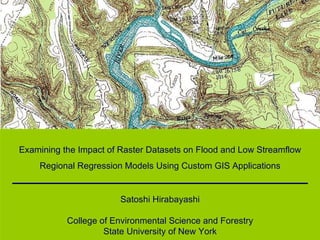
1. Examining the Impact of Raster Datasets on Flood and Low Streamflow Regional Regression Models Using Custom GIS Applications Satoshi Hirabayashi College of Environmental Science and Forestry State University of New York
2.
3.
4. Abstract Examining the Impact of Raster Datasets on Title: Flood and Low Streamflow Regional Regression Models Abstract Using Custom GIS Applications Raster Datasets Flood and Low Streamflow Regional Regression Models Q = f (X 1 ,X 2 ,X 3 ,…) Custom GIS Applications
5.
6.
7. Regional Regression Model Gauged Ungauged Introduction Q = f (X 1 ,X 2 ,X 3 ,…) Q = f (X 1 ,X 2 ,X 3 ,…) Regional regression models Q = f (X 1 ,X 2 ,X 3 ,…) Q : Response variable (Q 100 , Q 7,10 ) X : Explanatory variable (Watershed characteristics) Xs : available Q : available Xs : available Q : NOT available Develop regional regression model Apply model
8.
9.
10. Kroll et al. ’s (2004) Study Low streamflow regional regression models were improved. Quantity Quality USGS’s Hydro-Climatic Data Network (HCDN) 1,545 sites 44-year record length (average) Digitally derived 1,465 raster datasets Took countermeasures for data quality and quantity. Introduction Streamflow Records Watershed Characteristics
11. Kroll et al.’s Processes Watershed boundary delineation Watershed characteristics derivation Watershed Boundary Watershed Characteristics average DEM Introduction Gauging Site Watershed Boundary Raster
12. Motivation for This Study Enhancement of data quality and quantity 1 km Climate : 49 km Climate : 4 km Soil: 1 km 1 1,440 13 12 Quality of watershed boundary may be enhanced by using DEMs with finer horizontal resolution. Quality and quantity of watershed characteristics may be enhanced by using raster data with finer resolution and more raster data. Introduction Data Horizontal resolution Number of data DEM Raster
16. Objectives 1. Develop a custom GIS application Objectives 2. Examine impact of horizontal resolution of DEMs
17. Objectives 1. Develop a custom GIS application Objectives 2. Examine impact of horizontal resolution of DEMs 3. Examine impact of new raster datasets
18. Objectives 1. Develop a custom GIS application Objectives 2. Examine impact of horizontal resolution of DEMs 3. Examine impact of new raster datasets 4. Examine the most important watershed characteristics
19.
20.
21.
22.
23. Data Methods General watershed characteristics Soil DEM Climate Remote sensed Hydrology + Hydrogeology USGS personal acquisition USDA State Soil Geographic (STATSGO) USGS Hydro1k USGS 1-degree USGS National Elevation Dataset (NED) Spatial Climate Analysis Service Parameter-elevation Regressions on Independent Slopes Model (PRISM) NASA Moderate Resolution Imaging Spectroradiometer (MODIS) USGS Kansas Water Science Center n/a 1 km 1 km 85 m 30 m 4 km 250 m 5km/1km Type Data Source Resolution
24. Watershed boundary delineation Pre-process Overview of GIS processes Spatial statistic calculation Table toolset Spatial statistic toolset Table list Arc Hydro Gauging site DEM STATSGO toolset Polygon Table Table Log Raster toolset PRISM raster Raster list MODIS raster Hydro raster Raster Raster Raster Raster Raster Raster Table Raster list Watershed boundaries Methods Raster Raster Raster Raster Raster Raster
25.
26. Watershed boundary delineation Pre-process Overview of GIS processes Spatial statistic calculation Table toolset Spatial statistic toolset Table list Arc Hydro Gauging site DEM STATSGO toolset Polygon Table Table Log Raster toolset PRISM raster Raster list MODIS raster Hydro raster Raster Raster Raster Raster Raster Raster Table Raster list Watershed boundaries Methods Raster Raster Raster Raster Raster Raster
27.
28. Watershed boundary delineation Pre-process Overview of GIS processes Spatial statistic calculation Table toolset Spatial statistic toolset Table list Arc Hydro Gauging site DEM STATSGO toolset Polygon Table Table Log Raster toolset PRISM raster Raster list MODIS raster Hydro raster Raster Raster Raster Raster Raster Raster Table Raster list Watershed boundaries Methods Raster Raster Raster Raster Raster Raster
29.
30.
31.
32. Watershed boundary delineation Pre-process Overview of GIS processes Spatial statistic calculation Table toolset Spatial statistic toolset Table list Arc Hydro Gauging site DEM STATSGO toolset Polygon Table Table Log Raster toolset PRISM raster Raster list MODIS raster Hydro raster Raster Raster Raster Raster Raster Raster Table Raster list Watershed boundaries Methods Raster Raster Raster Raster Raster Raster
33.
34. Watershed boundary delineation Pre-process Overview of GIS processes Spatial statistic calculation Table toolset Spatial statistic toolset Table list Arc Hydro Gauging site DEM STATSGO toolset Polygon Table Table Log Raster toolset PRISM raster Raster list MODIS raster Hydro raster Raster Raster Raster Raster Raster Raster Table Raster list Watershed boundaries Methods Raster Raster Raster Raster Raster Raster
35.
36. Watershed Characteristics Tables Developed for three watershed boundary sets (WS1k, WS85, and WS30) Methods WS1k WS85 WS30 Watershed Char. Table Watershed Char. Table Watershed Char. Table
37.
38. Watershed Characteristics Categorization Methods Watershed Char. Table USGS traditional watershed characteristics (34) A Topography (4) Soil (12) Climate (121) B Hydrology (3) + Hydrogeology (2) C Remote sensed (6) D
39. Potential Explanatory Variable Combination A A + B A + C A + D ALL A. USGS traditional watershed characteristics B. Topography + Soil + Climate C. Hydrology + Hydrogeology D. Remote sensed 34 171 39 40 182 Methods Category # of potential explanatory variables Potential explanatory variable combination
40. Model Construction WS1k WS85 WS30 Flood and low streamflow regional regression models # of explanatory variables 2: Q = f (X 1 ,X 2 ) 3: Q = f (X 1 ,X 2 ,X 3 ) 4: Q = f (X 1 ,X 2 ,X 3 ,X 4 ) Stepwise regression 5 % significance level Methods A A + B A + C A + D ALL 34 171 39 40 182 A A + B A + C A + D ALL 34 171 39 40 182 A A + B A + C A + D ALL 34 171 39 40 182 Watershed boundary Developed model Combination Criteria
41.
42. Developed Models Flood regional regression models ALL A+D A+C A+B A ALL A+D A+C A+B A ALL A+D A+C A+B A WS1k WS85 WS30 Explanatory Variables Combination Standard Error (%) 23 25 27 29 31 33 35 37 Results DEM comparison Explanatory variable comparison 2 variables 3 variables 4 variables
43. Explanatory Variables Combination Developed Models Low streamflow regional regression models ALL A+D A+C A+B A ALL A+D A+C A+B A ALL A+D A+C A+B A WS1k WS85 WS30 Standard error (%) 20 30 40 50 60 70 80 90 100 110 Results DEM comparison Explanatory variable comparison 2 variables 3 variables 4 variables
44. DEM Impact Flood regional regression models (with the ALL potential explanatory variable combination) Watershed Boundary Standard error (%) 23 25 27 29 31 Almost same performance Results Horizontal resolution of DEMs has almost no impact on performance of flood regional regression models WS1k WS85 WS30 2 variables 3 variables 4 variables
45. DEM Impact Low streamflow regional regression models (with the ALL potential explanatory variable combination) Watershed Boundary Standard error (%) Almost same performance Results 20 30 40 50 60 WS1k WS85 WS30 Horizontal resolution of DEMs has almost no impact on performance of low streamflow regional regression models 2 variables 3 variables 4 variables
47. Delineated Watershed Boundary WS1k & WS85 Results Flint river near chase, AL Site number: 03575000 Drainage area: 342 mi 2
48. Delineated Watershed Boundary WS1k & WS85 & WS30 Differences occur only at the boundaries Results Flint river near chase, AL Site number: 03575000 Drainage area: 342 mi 2 Delineated watershed shapes are similar with differences occurring only at the boundaries
49.
50.
51.
52.
53. Conclusions Conclusions 1. Develop a custom GIS application Objective Custom GIS application was developed with ArcObjects and VBA Approximately 1,500 raster datasets were efficiently processed
54. Conclusions Conclusions 1. Develop a custom GIS application Objective 2. Examine impact of horizontal resolution of DEMs Custom GIS application was developed with ArcObjects and VBA Approximately 1,500 raster datasets were efficiently processed No significant impacts on the model performance
55. Conclusions Conclusions 3. Examine impact of new raster datasets Objective Models were improved with the inclusion of newly derived watershed characteristics
56. Conclusions Conclusions 3. Examine impact of new raster datasets Objective 4. Examine the most important watershed characteristics Models were improved with the inclusion of newly derived watershed characteristics The inclusion of hydrologic variables, for flood models, and hydrogeologic variables, for low streamflow models, greatly improved the models.
57. References Jennings, M.E., W.O. Thomas, Jr., and H.C. Riggs, (1994), Nationwide Summary of U. S. Geological Survey Regional Regression Equations for Estimating Magnitude and Frequency of Floods for Ungaged Sites, 1993. U. S. geological Survey Water-Resources Investigations Report , 94-4002, Reston, VA. Kroll, C.N., J.G.. Luz, T.B. Allen, and R.M. Vogel, (2004), Developing a watershed characteristics database of improve low streamflow prediction, Journal of Hydrologic Engineering , March/April 2004, 116-125.
62. DEM Impact on Derived Watershed Characteristics Example 136.3 mm 136.5 mm 136.8 mm WS1k WS85 WS30 average average average Results 30-year average January precipitation Differences among watershed characteristics are very small
63. Watershed Characteristic Difference Horizontal resolution of raster data Average difference of derived watershed characteristic (%) 4km (PRISM) 1km (STATSGO) 250m (MODIS) 0.0 0.5 1.0 1.5 2.0 2.5 3.0 3.5 Results WS85-WS30 WS1k-WS85 WS1k-WS30 Small differences in watershed characteristics Small differences in the performance of developed models
64.
65.
Editor's Notes
Good morning. Thank you for coming to my capstone seminar. My name is Satoshi Hirabayashi. I will talk about my research, examining the impact of raster datasets on flood and low streamflow regional regression models using custom gis applications
Here is outline of today’s talk.
First is abstract.
Here is my research title. This is quite long. So, I will break it down a little bit for you to better understand. First, I will use a lot of raster datasets in this study. Then, because there are so many data, GIS operations will be customized to easily process these datasets. Then, outputs from the GIS application will be used as inputs to the hydrologic modeling. Flood and low streamflow will be modeled. And finally, the impact of raster datasets on those models will be examined.
Introduction.
Of interest is to estimate or predict frequency and magnitude of extreme hydrologic events, flood and low streamflow. There are common statistics to estimate flood and low streamflow. The common flood statistic is 100 year flood, Q100, represents the annual maximum streamflow that is exceeded on average once every 100 years. The common low streamflow statistic is 7-day, 10-year low streamflow, Q7,10, which represents the average annual 7-day minimum streamflow that is exceeded on average in 9 out of every 10 years . Q100, annual maximum flow that occurs once every 100 years on average. Q7,10, annual 7-day minimum flow that occurs once every 10 years on average. There are two situations in the rivers, gauged or ungauged. At the gauged river sites, the streamflows are gauged and recorded. In this case, typically flood and low streamflow statistics can be estimated with a frequency analysis. On the other hand, at the ungauged river sites, streamflow records are not available. In this case, one common way to estimate flood and low streamflow is a regional regression model. This is my interest here, to predict flood and low streamflow at ungauged sites with the regional regression models.
Regional regression models is an equation between Q and Xs. Q is a response variable, in this study, Q100, or Q7,10. Xs are explanatory variables, watershed characteristics. At ungauged sites, watershed characteristics can be measured. But stream data is not available here, so of course, so you can’t calculate Q. So you have Xs here but you don’t have Q here. That means, you can’t determine the relationship here. What you can do is to choose a gauged site in a same region as the ungauged river sites. At gauged sites, watershed characteristics can be measured. And Q can be calculated from streamflow records. So you have both Q and Xs here, so using these values, you can determine the relationship between Q and Xs. Once you develop a regression model, you can apply the developed model to predict the low streamflow statistics at ungauged sites because they are At the same region.
Regional regression model is a mathematical equation. Here Q is flood or low streamflow statistics and Xs are watershed characteristics. Alpha, beta, gamma are model parameters to be estimated. By taking logarithm on both side, a log-linear model is obtained. There is one response variable and two or more explanatory variables. So, this relationship is analyzed with the multiple linear regression technique. I used ordinary least squares regression procedure to estimate model parameters, alpha, beta, gamma.
Now, I will introduce some past studies on flood and low streamflow regional regression models. Traditionally, the regional regression models to estimate flood work relatively good with the standard error of the models is 30-60 %. But, low streamflow regional regression models performed poorly, the standard error is more than 100 %. Some reasons for this poor performance have been pointed out. And here are two reasons. Traditionally, the watershed characteristics were manually derived from the paper map. So the data quality was probably insufficient. Another potential reason is that important watershed characteristics were not used in the model development. This seems to be due to the insufficient data quantity.
My advisor, Dr. Chuck Kroll took countermeasures for data quality and quantity. Two primary data involved in the regional regression model development are streamflow records and watershed characteristics. For streamflow records, they employed data from USGS’s Hydro-Climatic Data Network (HCDN), which meet certain measurement accuracy criteria. So, the quality is good. Also, they employed more than 1500 sites with averagely 44 years of record length. For the watershed characteristics, they used many raster data, 1465 data, and they derived watershed characteristics digitally. As a result, they councluded that the low streamflow regional regression models were improved, throughout the United States.
I will introduce Kroll et al’s processes. There are two major processes, watershed boundary delineation and watershed characteristics derivation. From DEM, and gauging site location, the watershed boundary of interest area can be delineated. This delineated watershed boundary is then overlaid on the raster data, such as climate data, and the spatial average is calculated. This is going to be a watershed characteristic. They didn’t use a GIS package, because there were so many data, and would take so long due to the computer power. So they developed programs in FORTRAN.
Kroll et al’s study motivated this study. They used 1 DEM with approximately 1km horizontal resolution. But now DEMs with finer resolution are available, using finer resolution DEM can enhance the quality of watershed boundary. They used two different climate datasets, one is 49 km resolution, the other is 4km, and the number of each dataset was fourteen hundred and thirteen. The soil data is 1km resolution and 12 data. If I use a finer resolution, quality of watershed characteristics can be improved. And if I use more data, quantity of watershed characteristics can be increased.
Recently, people use a GIS package to process geospatial data. GIS is very useful to derive input parameters to hydrologic models, But, what if there is a large amount of data?? In this study almost fifteen hundred data need to be processed. Can you do that manually? I don’t wanna do that, because, it is tedious, time-consuming, easily produce human errors, ….
Here is outline of today’s talk.
To develop a GIS system to efficiently and effectively derive watershed characteristics. As I said, I will use DEMs with finer horizontal resolution to delineate watershed boundaries, and examine the impact of the horizontal resolution on flood and low streamflow regional regression models. Also, I will use raster data with finer resolution, and new raster data to derive watershed characteristics. Then I will examine the impact of these new raster datasets on flood and low streamflow regional regression models. Of these watershed characteristics, I will examine the most important ones to include in flood and low streamflow regional regression models.
To develop a GIS system to efficiently and effectively derive watershed characteristics. As I said, I will use DEMs with finer horizontal resolution to delineate watershed boundaries, and examine the impact of the horizontal resolution on flood and low streamflow regional regression models. Also, I will use raster data with finer resolution, and new raster data to derive watershed characteristics. Then I will examine the impact of these new raster datasets on flood and low streamflow regional regression models. Of these watershed characteristics, I will examine the most important ones to include in flood and low streamflow regional regression models.
To develop a GIS system to efficiently and effectively derive watershed characteristics. As I said, I will use DEMs with finer horizontal resolution to delineate watershed boundaries, and examine the impact of the horizontal resolution on flood and low streamflow regional regression models. Also, I will use raster data with finer resolution, and new raster data to derive watershed characteristics. Then I will examine the impact of these new raster datasets on flood and low streamflow regional regression models. Of these watershed characteristics, I will examine the most important ones to include in flood and low streamflow regional regression models.
To develop a GIS system to efficiently and effectively derive watershed characteristics. As I said, I will use DEMs with finer horizontal resolution to delineate watershed boundaries, and examine the impact of the horizontal resolution on flood and low streamflow regional regression models. Also, I will use raster data with finer resolution, and new raster data to derive watershed characteristics. Then I will examine the impact of these new raster datasets on flood and low streamflow regional regression models. Of these watershed characteristics, I will examine the most important ones to include in flood and low streamflow regional regression models.
Here is outline of today’s talk.
This map shows the standard error of the regional regression models developed by Kroll et al. They generally improved the low streamflow model performance across the country, but, these areas are not very good. Standard error was more than hundred. The models in these regions may be improved with DEMs with finer resolution and more explanatory variables.
Flood regional regression models across the country was developed by the USGS. The performance of these flood models are relatively good. This map shows the number of explanatory variables in the models. In this region, only one variable is used in the models. For instance, in Tennessee, only drainage area is used in the model. Based on these results, the study region of this study was decided. Models in these regions may be improved with more explanatory variables.
Here, Tennessee, Kentucky, and North Carolina region, 36 USGS gauged sites are employed in this study. They are unregulated streams, which means there is no addition or withdrawal of water. They are not affected by regulation, such as reservoir releases. Streamflow data for these sites are recorded in the USGS national water information system (NWIS). They have more than 10 years of streamflow records.
This list presents the employed data. General watershed characteristics for the study region were obtained from the USGS. DEMs I used are Hydro1k DEM, 1-degree DEM and National elevation dataset (NED) DEM, horizontal resolution of these DEMs are 1 km, 85m, and 30 m, respectively. Soil data is USDA’s STATSGO. Climate is PRISM. Soil and climate data are same as Kroll et al’s, but the resolution of climate is much finer. They used 49 km, but this study used 4 km. I employed hydrology and hydrogeology data from USGS kansas water science center. As an initial investigation into methods to quantify hydrologic information from remotely sensed imageries that may aid in the prediction of extreme hydrologic events. Here I used raw data obtained by the MODIS (Moderate Resolution Imaging Spectroradiometer) sensor onboard NASA's Terra satellite.
This figure shows the overall GIS processes in this study. There are three main tasks, watershed boundary delineation, preprocess, and spatial statistics calculation. Watershed boundaries are delineated with Arc Hydro tools.
Basic idea here is that the water flows from points with higher elevation the lower elevation. So, using the elevation information in DEM and outlet point of the stream where the gauging site are located, watershed boundary for each gauging site can be delineated. The first step is fill sinks in DEM, if a cell is surrounded by higher elevation cells, the water is trapped in that cell and cannot flow. The fill sinks function modifies the elevation value to eliminate these problems. The second step is determining the flow direction. From the flow direction grid, watershed boundary is delineated. So I got three watershed boundary sets, which are denoted as WS1k, WS85, and WS30, representing the horizontal resolution of DEM used.
STATSGO toolset create raster datasets from original polygon data and attribute tables.
Developed STATSGO toolset take original STATSGO data as inputs and output the raster data to be used for the watershed characteristics derivation. Original STATSGO data I used is 1 polygon data and 2 attribute tables, soil component table and soil layer table, for each state. These data are inputted to the developed STATSGO toolset. Soil characteristics were weighted according to component percentage and layer thickness, then weighted values were joined to polygons, and a raster data representing a weighted soil characteristics. These processes were performed for each state, and then created raster for each state were merged into one raster data. Raster data representing max and minimum of these soil characteristics were created.
Developed raster toolset take original PRISM data as inputs and output the raster data to be used for the watershed characteristics derivation. Original PRISM data is a raster data in ArcInfo ASCII GRID format. To be used in watershed characteristics derivation, these raster data need to be converted to ESRI GRID format. Since we employed more than fourteen hundred data, it is very tedious to process all of these data manually. So I developed batch algorithm in the raster toolset so that there is only a few user interaction for the process. So physical paths to raster data are listed in the raster list file, and the batch process reads this file, retrieve raster data, then convert them from ASCII GRID format to the ESRI GRID format. Also, projection of these raster data need to be converted to the same projection as the watershed boundaries. Again, this process can be performed in a batch process, and minimum of these soil characteristics were created. Original PRISM data covers conterminous United States. But that is too large for this study, it would take longer if you used this data for watershed characteristics derivation, so I decided to develop a clipping function in the raster toolset. This is again performed in a batch process. As a result of those batch processes, clipped PRISM raster datasets were prepared. And they include …
Hydrology and hydrogeology data are provided in the ESRI GRID format. So There is no need to convert the format. But still projection conversion and clipping are necessary, they can be done the batch process in raster toolset. As a result, four raster datasets, that represents Base flow index, groundwater recharge, infiltration excess overland flow, saturation excess overland flow.
MODIS data are originally in hierarchical data format (HDF) format. These data are first processed in ENVI and exported to raster data in ESRI GRID format. Then, using the batch process I have talked, the projection conversion and clipping were performed. Prepared raster data are calibrated radiance on march 6, 2000, that is in the typical wet season in the study region And Sep. 6, Oct, 3, and so on in the typical dry season. My expectation is this data in wet season has some impact on flood models, and these dry season data have some impact on low streamflow models.
Table toolset creates a table where watershed characteristics will be stored.
Developed table toolset take gauging site and table list file as inputs and create initial watershed characteristic tables where the watershed characteristics for each watershed are stored.
Now all of these raster data and a table are ready. Then, paths to raster datasets are listed in a raster list file. Spatial statistics toolset computes the spatial statistics and save them in the table.
Paths to raster datasets and type of statistics to be computed are listed in a raster list file. You can specify, mean, maximum, minimum, standard deviation, and so on. Also this toolset takes watershed boundary data that will be overlaid on raster data. Then, spatial statistics are computed in the batch process and calculated statistics are stored in the table.
Now I summarize the GIS processes. These watershed boundaries were delineated from DEMs with 1km, 85m, and 30m horizontal resolution. These raster data were pre-processed with the developed toolsets. And then, the watershed boundaries were overlaid on the raster data and spatial statistics were computed and save in the watershed characteristic tables for each watershed boundary set.
In addition to the watershed characteristics explained so far, I added 4 topography variables computed from DEMs. And also, added 1 hydrology variable, surface flow index (SFI), which is computed as 100 - base flow index (BFI). Base flow is the component of streamflow that is contributed from ground water discharge. BFI is average percentage of base flow in annual streamflow. And SFI is average percentage of surface flow in annual streamflow. Also, I summarized 40 year monthly record of precipitation, max and minimum temperatures. They are 40-year record from Jan to Dec, totally 480 variables. They are divided into four seasonal windows and averaged. Then, they are fitted to a certain distribution and these percentiles were computed, resulting 36 variables. So, 480 variables of monthly precipitation were summarized to 36 variables. Max, and min temp are also summarized.
The watershed char. Table is a big table, and we categorized variables in the table into 4 classes.
Then, from A, B, C, D category, I made five combination of explanatory variables. So, performance of the model developed with only USGS traditional watershed characteristics were this. Then, add topography, soil, and climate data and build the models again, they, these models may be better than the model with only A. and so on.
For each watershed boundary set, potential explanatory variable combinations were used to develop the models. Criteria for the model construction are, # of explanatory variables, I developed model with 2, 3, and 4 explanatory variables. To determine which explanatory variables enter the model, I employed the stepwise regression procedure with 5 % of significance level to enter and stay in the models. Model parameters should be significant at 5 % significance level.
Here is outline of today’s talk.
This chart presents the standard error for all the flood regional regression models. Model with WS1k and A variable combination, A+B variable combination, and so on. Within a single watershed boundary set, models with the ALL variable combination were the best. So I use these results to compare DEM effects. Then, I will use WS1k result to compare the explanatory variable effects.
Same
Flood regional regression models developed with the ALL potential explanatory variable combination. They are almost same.
Low streamflow regional regression models developed with the ALL potential explanatory variable combination. They are almost same.
Why it happens? Now I will show you how the delineated watershed boundary are actually differ. This is WS1k polygon.
If I overlay WS85 polygon.
Then, I overlay WS30.
Now, let’s take a look at the variable combination impact on the flood model performance. Models developed with only A is the worst. Also, A+D combination produces the worst performance. A+D, is a traditional watershed characteristics and MODIS data, so MODIS data has nothing to do with flood models. Adding B, C, and B,C,D improved the models. Now let’s take a closer look at the explanatory variables in the models. Here are the model equations. For A, A+D, A+C, only two explanatory variables entered the model, satisfying the criteria. For A+B, up to four variables entered. And, note that the variables entered the model in this order. So, 2-variable model contains DA and DTMIN75, 3-variable model contain DA, DTMIN75, and FOREST, and so on. Which category are these variable belong to? A, B, C or D? Drainage area from A entered all models. Only with the SFI, surface flow index, the model is improved a lot.
This is for the low streamflow models. It shows the same trends as the flood except for A+D combination. A is the worst, other combinations are better. For flood models, A and A+D were exactly same, but here A+D combination produced the better models. Now let’s look at the model equations and category of the explanatory variables. Drainage area from A entered all models.
This is a typical hydrograph of a storm event. Sources of these streamflow are roughly divided into two flows, base flow, (or ground water discharge) and surface flow. Base flow index is a long-term average percentage of base flow in annual streamflow. Usually streamflow records are needed to compute BFI. But the new approach was taken here, the BFI for more than eight thousand gauged sites were computed. And then, they were interpolated for the conterminous US.
Here is outline of today’s talk.
Both Q100 and Q7,10 can be computed from the streamflow records using a log-Pearson type 3 distribution. First, the annual maximum flow for each year is calculated, then natural log is taken, and the histogram is made. And it is assumed that this distribution fits a log-Pearson type 3 distribution. Q100 is this point that represents the 99 th percentile of the distribution. Calculation of Q7,10 is similar. First,the annual minimum flow for 7 consecutive day for each year is calculated, then natural log is take, and plotted in the hitogram. And it is assumed that this distribution fits a log-Pearson type 3 distribution. Q7,10 is this point and represents 10 th percentile of this distribution.
In addition to the watershed characteristics explained so far, I added 4 topography variables computed from DEMs. And also, added 1 hydrology variable, surface flow index (SFI), which is computed as 100 - base flow index (BFI). Base flow is the component of streamflow that is contributed from ground water discharge. BFI is average percentage of base flow in annual streamflow. And SFI is average percentage of surface flow in annual streamflow. Also, I summarized 40 year monthly record of precipitation, max and minimum temperatures. They are 40-year record from Jan to Dec, totally 480 variables. They are divided into four seasonal windows and averaged. Then, they are fitted to a certain distribution and these percentiles were computed, resulting 36 variables. So, 480 variables of monthly precipitation were summarized to 36 variables. Max, and min temp are also summarized.
Now let’s take a look at how the DEM horizontal resolution affects the derived watershed characteristics. Here is an example. These polygon data are watershed boundaries included in WS1k, WS85, and WS30. For an example, if they are overlaid on the 30-year average January precipitation and grids within the polygon are averaged. Differences are very small.
Of interest is how the derived watershed characteristics changed based on both the horizontal resolution of the DEM and raster datasets. This chart shows the average percent difference of derived watershed characteristics between each of the three sets of watershed boundaries (WS1k, WS85, and WS30). This indicates that, when you use MODIS data, which is the finest resolution, average difference between WS1k and WS30 is the largest, but is just 3.1 %. Other cases produce the smaller difference. Therefore, there are only small differences in watershed characteristics, and that leads to the small differences in the performance of developed models.
Now, let’s take a look at the variable combination impact on the flood model performance. Models developed with only A is the worst. Also, A+D combination produces the worst performance. A+D, is a traditional watershed characteristics and MODIS data, so MODIS data has nothing to do with flood models. Adding B, C, and B,C,D improved the models. Now let’s take a closer look at the explanatory variables in the models. Here are the model equations. For A, A+D, A+C, only two explanatory variables entered the model, satisfying the criteria. For A+B, up to four variables entered. And, note that the variables entered the model in this order. So, 2-variable model contains DA and DTMIN75, 3-variable model contain DA, DTMIN75, and FOREST, and so on. Which category are these variable belong to? A, B, C or D? Drainage area from A entered all models. Only with the SFI, surface flow index, the model is improved a lot.
This is for the low streamflow models. It shows the same trends as the flood except for A+D combination. A is the worst, other combinations are better. For flood models, A and A+D were exactly same, but here A+D combination produced the better models. Now let’s look at the model equations and category of the explanatory variables. Drainage area from A entered all models.
![Outline ,[object Object],[object Object],[object Object],[object Object],[object Object],[object Object],Outline](data:image/gif;base64,R0lGODlhAQABAIAAAAAAAP///yH5BAEAAAAALAAAAAABAAEAAAIBRAA7)