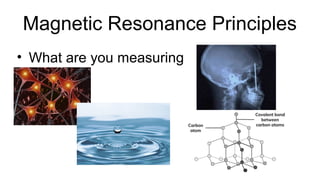
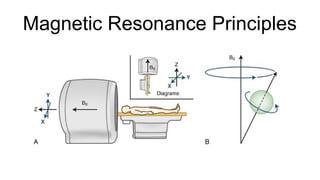
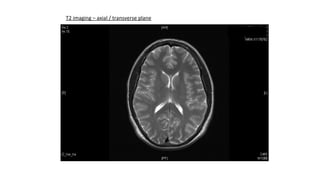
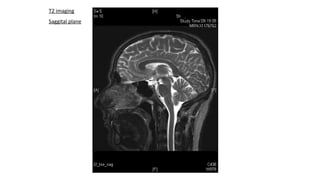
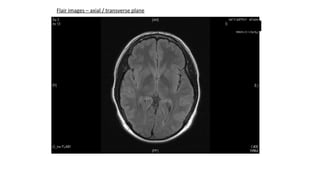
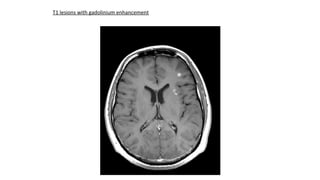
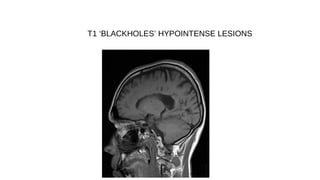
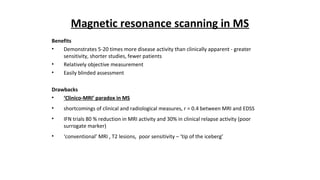
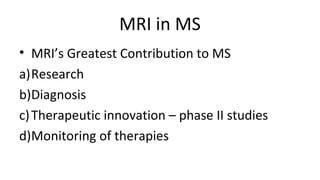
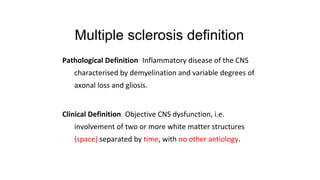
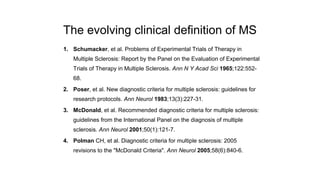
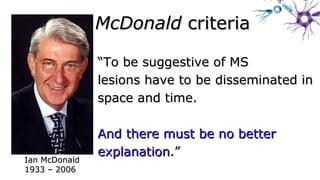
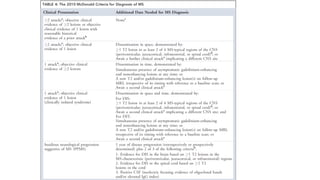
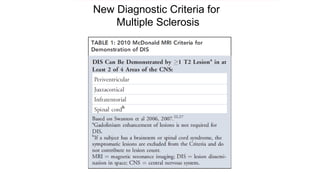
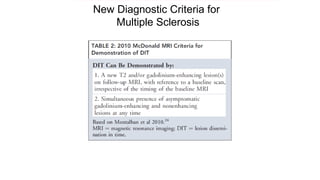
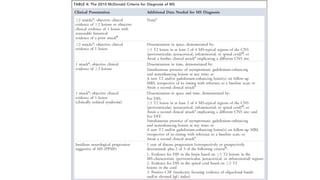
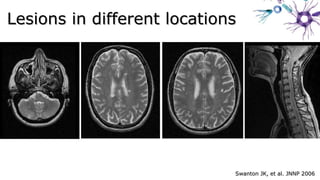
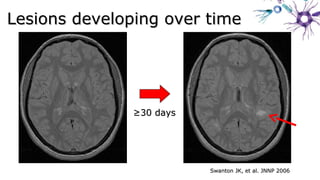
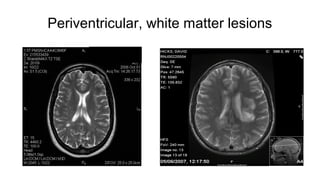
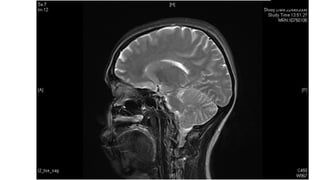
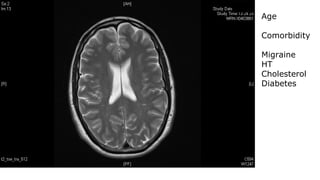
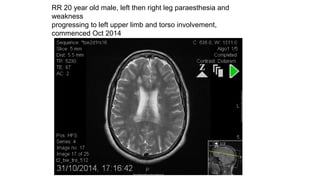
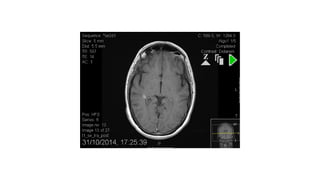
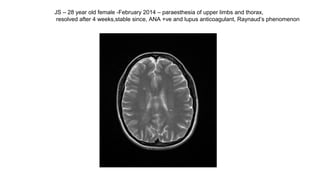
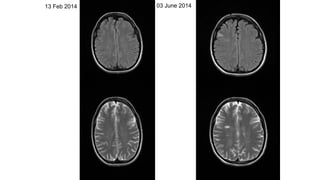
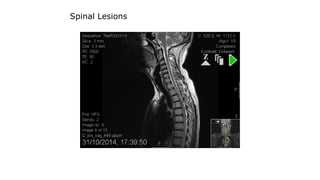
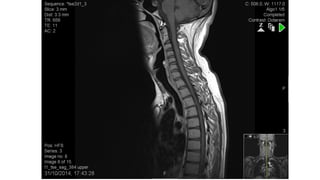
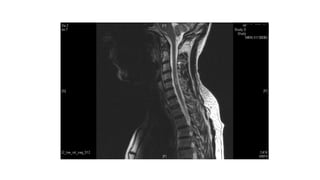
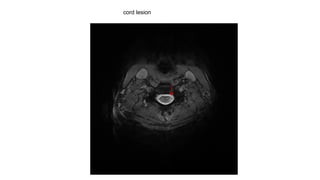
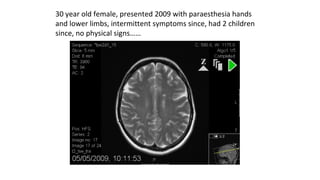
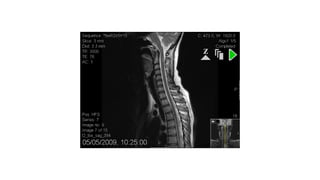
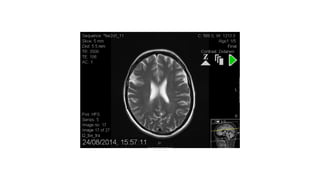
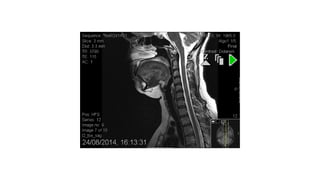
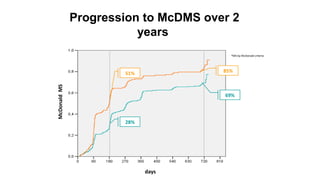
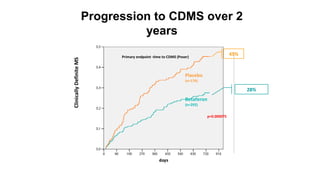
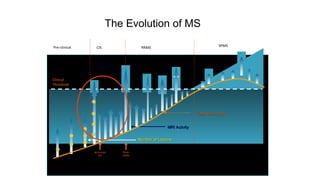
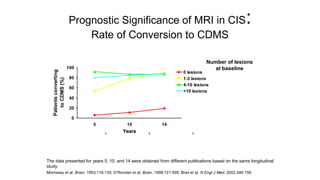
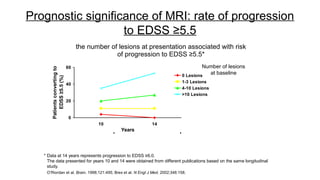
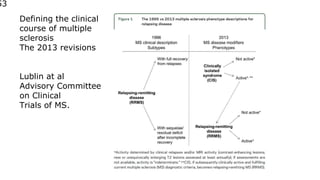
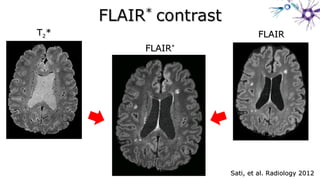
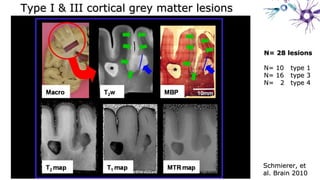
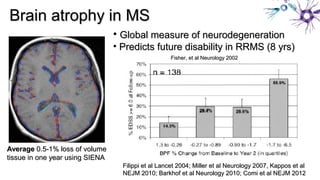
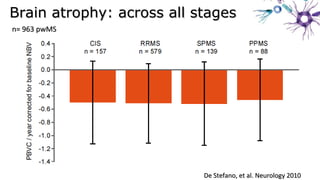
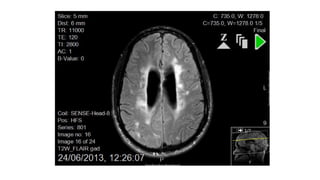
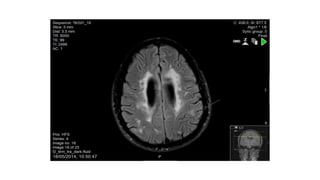
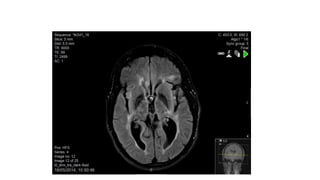
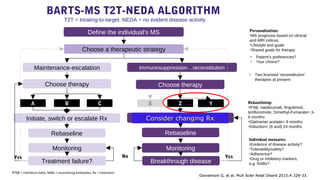
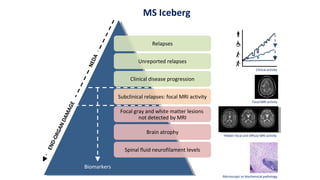
MRI WorkshopMRI Workshop
Dr Ben Turner, MBBS MD FRCPDr Ben Turner, MBBS MD FRCP
Consultant Neurologist and Honorary Senior LecturerConsultant Neurologist and Honorary Senior Lecturer
55thth
November 2018November 2018
MRI Workshop
MRI stands for:
a)Mind Radar Interrogator
b)Molecular Resonance Impact
c)Mama-Mia Repeat Imagine
d)Magnetic Research Impression
Magnetic Resonance Principles
• What are you measuring
Magnetic Resonance Principles
Conventional MRI
Non-conventional
•Magnetic Transfer Imaging
•Spectroscopy
•Microglial activity
•Functional MRI
T2 imaging – axial / transverse plane
T2 imaging
Saggital plane
Flair images – axial / transverse plane
T1 lesions with gadolinium enhancement
T1 ‘BLACKHOLES’ HYPOINTENSE LESIONS
Magnetic resonance scanning in MS
Benefits
• Demonstrates 5-20 times more disease activity than clinically apparent - greater
sensitivity, shorter studies, fewer patients
• Relatively objective measurement
• Easily blinded assessment
Drawbacks
• ‘Clinico-MRI’ paradox in MS
• shortcomings of clinical and radiological measures, r = 0.4 between MRI and EDSS
• IFN trials 80 % reduction in MRI activity and 30% in clinical relapse activity (poor
surrogate marker)
• ‘conventional’ MRI , T2 lesions, poor sensitivity – ‘tip of the iceberg’
MRI in MS
• MRI’s Greatest Contribution to MS
a)Research
b)Diagnosis
c)Therapeutic innovation – phase II studies
d)Monitoring of therapies
New Diagnostic Criteria for
Multiple Sclerosis
Multiple sclerosis definition
Pathological Definition: Inflammatory disease of the CNS
characterised by demyelination and variable degrees of
axonal loss and gliosis.
Clinical Definition: Objective CNS dysfunction, i.e.
involvement of two or more white matter structures
(space) separated by time, with no other aetiology.
The evolving clinical definition of MS
1. Schumacker, et al. Problems of Experimental Trials of Therapy in
Multiple Sclerosis: Report by the Panel on the Evaluation of Experimental
Trials of Therapy in Multiple Sclerosis. Ann N Y Acad Sci 1965;122:552-
68.
2. Poser, et al. New diagnostic criteria for multiple sclerosis: guidelines for
research protocols. Ann Neurol 1983;13(3):227-31.
3. McDonald, et al. Recommended diagnostic criteria for multiple sclerosis:
guidelines from the International Panel on the diagnosis of multiple
sclerosis. Ann Neurol 2001;50(1):121-7.
4. Polman CH, et al. Diagnostic criteria for multiple sclerosis: 2005
revisions to the "McDonald Criteria". Ann Neurol 2005;58(6):840-6.
““To be suggestive of MSTo be suggestive of MS
lesions have to be disseminated inlesions have to be disseminated in
space and time.space and time.
And there must be no betterAnd there must be no better
explanationexplanation.”.”
Ian McDonaldIan McDonald
1933 – 20061933 – 2006
McDonaldMcDonald criteriacriteria
Clinically Isolated Syndrome
Definition - a first neurological event suggestive of Multiple Sclerosis
lasting for at least 24 hours and with symptoms and signs indicating
a single or multiple lesions.
e.g. – optic neuritis, spinal cord syndrome, brainstem lesion – INO
Sensory Symptoms – 34 %
Weakness 22 %
Ataxia 11 %
Visual symptoms 13 %
Diplopia 8 %
Bladder symptoms 1 %
New Diagnostic Criteria for
Multiple Sclerosis
New Diagnostic Criteria for
Multiple Sclerosis
Swanton JK, et al. JNNP 2006Swanton JK, et al. JNNP 2006
Lesions in different locationsLesions in different locations
Swanton JK, et al. JNNP 2006Swanton JK, et al. JNNP 2006
Lesions developing over timeLesions developing over time
≥≥30 days30 days
Periventricular, white matter lesions
Age
Comorbidity
Migraine
HT
Cholesterol
Diabetes
RR 20 year old male, left then right leg paraesthesia and
weakness
progressing to left upper limb and torso involvement,
commenced Oct 2014
JS – 28 year old female -February 2014 – paraesthesia of upper limbs and thorax,
resolved after 4 weeks,stable since, ANA +ve and lupus anticoagulant, Raynaud’s phenomenon
13 Feb 2014 03 June 2014
Whiting, et al. BMJ 2006;332(7546):875-84.
““Many evaluations of the accuracy of magnetic resonance
imaging for the early detection of multiple sclerosis have
produced inflated estimates of test performance owing to
methodological weaknesses. Use of magnetic resonance
imaging to confirm multiple sclerosis on the basis of a single
attack of neurological dysfunction may lead to over-diagnosis
and over- treatment.”
03 March 2014 31 March 2014 03 June 2014
Infratentorial Lesions
31 March 2014 Gadolinium enhancement of symptomatic lesion
Spinal Lesions
cord lesion
30 year old female, presented 2009 with paraesthesia hands
and lower limbs, intermittent symptoms since, had 2 children
since, no physical signs……
days
Progression to McDMS over 2
years
*MS by McDonald criteria
McDonaldMS
85%
69%
51%
28%
ClinicallyDefiniteMS Placebo
(n=176)
Betaferon
(n=292)
45%
28%
Progression to CDMS over 2
years
Primary endpoint -time to CDMS (Poser)
p=0.000075
The Evolution of MS
Clinical
Threshold
MRI ActivityMRI Activity
Number of LesionsNumber of Lesions
Total lesion loadTotal lesion load
CIS RRMS SPMSPre-clinical
McDonald
MS
Poser
CDMS
First clinical
event
Prognostic Significance of MRI in CIS:
Rate of Conversion to CDMS
Number of lesions
at baseline
The data presented for years 5, 10, and 14 were obtained from different publications based on the same longitudinal
study.
Morrissey et al. Brain. 1993;116:135; O’Riordan et al. Brain. 1998;121:495; Brex et al. N Engl J Med. 2002;346:158.
0
20
40
60
80
100
5 10 14
Years
Patientsconverting
toCDMS(%)
0 lesions
1-3 lesions
4-10 lesions
>10 lesions
0
20
40
60
10 14
Years
Patientsconvertingto
EDSS≥5.5(%)
0 Lesions
1-3 Lesions
4-10 Lesions
>10 Lesions
Prognostic significance of MRI: rate of progression
to EDSS ≥5.5
the number of lesions at presentation associated with risk
of progression to EDSS ≥5.5*
* Data at 14 years represents progression to EDSS ≥6.0.
The data presented for years 10 and 14 were obtained from different publications based on the same longitudinal
study.
O’Riordan et al. Brain. 1998;121:495; Brex et al. N Engl J Med. 2002;346:158.
Number of lesions
at baseline
27 21 18 15 30
26
26
28
25
33
20
17
14
13
11
0
20
40
60
T2LV
0 5 10 14 20
year
CIS RRMS
SPMS
Bars show IQR; Numbers of patients shown
Fig1: Median T2 lesion volume (T2LV) (cm3
) over time
for patient groups
20-year follow-up
Results: Serial median T2 LL (cm3)
European Charcot Foundation Satellite Symposium, ECTRIMS, Prague 11/10/2007Fisniku LK et al. Unpublished
Estimated rate of lesion growth in SPMS
2.89 cm3
/year
Estimated rate of lesion growth in RRMS
0.80 cm3
/year (p<0.001)
Baseline brain and spinal MRI predictors
of SPMS 15 years after CIS
Odds ratio 95% CI p
Baseline GdE lesions
1
2+
Baseline spinal cord lesions
1.33
3.16
4.71
0.35, 5.07
1.08, 9.23
1.72, 12.92
0.68
0.04
<0.01
Estimated risk of SPMS at 15 years
No gad lesions and no spinal cord lesions = 5.3%
Two gad lesions and at least one spinal cord lesion = 45.5%
Brownlee et al. ECTRIMS 2017
53
Defining the clinical
course of multiple
sclerosis
The 2013 revisions
Lublin at al
Advisory Committee
on Clinical
Trials of MS.
Verifying MRI detected pathology:Verifying MRI detected pathology:
Co-registration IICo-registration II
Schmierer-lab, Blizard InstituteSchmierer-lab, Blizard Institute
9
*
*
*
**
*
*
*
**
b
*
?
* 10mm
Schmierer-lab, Blizard InstituteSchmierer-lab, Blizard Institute
Marburg O. Jahrbücher für Psychiatrie und Neurologie 27, 1906.Marburg O. Jahrbücher für Psychiatrie und Neurologie 27, 1906.
““In terms of location lesions seem distributed atIn terms of location lesions seem distributed at
random. In the spinal cord there is perhaps a slightrandom. In the spinal cord there is perhaps a slight
preference for the white mater… Distribution ofpreference for the white mater… Distribution of
lesions in the cerebrum is non-systematic…lesions in the cerebrum is non-systematic… In theIn the
cortex lesions preferentially affect inner, rather thancortex lesions preferentially affect inner, rather than
superficial layers.”superficial layers.”
Sethi, et al.Sethi, et al.
JNNP 2012JNNP 2012
DIRDIR FLAIRFLAIR PSIRPSIR
PSIR= Phase sensitive reconstructed IR (range of TPSIR= Phase sensitive reconstructed IR (range of T11w factor -1 to 1 instead of 0 to 1 in Tw factor -1 to 1 instead of 0 to 1 in T11SE)SE)
Cortical grey matter pathologyCortical grey matter pathology
• DemyelinationDemyelination
• RemyelinationRemyelination
• BBB disruptionBBB disruption
• (Meningeal) inflammation / macrophages(Meningeal) inflammation / macrophages
• Neuronal lossNeuronal loss
• GliosisGliosis
• AtrophyAtrophy
• Iron depositsIron deposits
• ……
Causes of MRI ‘white matter’ lesionsCauses of MRI ‘white matter’ lesions
Multiple sclerosisMultiple sclerosis
Ageing (30% of subjects aged > 50 years)Ageing (30% of subjects aged > 50 years)
Cerebro-vascular diseaseCerebro-vascular disease
LeucodystrophiesLeucodystrophies HTLV-1 a/myelopathyHTLV-1 a/myelopathy
NeurosarcoidosisNeurosarcoidosis HydrocephalusHydrocephalus
Neuromyelitis opticaNeuromyelitis optica IrradiationIrradiation
Acute disseminated encephalomyelitisAcute disseminated encephalomyelitis LymphomaLymphoma
Systemic lupus erythematosusSystemic lupus erythematosus ToxinsToxins
Behcet’s diseaseBehcet’s disease PhenylketonuriaPhenylketonuria
PMLPML HIVHIV
Decompression sicknessDecompression sickness SSPESSPE
CADASILCADASIL
CNS vasculitisCNS vasculitis and more…and more…
MS under the microscopeMS under the microscope
The veins in MS LesionsThe veins in MS Lesions
Schmierer, et al. Ann Neurol 2004Schmierer, et al. Ann Neurol 2004
The blood inThe blood in
TT22** FLAIRFLAIR
FLAIRFLAIR**
Sati, et al. Radiology 2012Sati, et al. Radiology 2012
TheThe
“vein in lesion”“vein in lesion”
o n= 25 pwRMS, 10 pwSVDn= 25 pwRMS, 10 pwSVD
o MRI @ 3T:MRI @ 3T:
o 3D FLAIR (post Gd injection),3D FLAIR (post Gd injection),
3D T3D T22 and Tand T22**
Tom CampionTom CampionMarc MiquelMarc Miquel
Campion, et al.Campion, et al. under revisionunder revision
Mistry et al. JAMA Neurol. 2013;70:623-8.Mistry et al. JAMA Neurol. 2013;70:623-8.
• 338 lesions (13.5 ± 7)338 lesions (13.5 ± 7)
• Proportion of CVSProportion of CVS++
lesions: 88%lesions: 88%
• All patients met MSAll patients met MS
criterion (≥45% CVScriterion (≥45% CVS++
))
• 3/25 fulfilled McDonald3/25 fulfilled McDonald
criteriacriteria using a singleusing a single
MRI head scan.MRI head scan.
Results – FLAIR* in MS & SVDResults – FLAIR* in MS & SVD
Campion, et al.Campion, et al. under revisionunder revision
Schmierer, etSchmierer, et
al. Brain 2010al. Brain 2010
N= 28 lesionsN= 28 lesions
N= 10N= 10 type 1type 1
N= 16N= 16 type 3type 3
N= 2N= 2 type 4type 4
Type I & III cortical grey matter lesionsType I & III cortical grey matter lesions
AverageAverage 0.5-1% loss of volume0.5-1% loss of volume
tissue in one year using SIENAtissue in one year using SIENA
Brain atrophy in MSBrain atrophy in MS
• Global measure of neurodegenerationGlobal measure of neurodegeneration
• Predicts future disability in RRMS (8 yrs)Predicts future disability in RRMS (8 yrs)
Fisher, et al Neurology 2002Fisher, et al Neurology 2002
Filippi et al Lancet 2004; Miller et al Neurology 2007, Kappos et alFilippi et al Lancet 2004; Miller et al Neurology 2007, Kappos et al
NEJM 2010; Barkhof et al Neurology 2010; Comi et al NEJM 2012NEJM 2010; Barkhof et al Neurology 2010; Comi et al NEJM 2012
Brain atrophy: across all stagesBrain atrophy: across all stages
n= 963 pwMSn= 963 pwMS
De Stefano, et al. Neurology 2010De Stefano, et al. Neurology 2010
Assumptions & hypothesisAssumptions & hypothesis
1.1. Spinal cord atrophy predicts disabilitySpinal cord atrophy predicts disability
2.2. Disability is due to axonal lossDisability is due to axonal loss
3.3. Hence, axonal loss must be the keyHence, axonal loss must be the key
substrate of spinal cord atrophy!substrate of spinal cord atrophy!
Revisiting spinal cord axonal lossRevisiting spinal cord axonal loss
D CarassitiD Carassiti
F ScaravilliF Scaravilli
N PetrovaN Petrova
Petrova, et al.Petrova, et al. under revisionunder revision
Spinal cordsSpinal cords n=13 pwMS and n=5 HCn=13 pwMS and n=5 HC
Age (years)Age (years) MS: 65 ± 11 HC: 82 ± 7MS: 65 ± 11 HC: 82 ± 7
MS durationMS duration 29 ± 11 years29 ± 11 years
-Sequential sections of tissue blocks obtained at everySequential sections of tissue blocks obtained at every
available nerve root levelavailable nerve root level
-Immuno-stained for myelin basic protein andImmuno-stained for myelin basic protein and
phosphorylated neurofilaments.phosphorylated neurofilaments.
Material & methodsMaterial & methods
Petrova, et al.Petrova, et al. under revisionunder revision
ResultsResults
- 20%- 20%
Petrova, et al.Petrova, et al. under revisionunder revision
JNNP 2014JNNP 2014
Ann Neurol 2014;76:568-80Ann Neurol 2014;76:568-80
n= 113 pwMSn= 113 pwMS
n= 20 HCn= 20 HC
3T MRI (PSIR) @ level C2/33T MRI (PSIR) @ level C2/3
• n= 182 cases, 7562 lesionsn= 182 cases, 7562 lesions
• Mean disease duration= 29 yearsMean disease duration= 29 years
• 57% of lesions mixed in/active (chronic active)57% of lesions mixed in/active (chronic active)
• Shorter time to EDSS 6 correlates with:Shorter time to EDSS 6 correlates with:
– higher lesion loadhigher lesion load
– higher proportion of chronic active lesionshigher proportion of chronic active lesions
• PP and SP show comparable lesion activityPP and SP show comparable lesion activity
MyelinMyelin AxonsAxons
Above lesionAbove lesion
Below lesionBelow lesion
LesionLesion
Petrova, et al. Brain Pathol 2018;28:334-48.Petrova, et al. Brain Pathol 2018;28:334-48.
Demyelination has significant effect on axonal lossDemyelination has significant effect on axonal loss
Petrova, et al. Brain Pathol 2018;28:334-48.Petrova, et al. Brain Pathol 2018;28:334-48.
Demyelination has significant effect on axonal lossDemyelination has significant effect on axonal loss
Axonal lossAxonal loss
- 60%- 60%
Petrova, et al. Brain Pathol 2018;28:334-48.Petrova, et al. Brain Pathol 2018;28:334-48.
Only predictor of axonal loss:Only predictor of axonal loss:
DDisease Durationisease Duration
-- 39%39%
MSMS No MSNo MS
Carassiti D et al. Neuropathol Appl Nerobiol 2017; doi: 10.1111/nan.12405.doi: 10.1111/nan.12405.
Grey matter volume loss and disabilityGrey matter volume loss and disability
Fisniku, et al. Ann Neurol 2008Fisniku, et al. Ann Neurol 2008
n= 73 patients with initial diagnosis CIS, followed up for 20 yearsn= 73 patients with initial diagnosis CIS, followed up for 20 years
MRI in monitoring
Rio et al ECTRIMS 2015
Quixotic guidelines
209 patients
84
Pooled analysis of those with ≥1 gadolinium-enhancing lesion
Accuracy improves significantly when looking for gadolinium-enhancing lesions rather than new T2
lesions; when compared with image analysis software, concordance correlation was high (0.8–0.96)
for gadolinium-enhancing lesions, intermediate (0.6– 0.8) for new T2 lesions, and very poor (0.0–
0.14) for enlarging lesions.
Pooled analysis of those with ≥1 new T2 lesion at 1 year
85
13,500
Principles and Challenges of NEDA
86
In other fields, also known as ‘treat to target’ (TTT)
TTT is proactive, has a clear endpoint (the “target”), and can
be operationalized as a specific treatment algorithm,
simplifying the multitude of complex medication sequences.
Long established in diabetes – HbA1C, hyperlipidaemia,
hypertension
RA – similar issues to MS, less well defined targets – patient
symptoms (subjectivity)
Pt perception of benefit and risk of escalation of therapies
T2 lesions are an objective measure of disease activity
Solomon, D. H., A. Bitton, J. N. Katz, H. Radner, E. M. Brown and L. Fraenkel (2014). "Review:
treat to target in rheumatoid arthritis: fact, fiction, or hypothesis?" Arthritis Rheumatol 66(4):
775-782.
NEDANEDA
Is it time to target no evident disease activity (NEDA) in
multiple sclerosis?
Giovannoni G, Turner B, Gnanapavan S, Offiah C, Schmierer K, Marta M.
Mult Scler Relat Disord. 2015 Jul;4(4):329-33. doi:
10.1016/j.msard.2015.04.006. Epub 2015 May 8. Review.
1.Relapses
2.Disability progrression
3.MRI lesional activity
• Gd enhancing lesions
• T2 lesions
DB - ? escalation
• FS – 2000 right sided paraesthesia
• Diagnosed 2002
• 2002 May commenced Copaxone, did not tolerate
• 2004 – October Avonex (eventually)
• 2005 – relapse, switched to Rebif, ab neg, 1-2
relapses per year
• Rebif IFN 2010
• 2013 June - fingolimod
Choose therapy
A B C
Define the individual’s MS
Treatment failure?
• Patient’s preferences?
• Your choice?
Individual measures:
•Evidence of disease activity?
•Tolerability/safety?
•Adherence?
•Drug or inhibitory markers,
e.g. NABs?
Monitoring
Personalisation:
•MS prognosis based on clinical
and MRI indices
•Lifestyle and goals
•Shared goals for therapy
Rebaseline
Rebaselining:
•IFNβ, natalizumab, fingolimod,
teriflunomide, Dimethyl-Fumarate= 3-
6 months
•Glatiramer acetate= 9 months
•Induction= (6 and) 24 months
Choose a therapeutic strategy
Maintenance-escalation Immunosuppression…reconstitution
Choose therapy
X Z
Rebaseline
Monitoring
Initiate, switch or escalate Rx Complete course / Re-treat
Breakthrough disease
NoYes Yes
• Two licensed ‘reconstitution’
therapies at present
IFNβ = interferon-beta; NABs = neutralizing antibodies; Rx = treatment
Giovannoni G, et al. Mult Scler Relat Disord 2015;4:329-33.Giovannoni G, et al. Mult Scler Relat Disord 2015;4:329-33.
Y
Consider changing RxConsider changing Rx
BARTS-MS T2T-NEDA ALGORITHM
T2T = treating-to-target; NEDA = no evident disease activity
Relapses
Unreported relapses
Clinical disease progression
Subclinical relapses: focal MRI activity
Focal gray and white matter lesions
not detected by MRI
Brain atrophy
Spinal fluid neurofilament levels
MS Iceberg
Clinical activity
Focal MRI activity
Hidden focal and diffuse MRI activity
Microscopic or biochemical pathology
Biomarkers
NEDA
END-ORGANDAMAGE

Ben Turner - MRI workshop

  • 1.
    MRI WorkshopMRI Workshop DrBen Turner, MBBS MD FRCPDr Ben Turner, MBBS MD FRCP Consultant Neurologist and Honorary Senior LecturerConsultant Neurologist and Honorary Senior Lecturer 55thth November 2018November 2018
  • 2.
    MRI Workshop MRI standsfor: a)Mind Radar Interrogator b)Molecular Resonance Impact c)Mama-Mia Repeat Imagine d)Magnetic Research Impression
  • 3.
    Magnetic Resonance Principles •What are you measuring
  • 4.
  • 5.
  • 6.
    Conventional MRI Non-conventional •Magnetic TransferImaging •Spectroscopy •Microglial activity •Functional MRI
  • 7.
    T2 imaging –axial / transverse plane
  • 8.
  • 9.
    Flair images –axial / transverse plane
  • 10.
    T1 lesions withgadolinium enhancement
  • 11.
  • 12.
    Magnetic resonance scanningin MS Benefits • Demonstrates 5-20 times more disease activity than clinically apparent - greater sensitivity, shorter studies, fewer patients • Relatively objective measurement • Easily blinded assessment Drawbacks • ‘Clinico-MRI’ paradox in MS • shortcomings of clinical and radiological measures, r = 0.4 between MRI and EDSS • IFN trials 80 % reduction in MRI activity and 30% in clinical relapse activity (poor surrogate marker) • ‘conventional’ MRI , T2 lesions, poor sensitivity – ‘tip of the iceberg’
  • 13.
    MRI in MS •MRI’s Greatest Contribution to MS a)Research b)Diagnosis c)Therapeutic innovation – phase II studies d)Monitoring of therapies
  • 14.
    New Diagnostic Criteriafor Multiple Sclerosis
  • 15.
    Multiple sclerosis definition PathologicalDefinition: Inflammatory disease of the CNS characterised by demyelination and variable degrees of axonal loss and gliosis. Clinical Definition: Objective CNS dysfunction, i.e. involvement of two or more white matter structures (space) separated by time, with no other aetiology.
  • 16.
    The evolving clinicaldefinition of MS 1. Schumacker, et al. Problems of Experimental Trials of Therapy in Multiple Sclerosis: Report by the Panel on the Evaluation of Experimental Trials of Therapy in Multiple Sclerosis. Ann N Y Acad Sci 1965;122:552- 68. 2. Poser, et al. New diagnostic criteria for multiple sclerosis: guidelines for research protocols. Ann Neurol 1983;13(3):227-31. 3. McDonald, et al. Recommended diagnostic criteria for multiple sclerosis: guidelines from the International Panel on the diagnosis of multiple sclerosis. Ann Neurol 2001;50(1):121-7. 4. Polman CH, et al. Diagnostic criteria for multiple sclerosis: 2005 revisions to the "McDonald Criteria". Ann Neurol 2005;58(6):840-6.
  • 17.
    ““To be suggestiveof MSTo be suggestive of MS lesions have to be disseminated inlesions have to be disseminated in space and time.space and time. And there must be no betterAnd there must be no better explanationexplanation.”.” Ian McDonaldIan McDonald 1933 – 20061933 – 2006 McDonaldMcDonald criteriacriteria
  • 20.
    Clinically Isolated Syndrome Definition- a first neurological event suggestive of Multiple Sclerosis lasting for at least 24 hours and with symptoms and signs indicating a single or multiple lesions. e.g. – optic neuritis, spinal cord syndrome, brainstem lesion – INO Sensory Symptoms – 34 % Weakness 22 % Ataxia 11 % Visual symptoms 13 % Diplopia 8 % Bladder symptoms 1 %
  • 21.
    New Diagnostic Criteriafor Multiple Sclerosis
  • 22.
    New Diagnostic Criteriafor Multiple Sclerosis
  • 25.
    Swanton JK, etal. JNNP 2006Swanton JK, et al. JNNP 2006 Lesions in different locationsLesions in different locations
  • 26.
    Swanton JK, etal. JNNP 2006Swanton JK, et al. JNNP 2006 Lesions developing over timeLesions developing over time ≥≥30 days30 days
  • 27.
  • 29.
  • 30.
    RR 20 yearold male, left then right leg paraesthesia and weakness progressing to left upper limb and torso involvement, commenced Oct 2014
  • 32.
    JS – 28year old female -February 2014 – paraesthesia of upper limbs and thorax, resolved after 4 weeks,stable since, ANA +ve and lupus anticoagulant, Raynaud’s phenomenon
  • 33.
    13 Feb 201403 June 2014
  • 34.
    Whiting, et al.BMJ 2006;332(7546):875-84. ““Many evaluations of the accuracy of magnetic resonance imaging for the early detection of multiple sclerosis have produced inflated estimates of test performance owing to methodological weaknesses. Use of magnetic resonance imaging to confirm multiple sclerosis on the basis of a single attack of neurological dysfunction may lead to over-diagnosis and over- treatment.”
  • 35.
    03 March 201431 March 2014 03 June 2014 Infratentorial Lesions
  • 36.
    31 March 2014Gadolinium enhancement of symptomatic lesion
  • 38.
  • 41.
  • 42.
    30 year oldfemale, presented 2009 with paraesthesia hands and lower limbs, intermittent symptoms since, had 2 children since, no physical signs……
  • 46.
    days Progression to McDMSover 2 years *MS by McDonald criteria McDonaldMS 85% 69% 51% 28%
  • 47.
    ClinicallyDefiniteMS Placebo (n=176) Betaferon (n=292) 45% 28% Progression toCDMS over 2 years Primary endpoint -time to CDMS (Poser) p=0.000075
  • 48.
    The Evolution ofMS Clinical Threshold MRI ActivityMRI Activity Number of LesionsNumber of Lesions Total lesion loadTotal lesion load CIS RRMS SPMSPre-clinical McDonald MS Poser CDMS First clinical event
  • 49.
    Prognostic Significance ofMRI in CIS: Rate of Conversion to CDMS Number of lesions at baseline The data presented for years 5, 10, and 14 were obtained from different publications based on the same longitudinal study. Morrissey et al. Brain. 1993;116:135; O’Riordan et al. Brain. 1998;121:495; Brex et al. N Engl J Med. 2002;346:158. 0 20 40 60 80 100 5 10 14 Years Patientsconverting toCDMS(%) 0 lesions 1-3 lesions 4-10 lesions >10 lesions
  • 50.
    0 20 40 60 10 14 Years Patientsconvertingto EDSS≥5.5(%) 0 Lesions 1-3Lesions 4-10 Lesions >10 Lesions Prognostic significance of MRI: rate of progression to EDSS ≥5.5 the number of lesions at presentation associated with risk of progression to EDSS ≥5.5* * Data at 14 years represents progression to EDSS ≥6.0. The data presented for years 10 and 14 were obtained from different publications based on the same longitudinal study. O’Riordan et al. Brain. 1998;121:495; Brex et al. N Engl J Med. 2002;346:158. Number of lesions at baseline
  • 51.
    27 21 1815 30 26 26 28 25 33 20 17 14 13 11 0 20 40 60 T2LV 0 5 10 14 20 year CIS RRMS SPMS Bars show IQR; Numbers of patients shown Fig1: Median T2 lesion volume (T2LV) (cm3 ) over time for patient groups 20-year follow-up Results: Serial median T2 LL (cm3) European Charcot Foundation Satellite Symposium, ECTRIMS, Prague 11/10/2007Fisniku LK et al. Unpublished Estimated rate of lesion growth in SPMS 2.89 cm3 /year Estimated rate of lesion growth in RRMS 0.80 cm3 /year (p<0.001)
  • 52.
    Baseline brain andspinal MRI predictors of SPMS 15 years after CIS Odds ratio 95% CI p Baseline GdE lesions 1 2+ Baseline spinal cord lesions 1.33 3.16 4.71 0.35, 5.07 1.08, 9.23 1.72, 12.92 0.68 0.04 <0.01 Estimated risk of SPMS at 15 years No gad lesions and no spinal cord lesions = 5.3% Two gad lesions and at least one spinal cord lesion = 45.5% Brownlee et al. ECTRIMS 2017
  • 53.
    53 Defining the clinical courseof multiple sclerosis The 2013 revisions Lublin at al Advisory Committee on Clinical Trials of MS.
  • 54.
    Verifying MRI detectedpathology:Verifying MRI detected pathology: Co-registration IICo-registration II Schmierer-lab, Blizard InstituteSchmierer-lab, Blizard Institute
  • 55.
    9 * * * ** * * * ** b * ? * 10mm Schmierer-lab, BlizardInstituteSchmierer-lab, Blizard Institute
  • 56.
    Marburg O. Jahrbücherfür Psychiatrie und Neurologie 27, 1906.Marburg O. Jahrbücher für Psychiatrie und Neurologie 27, 1906. ““In terms of location lesions seem distributed atIn terms of location lesions seem distributed at random. In the spinal cord there is perhaps a slightrandom. In the spinal cord there is perhaps a slight preference for the white mater… Distribution ofpreference for the white mater… Distribution of lesions in the cerebrum is non-systematic…lesions in the cerebrum is non-systematic… In theIn the cortex lesions preferentially affect inner, rather thancortex lesions preferentially affect inner, rather than superficial layers.”superficial layers.” ““In terms of location lesions seem distributed atIn terms of location lesions seem distributed at random. In the spinal cord there is perhaps a slightrandom. In the spinal cord there is perhaps a slight preference for the white mater… Distribution ofpreference for the white mater… Distribution of lesions in the cerebrum is non-systematic…lesions in the cerebrum is non-systematic… In theIn the cortex lesions preferentially affect inner, rather thancortex lesions preferentially affect inner, rather than superficial layers.”superficial layers.”
  • 58.
    Sethi, et al.Sethi,et al. JNNP 2012JNNP 2012 DIRDIR FLAIRFLAIR PSIRPSIR PSIR= Phase sensitive reconstructed IR (range of TPSIR= Phase sensitive reconstructed IR (range of T11w factor -1 to 1 instead of 0 to 1 in Tw factor -1 to 1 instead of 0 to 1 in T11SE)SE)
  • 59.
    Cortical grey matterpathologyCortical grey matter pathology • DemyelinationDemyelination • RemyelinationRemyelination • BBB disruptionBBB disruption • (Meningeal) inflammation / macrophages(Meningeal) inflammation / macrophages • Neuronal lossNeuronal loss • GliosisGliosis • AtrophyAtrophy • Iron depositsIron deposits • ……
  • 60.
    Causes of MRI‘white matter’ lesionsCauses of MRI ‘white matter’ lesions Multiple sclerosisMultiple sclerosis Ageing (30% of subjects aged > 50 years)Ageing (30% of subjects aged > 50 years) Cerebro-vascular diseaseCerebro-vascular disease LeucodystrophiesLeucodystrophies HTLV-1 a/myelopathyHTLV-1 a/myelopathy NeurosarcoidosisNeurosarcoidosis HydrocephalusHydrocephalus Neuromyelitis opticaNeuromyelitis optica IrradiationIrradiation Acute disseminated encephalomyelitisAcute disseminated encephalomyelitis LymphomaLymphoma Systemic lupus erythematosusSystemic lupus erythematosus ToxinsToxins Behcet’s diseaseBehcet’s disease PhenylketonuriaPhenylketonuria PMLPML HIVHIV Decompression sicknessDecompression sickness SSPESSPE CADASILCADASIL CNS vasculitisCNS vasculitis and more…and more…
  • 61.
    MS under themicroscopeMS under the microscope The veins in MS LesionsThe veins in MS Lesions Schmierer, et al. Ann Neurol 2004Schmierer, et al. Ann Neurol 2004 The blood inThe blood in
  • 62.
    TT22** FLAIRFLAIR FLAIRFLAIR** Sati, etal. Radiology 2012Sati, et al. Radiology 2012
  • 63.
    TheThe “vein in lesion”“veinin lesion” o n= 25 pwRMS, 10 pwSVDn= 25 pwRMS, 10 pwSVD o MRI @ 3T:MRI @ 3T: o 3D FLAIR (post Gd injection),3D FLAIR (post Gd injection), 3D T3D T22 and Tand T22** Tom CampionTom CampionMarc MiquelMarc Miquel Campion, et al.Campion, et al. under revisionunder revision
  • 64.
    Mistry et al.JAMA Neurol. 2013;70:623-8.Mistry et al. JAMA Neurol. 2013;70:623-8.
  • 65.
    • 338 lesions(13.5 ± 7)338 lesions (13.5 ± 7) • Proportion of CVSProportion of CVS++ lesions: 88%lesions: 88% • All patients met MSAll patients met MS criterion (≥45% CVScriterion (≥45% CVS++ )) • 3/25 fulfilled McDonald3/25 fulfilled McDonald criteriacriteria using a singleusing a single MRI head scan.MRI head scan. Results – FLAIR* in MS & SVDResults – FLAIR* in MS & SVD Campion, et al.Campion, et al. under revisionunder revision
  • 66.
    Schmierer, etSchmierer, et al.Brain 2010al. Brain 2010 N= 28 lesionsN= 28 lesions N= 10N= 10 type 1type 1 N= 16N= 16 type 3type 3 N= 2N= 2 type 4type 4 Type I & III cortical grey matter lesionsType I & III cortical grey matter lesions
  • 68.
    AverageAverage 0.5-1% lossof volume0.5-1% loss of volume tissue in one year using SIENAtissue in one year using SIENA Brain atrophy in MSBrain atrophy in MS • Global measure of neurodegenerationGlobal measure of neurodegeneration • Predicts future disability in RRMS (8 yrs)Predicts future disability in RRMS (8 yrs) Fisher, et al Neurology 2002Fisher, et al Neurology 2002 Filippi et al Lancet 2004; Miller et al Neurology 2007, Kappos et alFilippi et al Lancet 2004; Miller et al Neurology 2007, Kappos et al NEJM 2010; Barkhof et al Neurology 2010; Comi et al NEJM 2012NEJM 2010; Barkhof et al Neurology 2010; Comi et al NEJM 2012
  • 69.
    Brain atrophy: acrossall stagesBrain atrophy: across all stages n= 963 pwMSn= 963 pwMS De Stefano, et al. Neurology 2010De Stefano, et al. Neurology 2010
  • 70.
    Assumptions & hypothesisAssumptions& hypothesis 1.1. Spinal cord atrophy predicts disabilitySpinal cord atrophy predicts disability 2.2. Disability is due to axonal lossDisability is due to axonal loss 3.3. Hence, axonal loss must be the keyHence, axonal loss must be the key substrate of spinal cord atrophy!substrate of spinal cord atrophy!
  • 71.
    Revisiting spinal cordaxonal lossRevisiting spinal cord axonal loss D CarassitiD Carassiti F ScaravilliF Scaravilli N PetrovaN Petrova Petrova, et al.Petrova, et al. under revisionunder revision
  • 72.
    Spinal cordsSpinal cordsn=13 pwMS and n=5 HCn=13 pwMS and n=5 HC Age (years)Age (years) MS: 65 ± 11 HC: 82 ± 7MS: 65 ± 11 HC: 82 ± 7 MS durationMS duration 29 ± 11 years29 ± 11 years -Sequential sections of tissue blocks obtained at everySequential sections of tissue blocks obtained at every available nerve root levelavailable nerve root level -Immuno-stained for myelin basic protein andImmuno-stained for myelin basic protein and phosphorylated neurofilaments.phosphorylated neurofilaments. Material & methodsMaterial & methods Petrova, et al.Petrova, et al. under revisionunder revision
  • 73.
    ResultsResults - 20%- 20% Petrova,et al.Petrova, et al. under revisionunder revision
  • 74.
    JNNP 2014JNNP 2014 AnnNeurol 2014;76:568-80Ann Neurol 2014;76:568-80 n= 113 pwMSn= 113 pwMS n= 20 HCn= 20 HC 3T MRI (PSIR) @ level C2/33T MRI (PSIR) @ level C2/3
  • 75.
    • n= 182cases, 7562 lesionsn= 182 cases, 7562 lesions • Mean disease duration= 29 yearsMean disease duration= 29 years • 57% of lesions mixed in/active (chronic active)57% of lesions mixed in/active (chronic active) • Shorter time to EDSS 6 correlates with:Shorter time to EDSS 6 correlates with: – higher lesion loadhigher lesion load – higher proportion of chronic active lesionshigher proportion of chronic active lesions • PP and SP show comparable lesion activityPP and SP show comparable lesion activity • n= 182 cases, 7562 lesionsn= 182 cases, 7562 lesions • Mean disease duration= 29 yearsMean disease duration= 29 years • 57% of lesions mixed in/active (chronic active)57% of lesions mixed in/active (chronic active) • Shorter time to EDSS 6 correlates with:Shorter time to EDSS 6 correlates with: – higher lesion loadhigher lesion load – higher proportion of chronic active lesionshigher proportion of chronic active lesions • PP and SP show comparable lesion activityPP and SP show comparable lesion activity
  • 76.
    MyelinMyelin AxonsAxons Above lesionAbovelesion Below lesionBelow lesion LesionLesion Petrova, et al. Brain Pathol 2018;28:334-48.Petrova, et al. Brain Pathol 2018;28:334-48. Demyelination has significant effect on axonal lossDemyelination has significant effect on axonal loss
  • 77.
    Petrova, et al.Brain Pathol 2018;28:334-48.Petrova, et al. Brain Pathol 2018;28:334-48. Demyelination has significant effect on axonal lossDemyelination has significant effect on axonal loss
  • 78.
    Axonal lossAxonal loss -60%- 60% Petrova, et al. Brain Pathol 2018;28:334-48.Petrova, et al. Brain Pathol 2018;28:334-48. Only predictor of axonal loss:Only predictor of axonal loss: DDisease Durationisease Duration
  • 79.
    -- 39%39% MSMS NoMSNo MS Carassiti D et al. Neuropathol Appl Nerobiol 2017; doi: 10.1111/nan.12405.doi: 10.1111/nan.12405.
  • 80.
    Grey matter volumeloss and disabilityGrey matter volume loss and disability Fisniku, et al. Ann Neurol 2008Fisniku, et al. Ann Neurol 2008 n= 73 patients with initial diagnosis CIS, followed up for 20 yearsn= 73 patients with initial diagnosis CIS, followed up for 20 years
  • 81.
  • 82.
    Rio et alECTRIMS 2015 Quixotic guidelines 209 patients
  • 83.
    84 Pooled analysis ofthose with ≥1 gadolinium-enhancing lesion Accuracy improves significantly when looking for gadolinium-enhancing lesions rather than new T2 lesions; when compared with image analysis software, concordance correlation was high (0.8–0.96) for gadolinium-enhancing lesions, intermediate (0.6– 0.8) for new T2 lesions, and very poor (0.0– 0.14) for enlarging lesions. Pooled analysis of those with ≥1 new T2 lesion at 1 year
  • 84.
  • 85.
    Principles and Challengesof NEDA 86 In other fields, also known as ‘treat to target’ (TTT) TTT is proactive, has a clear endpoint (the “target”), and can be operationalized as a specific treatment algorithm, simplifying the multitude of complex medication sequences. Long established in diabetes – HbA1C, hyperlipidaemia, hypertension RA – similar issues to MS, less well defined targets – patient symptoms (subjectivity) Pt perception of benefit and risk of escalation of therapies T2 lesions are an objective measure of disease activity Solomon, D. H., A. Bitton, J. N. Katz, H. Radner, E. M. Brown and L. Fraenkel (2014). "Review: treat to target in rheumatoid arthritis: fact, fiction, or hypothesis?" Arthritis Rheumatol 66(4): 775-782.
  • 86.
    NEDANEDA Is it timeto target no evident disease activity (NEDA) in multiple sclerosis? Giovannoni G, Turner B, Gnanapavan S, Offiah C, Schmierer K, Marta M. Mult Scler Relat Disord. 2015 Jul;4(4):329-33. doi: 10.1016/j.msard.2015.04.006. Epub 2015 May 8. Review. 1.Relapses 2.Disability progrression 3.MRI lesional activity • Gd enhancing lesions • T2 lesions
  • 87.
    DB - ?escalation • FS – 2000 right sided paraesthesia • Diagnosed 2002 • 2002 May commenced Copaxone, did not tolerate • 2004 – October Avonex (eventually) • 2005 – relapse, switched to Rebif, ab neg, 1-2 relapses per year • Rebif IFN 2010 • 2013 June - fingolimod
  • 91.
    Choose therapy A BC Define the individual’s MS Treatment failure? • Patient’s preferences? • Your choice? Individual measures: •Evidence of disease activity? •Tolerability/safety? •Adherence? •Drug or inhibitory markers, e.g. NABs? Monitoring Personalisation: •MS prognosis based on clinical and MRI indices •Lifestyle and goals •Shared goals for therapy Rebaseline Rebaselining: •IFNβ, natalizumab, fingolimod, teriflunomide, Dimethyl-Fumarate= 3- 6 months •Glatiramer acetate= 9 months •Induction= (6 and) 24 months Choose a therapeutic strategy Maintenance-escalation Immunosuppression…reconstitution Choose therapy X Z Rebaseline Monitoring Initiate, switch or escalate Rx Complete course / Re-treat Breakthrough disease NoYes Yes • Two licensed ‘reconstitution’ therapies at present IFNβ = interferon-beta; NABs = neutralizing antibodies; Rx = treatment Giovannoni G, et al. Mult Scler Relat Disord 2015;4:329-33.Giovannoni G, et al. Mult Scler Relat Disord 2015;4:329-33. Y Consider changing RxConsider changing Rx BARTS-MS T2T-NEDA ALGORITHM T2T = treating-to-target; NEDA = no evident disease activity
  • 92.
    Relapses Unreported relapses Clinical diseaseprogression Subclinical relapses: focal MRI activity Focal gray and white matter lesions not detected by MRI Brain atrophy Spinal fluid neurofilament levels MS Iceberg Clinical activity Focal MRI activity Hidden focal and diffuse MRI activity Microscopic or biochemical pathology Biomarkers NEDA END-ORGANDAMAGE

Editor's Notes

  • #18 Largest NHS trust in the UK Annual turnover £1.25 billion Workforce 15,000 Catchment 2.5 million East London and beyond ~2,500 pwMS Parkinson Lord Brain
  • #21 The clinical event which raises the question of MS is now described as a Clinically Isolated Syndrome and may very characteristic such as optic neuritis or internuclear ophthalmoplegia or less specific such as sensory disturbance or mild bladder symptoms
  • #26 Largest NHS trust in the UK Annual turnover £1.25 billion Workforce 15,000 Catchment 2.5 million East London and beyond ~2,500 pwMS Parkinson Lord Brain
  • #27 Largest NHS trust in the UK Annual turnover £1.25 billion Workforce 15,000 Catchment 2.5 million East London and beyond ~2,500 pwMS Parkinson Lord Brain
  • #47 CLINICAL EFFICACY 2 YEAR DATA 85% OF PLACEBO PATIENTS WENT ONTO DEVELOP MS , ACCORDING TO THE McDONALD CRITERIA. THE ODDS ARE STACKED AGAINST THIS GROUP OF PATIENTS.
  • #48 ACCORDING TO POSER CRITERIA BETAFERON REDUCED THE RISK OF PROGRESSION TO CDMS BY 50% WITHIN THE 2 YEARS
  • #49 Main feature of the graph is the disease activity that is happening very early on in the disease . The symptoms at this very early stage are often not seen. The axonal damage early on causes long-term disability in the future . Talk about the time we are suggesting that treatment should be initiated compared to the average time in the UK at the moment ie 3.2 relapses . Highlight the amount of disease activity which has taken place in this time . EARLY IS LATE IN MS
  • #59 PSIR based on earlier work by Bernstein, Gowland and others in late 80s and early 90s. Later work by Hou &amp; Nelson. Does not require TI scout acquisition. The advantage of the phase sensitive reconstructed IR is that the range of the T1-weighted factor is from -1 to 1 instead of 0 to 1 in a T1SE sequence. This increased dynamic range provides greater T1 contrast for different tissues.
  • #61 Largest NHS trust in the UK Annual turnover £1.25 billion Workforce 15,000 Catchment 2.5 million East London and beyond ~2,500 pwMS Parkinson Lord Brain
  • #67 28 lesions detected 10 Ijuxtacortical 0 IIsmall lesions within the cortex IIIsub-pial 2 IVaffecting all layers of the CGM
  • #70 Largest NHS trust in the UK Annual turnover £1.25 billion Workforce 15,000 Catchment 2.5 million East London and beyond ~2,500 pwMS Parkinson Lord Brain
  • #78 Cords dissected such that 5 nerve root levels above and below showed no lesion pathology in the CST investigated.
  • #79 Cords dissected such that 5 nerve root levels above and below showed no lesion pathology in the CST investigated.
  • #80 No correlation between total demyelination and axonal loss (similar to De Luca, Brain 2006).
  • #81 These changes correspond to changes in brain volume… We are all quite familiar with pictures like this indicating the relentless loss of brain tissue in pwMS.