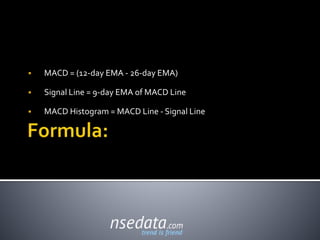
 Technical analysis indicator
 MACD was developed by Gerald Appel in the late seventies, MACD
indicator is one of the simplest and most effective momentum indicators
available.
 MACD is a trend-following momentum indicator that shows the
relationship between two moving averages of prices.
 The MACD is calculated by subtracting the 26-day exponential moving
average (EMA) from the 12-day EMA. A nine-day EMA of the MACD, called
the "signal line", is then plotted on top of the MACD, functioning as a
trigger for buy and sell signals.
 MACD = (12-day EMA - 26-day EMA)
 Signal Line = 9-day EMA of MACD Line
 MACD Histogram = MACD Line - Signal Line
 MACD can be used to find buying and selling opportunities during live
market sessions.
 Please visit www.nsedata.com for more details.

Moving average convergence and divergence - Technical analysis indicator

  • 1.
  • 2.
     MACD wasdeveloped by Gerald Appel in the late seventies, MACD indicator is one of the simplest and most effective momentum indicators available.  MACD is a trend-following momentum indicator that shows the relationship between two moving averages of prices.  The MACD is calculated by subtracting the 26-day exponential moving average (EMA) from the 12-day EMA. A nine-day EMA of the MACD, called the "signal line", is then plotted on top of the MACD, functioning as a trigger for buy and sell signals.
  • 3.
     MACD =(12-day EMA - 26-day EMA)  Signal Line = 9-day EMA of MACD Line  MACD Histogram = MACD Line - Signal Line
  • 4.
     MACD canbe used to find buying and selling opportunities during live market sessions.
  • 6.
     Please visitwww.nsedata.com for more details.