How to use MACD in your Trading whether it’s Stocks, Options, Forex, Futures or CFD’s. If you don't quite know the best way to use MACD, then you need to visit A Traders Universe
Forex Trend Line EA designed as a automated trend line trader. It is an add-on expert advisor on Metatrader 4 trading platform. Trade most FX chart patterns
Generating buy and sell signals with optimum chartLeadingTrader21
Optimum Chart is the Standalone Charting and Signal Platform. Optimum Chart is geared up best for your Price Action and Pattern Trading solution. You can generate buy and sell signals using the built in pattern scanner for both Forex and Stock markets. Here are the simple steps.
Quick guideline for harmonic pattern plus for starterLeadingTrader21
Harmonic Pattern Plus detects the reversal (turning point) patterns in your chart automatically. The software will recommend you to the potential entry and exit for your trading at turning point. With some discretionary thinking together, using Harmonic Pattern Plus is the profitable and convenient way for your trading. With a lot of automation, you have very little work to do for your trading. Harmonic Pattern Plus was evolved for many years to meet the needs for the professional traders. As a result, Harmonic Pattern Plus contains many different features and functionalities in one software. Because of this comprehensive feature, starters can get little frustrated at the beginning. However, it is important to remember that everyone evolve to different stage and different mind-set in his or her trading career. It is better not assume anything too quick. As your skills improve with your trading, you will be glad that Harmonic Pattern Plus offers those features and functionalities for your trading. Obviously, there are clear reasons that those feature and functionality are there. You may not see the benefit now but you can see the benefits in the future. Just avoid making too quick assumption or judgement on the software just after few days of using them. It is important to remember that you do not have to use all of features and functionalities at the same time. You will likely to use some features and functionalities depending on your experience and preferences. Please switch off rest of feature and functionality and only leave the features best suit for your needs. In this article, we provide brief description of features in Harmonic Pattern Plus.
Best Moving Average for Swing Trading.pdfNazim Khan
https://pivotstocks.com/
You can use a variety of technical indicators as a swing trader to find chances and carry out deals. In this post, we will discuss some of the most commonly used Best Moving Average for Swing Trading. Moving averages, however, are among the most widely utilized indicators. There are several moving averages you can trust, including the SMA (simple moving average), EMA (exponential moving average), and MACD (moving average convergence divergence). Among many others, there is the 5-day moving average, the 20-day moving average, and even the 50-day moving average.
Remember that every one of these moving averages has a role in your toolbox. Some, nonetheless, are more perceptive than others. Furthermore, we will discuss why we believe the 20-day simple or exponential moving average is the best option if you could only use one for swing trading. Let’s start by defining moving averages, discussing their significance, and outlining how to use them in your trading strategy.
Simply put, a moving average is a computation that shows the average price of securities over a given period of time on a chart. When examining a 5-day moving average (MA), for instance, you are effectively averaging the closing prices over the previous 5 days and 50-days moving average (MA), for instance, you are effectively averaging the closing prices over the previous 50 days. This provides you with a decent indication of a stock’s general trajectory.
Simple moving averages, weighted moving averages, and exponential moving averages can all be used in short-term trading; however, for intraday trading, the best one must be selected. You can use the moving average on hourly, minute, or daily charts while day trading on candlestick charts to determine whether to buy, sell, or quit on a stock. Though intraday trading is dangerous, moving averages can be effectively utilized if you combine a number of tools and technical indicators.
Moving averages come in various varieties. The SMA (simple moving average), EMA (exponential moving average), and MACD (moving average convergence divergence) are the most commonly utilized ones in trading. Still, there are a good number of others that are also remarkable. Below, we’ll dissect each one in a short
Compared to a standard moving average, an exponential moving average (EMA) gives greater weight to recent price activity. A multiplier is a component of the EMA calculation that basically establishes the weight assigned to the most recent price. The most recent price is given more weight and is hence more responsive to recent price fluctuations when the multiplier is larger.
The simplest kind of moving average is the SMA. As we mentioned in passing, it basically averages the closing prices over the last X number of days. When you look at a 50-day SMA, for instance, you are averaging the closing prices over the previous 50 days.
If you take an EMA and lower its multiplier, you get a smooth moving average. As a result, it react
Divergences are one of my favorite trading concepts because, when paired with other trading tools and concepts, they provide very reliable, high-quality trading signals.
Although indicators, like price action, are somewhat lagging, when it comes to divergences, this lagging feature will actually help us locate better and more dependable trade entries, as we will see below. Divergences in Trading can be used by reversal traders and trend-following traders to time their exits.
Divergences in Trading are a significant part of one of my setups, and they work well with other indications in my trading system. I don’t advise trading divergences independently, but they are good to start.
Led by Tony Peterson and his team, The Intentional Trader exploits one of the most consistent edges against the futures markets available to retail day traders.
Our day trading programs promote hard work and teaches new and struggling traders how to approach trading like its their own business. The first and most important step is to prove to yourself that you have what it takes to be a consistent trader. And we have just the tools to help you do that.
NinjaTrader is a popular trading platform that offers a variety of indicators to help traders make informed decisions. These indicators can be customized to fit each trader's individual needs and preferences.
Some of the most commonly used NinjaTrader indicators include moving averages, Bollinger Bands, MACD, and RSI. Moving averages help traders identify trends, while Bollinger Bands can help identify potential entry and exit points. MACD is a momentum indicator that can help traders identify changes in trend, and RSI can help traders identify overbought and oversold conditions.
In addition to these indicators, NinjaTrader also offers a variety of other tools and features to help traders analyze the markets and make informed decisions. These include charting tools, backtesting capabilities, and the ability to automate trading strategies.
Overall, NinjaTrader is a powerful platform that can help traders of all levels improve their trading performance. Whether you are a beginner or an experienced trader, there are plenty of tools and resources available to help you succeed.
NinjaTrader Indicators: A Powerful Tool for Traders
In today's fast-paced market, traders need every advantage they can get to stay ahead of the curve. That's where NinjaTrader Indicators come in. These powerful tools provide real-time data and analysis on price movements, volume, and other key metrics that can be used to make informed trading decisions.
NinjaTrader's extensive library of indicators allows traders to customize their charts to display the information that is most relevant to their trading strategy. Whether you are a beginner or an experienced trader, NinjaTrader's indicators can help you identify trends, find entry and exit points, and manage risk more effectively.
Moving Averages are one of the most popular NinjaTrader indicators. They provide a simple way to identify trends by smoothing out price movements over a specified period of time. Traders can use Moving Averages to determine whether a market is trending up or down and to identify potential entry and exit points.
Bollinger Bands are another popular indicator. They consist of a moving average and two standard deviations plotted on either side of the average. Bollinger Bands can be used to identify overbought and oversold conditions, as well as potential trend reversals.
Top 5 Indicators for Intraday Trading and How to Use ThemStock Venture
Intraday traders realize how crucial trustworthy indications are. Which one should you choose? It's a complex question with no easy answer. Some traders swear by oscillators like the Relative Strength Index (RSI), while others prefer Bollinger Bands or Moving Average Convergence Divergence (MACD). We'll break down each indicator in this tutorial to help you choose the right one for your trading style and goals. Learn how to trade intraday!
Intraday or day trading can be challenging for newcomers. To get an advantage over others, traders must keep an eye on various key aspects. Chart patterns, technical indicators, open interest, market news, and so on are examples of these variables. The most significant indicators for intraday trading will be discussed in this post. These indications will aid you in maintaining a high success rate and a favorable risk-reward ratio.
The best swing trading strategies are the ones that allow you to trade and profit from your beliefs about the market. I have added some of the most popular swing trading indicators as a guide for you to explore. The swing trading indicators listed here focus on trend trading, volatility, and overbought/oversold conditions.
10 Best Technical Indicators List Trend Indicators.pdfNazim Khan
Trading in the financial markets requires a deep understanding of various tools and techniques that can help traders make informed decisions. One such set of tools is technical indicators, which are widely used to analyze price movements, identify trends, and generate trading signals. In this article, we will explore some of the most trending technical indicators used by traders worldwide. So, let’s dive in and uncover the power of these indicators in shaping successful trading strategies.
Introduction to Technical Indicators
Technical indicators are mathematical calculations applied to historical price and volume data to gain insights into market trends and price patterns. These indicators help traders identify potential buy or sell signals and assist in making informed trading decisions. Traders often combine multiple indicators to validate their analysis and increase the probability of successful trades.
1. Moving Averages
Simple Moving Average (SMA)
A simple moving average (SMA) is a commonly used technical indicator that calculates the average price of a security over a specified period. It smoothes out price fluctuations and helps identify trends. Traders use SMAs to determine support and resistance levels and generate trading signals when the price crosses above or below the moving average.
Exponential Moving Average (EMA)
The exponential moving average (EMA) is another widely used moving average indicator. It gives more weight to recent prices, making it more responsive to recent market changes compared to the SMA. Traders use EMAs to identify short-term trends and potential entry or exit points.
2. Relative Strength Index (RSI)
The Relative Strength Index (RSI) is a momentum oscillator that measures the speed and change of price movements. RSI values range from 0 to 100 and indicate overbought or oversold conditions in the market. Traders use the RSI to identify potential trend reversals and generate buy or sell signals.
3. Bollinger Bands
Bollinger Bands consist of a moving average (usually the SMA) and two standard deviation lines. These bands expand and contract based on market volatility. Traders use Bollinger Bands to identify periods of low volatility (squeezes) and anticipate potential breakout moves. When the price touches the upper band, it may be a signal to sell, while touching the lower band may indicate a buying opportunity.
4. MACD (Moving Average Convergence Divergence)
The Moving Average Convergence Divergence (MACD) is a trend-following momentum indicator. It consists of two lines: the MACD line and the signal line. Traders use the MACD to identify potential trend reversals, generate buy or sell signals, and confirm the strength of a trend.
5. Stochastic Oscillator
The Stochastic Oscillator is a momentum indicator that compares the closing price of a security to its price range over a specific period. It consists of two lines: %K and %D. Traders use the Stochastic Oscillator to identify overbought or oversold conditions
Auto Trendline Trader is a Forex Automatic Trading Robot which works in Metatrader 4 Platform. Also a Trend line EA that works well for trendline trading.
how to sell pi coins in all Africa Countries.DOT TECH
Yes. You can sell your pi network for other cryptocurrencies like Bitcoin, usdt , Ethereum and other currencies And this is done easily with the help from a pi merchant.
What is a pi merchant ?
Since pi is not launched yet in any exchange. The only way you can sell right now is through merchants.
A verified Pi merchant is someone who buys pi network coins from miners and resell them to investors looking forward to hold massive quantities of pi coins before mainnet launch in 2026.
I will leave the telegram contact of my personal pi merchant to trade with.
@Pi_vendor_247
Turin Startup Ecosystem 2024 - Ricerca sulle Startup e il Sistema dell'Innov...Quotidiano Piemontese
Turin Startup Ecosystem 2024
Una ricerca de il Club degli Investitori, in collaborazione con ToTeM Torino Tech Map e con il supporto della ESCP Business School e di Growth Capital
how to swap pi coins to foreign currency withdrawable.DOT TECH
As of my last update, Pi is still in the testing phase and is not tradable on any exchanges.
However, Pi Network has announced plans to launch its Testnet and Mainnet in the future, which may include listing Pi on exchanges.
The current method for selling pi coins involves exchanging them with a pi vendor who purchases pi coins for investment reasons.
If you want to sell your pi coins, reach out to a pi vendor and sell them to anyone looking to sell pi coins from any country around the globe.
Below is the contact information for my personal pi vendor.
Telegram: @Pi_vendor_247
NO1 Uk Divorce problem uk all amil baba in karachi,lahore,pakistan talaq ka m...Amil Baba Dawood bangali
Contact with Dawood Bhai Just call on +92322-6382012 and we'll help you. We'll solve all your problems within 12 to 24 hours and with 101% guarantee and with astrology systematic. If you want to take any personal or professional advice then also you can call us on +92322-6382012 , ONLINE LOVE PROBLEM & Other all types of Daily Life Problem's.Then CALL or WHATSAPP us on +92322-6382012 and Get all these problems solutions here by Amil Baba DAWOOD BANGALI
#vashikaranspecialist #astrologer #palmistry #amliyaat #taweez #manpasandshadi #horoscope #spiritual #lovelife #lovespell #marriagespell#aamilbabainpakistan #amilbabainkarachi #powerfullblackmagicspell #kalajadumantarspecialist #realamilbaba #AmilbabainPakistan #astrologerincanada #astrologerindubai #lovespellsmaster #kalajaduspecialist #lovespellsthatwork #aamilbabainlahore#blackmagicformarriage #aamilbaba #kalajadu #kalailam #taweez #wazifaexpert #jadumantar #vashikaranspecialist #astrologer #palmistry #amliyaat #taweez #manpasandshadi #horoscope #spiritual #lovelife #lovespell #marriagespell#aamilbabainpakistan #amilbabainkarachi #powerfullblackmagicspell #kalajadumantarspecialist #realamilbaba #AmilbabainPakistan #astrologerincanada #astrologerindubai #lovespellsmaster #kalajaduspecialist #lovespellsthatwork #aamilbabainlahore #blackmagicforlove #blackmagicformarriage #aamilbaba #kalajadu #kalailam #taweez #wazifaexpert #jadumantar #vashikaranspecialist #astrologer #palmistry #amliyaat #taweez #manpasandshadi #horoscope #spiritual #lovelife #lovespell #marriagespell#aamilbabainpakistan #amilbabainkarachi #powerfullblackmagicspell #kalajadumantarspecialist #realamilbaba #AmilbabainPakistan #astrologerincanada #astrologerindubai #lovespellsmaster #kalajaduspecialist #lovespellsthatwork #aamilbabainlahore #Amilbabainuk #amilbabainspain #amilbabaindubai #Amilbabainnorway #amilbabainkrachi #amilbabainlahore #amilbabaingujranwalan #amilbabainislamabad
US Economic Outlook - Being Decided - M Capital Group August 2021.pdfpchutichetpong
The U.S. economy is continuing its impressive recovery from the COVID-19 pandemic and not slowing down despite re-occurring bumps. The U.S. savings rate reached its highest ever recorded level at 34% in April 2020 and Americans seem ready to spend. The sectors that had been hurt the most by the pandemic specifically reduced consumer spending, like retail, leisure, hospitality, and travel, are now experiencing massive growth in revenue and job openings.
Could this growth lead to a “Roaring Twenties”? As quickly as the U.S. economy contracted, experiencing a 9.1% drop in economic output relative to the business cycle in Q2 2020, the largest in recorded history, it has rebounded beyond expectations. This surprising growth seems to be fueled by the U.S. government’s aggressive fiscal and monetary policies, and an increase in consumer spending as mobility restrictions are lifted. Unemployment rates between June 2020 and June 2021 decreased by 5.2%, while the demand for labor is increasing, coupled with increasing wages to incentivize Americans to rejoin the labor force. Schools and businesses are expected to fully reopen soon. In parallel, vaccination rates across the country and the world continue to rise, with full vaccination rates of 50% and 14.8% respectively.
However, it is not completely smooth sailing from here. According to M Capital Group, the main risks that threaten the continued growth of the U.S. economy are inflation, unsettled trade relations, and another wave of Covid-19 mutations that could shut down the world again. Have we learned from the past year of COVID-19 and adapted our economy accordingly?
“In order for the U.S. economy to continue growing, whether there is another wave or not, the U.S. needs to focus on diversifying supply chains, supporting business investment, and maintaining consumer spending,” says Grace Feeley, a research analyst at M Capital Group.
While the economic indicators are positive, the risks are coming closer to manifesting and threatening such growth. The new variants spreading throughout the world, Delta, Lambda, and Gamma, are vaccine-resistant and muddy the predictions made about the economy and health of the country. These variants bring back the feeling of uncertainty that has wreaked havoc not only on the stock market but the mindset of people around the world. MCG provides unique insight on how to mitigate these risks to possibly ensure a bright economic future.
The European Unemployment Puzzle: implications from population agingGRAPE
We study the link between the evolving age structure of the working population and unemployment. We build a large new Keynesian OLG model with a realistic age structure, labor market frictions, sticky prices, and aggregate shocks. Once calibrated to the European economy, we quantify the extent to which demographic changes over the last three decades have contributed to the decline of the unemployment rate. Our findings yield important implications for the future evolution of unemployment given the anticipated further aging of the working population in Europe. We also quantify the implications for optimal monetary policy: lowering inflation volatility becomes less costly in terms of GDP and unemployment volatility, which hints that optimal monetary policy may be more hawkish in an aging society. Finally, our results also propose a partial reversal of the European-US unemployment puzzle due to the fact that the share of young workers is expected to remain robust in the US.
what is the best method to sell pi coins in 2024DOT TECH
The best way to sell your pi coins safely is trading with an exchange..but since pi is not launched in any exchange, and second option is through a VERIFIED pi merchant.
Who is a pi merchant?
A pi merchant is someone who buys pi coins from miners and pioneers and resell them to Investors looking forward to hold massive amounts before mainnet launch in 2026.
I will leave the telegram contact of my personal pi merchant to trade pi coins with.
@Pi_vendor_247
NO1 Uk Black Magic Specialist Expert In Sahiwal, Okara, Hafizabad, Mandi Bah...Amil Baba Dawood bangali
Contact with Dawood Bhai Just call on +92322-6382012 and we'll help you. We'll solve all your problems within 12 to 24 hours and with 101% guarantee and with astrology systematic. If you want to take any personal or professional advice then also you can call us on +92322-6382012 , ONLINE LOVE PROBLEM & Other all types of Daily Life Problem's.Then CALL or WHATSAPP us on +92322-6382012 and Get all these problems solutions here by Amil Baba DAWOOD BANGALI
#vashikaranspecialist #astrologer #palmistry #amliyaat #taweez #manpasandshadi #horoscope #spiritual #lovelife #lovespell #marriagespell#aamilbabainpakistan #amilbabainkarachi #powerfullblackmagicspell #kalajadumantarspecialist #realamilbaba #AmilbabainPakistan #astrologerincanada #astrologerindubai #lovespellsmaster #kalajaduspecialist #lovespellsthatwork #aamilbabainlahore#blackmagicformarriage #aamilbaba #kalajadu #kalailam #taweez #wazifaexpert #jadumantar #vashikaranspecialist #astrologer #palmistry #amliyaat #taweez #manpasandshadi #horoscope #spiritual #lovelife #lovespell #marriagespell#aamilbabainpakistan #amilbabainkarachi #powerfullblackmagicspell #kalajadumantarspecialist #realamilbaba #AmilbabainPakistan #astrologerincanada #astrologerindubai #lovespellsmaster #kalajaduspecialist #lovespellsthatwork #aamilbabainlahore #blackmagicforlove #blackmagicformarriage #aamilbaba #kalajadu #kalailam #taweez #wazifaexpert #jadumantar #vashikaranspecialist #astrologer #palmistry #amliyaat #taweez #manpasandshadi #horoscope #spiritual #lovelife #lovespell #marriagespell#aamilbabainpakistan #amilbabainkarachi #powerfullblackmagicspell #kalajadumantarspecialist #realamilbaba #AmilbabainPakistan #astrologerincanada #astrologerindubai #lovespellsmaster #kalajaduspecialist #lovespellsthatwork #aamilbabainlahore #Amilbabainuk #amilbabainspain #amilbabaindubai #Amilbabainnorway #amilbabainkrachi #amilbabainlahore #amilbabaingujranwalan #amilbabainislamabad
how to sell pi coins on Bitmart crypto exchangeDOT TECH
Yes. Pi network coins can be exchanged but not on bitmart exchange. Because pi network is still in the enclosed mainnet. The only way pioneers are able to trade pi coins is by reselling the pi coins to pi verified merchants.
A verified merchant is someone who buys pi network coins and resell it to exchanges looking forward to hold till mainnet launch.
I will leave the telegram contact of my personal pi merchant to trade with.
@Pi_vendor_247
Empowering the Unbanked: The Vital Role of NBFCs in Promoting Financial Inclu...Vighnesh Shashtri
In India, financial inclusion remains a critical challenge, with a significant portion of the population still unbanked. Non-Banking Financial Companies (NBFCs) have emerged as key players in bridging this gap by providing financial services to those often overlooked by traditional banking institutions. This article delves into how NBFCs are fostering financial inclusion and empowering the unbanked.
how to sell pi coins at high rate quickly.DOT TECH
Where can I sell my pi coins at a high rate.
Pi is not launched yet on any exchange. But one can easily sell his or her pi coins to investors who want to hold pi till mainnet launch.
This means crypto whales want to hold pi. And you can get a good rate for selling pi to them. I will leave the telegram contact of my personal pi vendor below.
A vendor is someone who buys from a miner and resell it to a holder or crypto whale.
Here is the telegram contact of my vendor:
@Pi_vendor_247
The secret way to sell pi coins effortlessly.DOT TECH
Well as we all know pi isn't launched yet. But you can still sell your pi coins effortlessly because some whales in China are interested in holding massive pi coins. And they are willing to pay good money for it. If you are interested in selling I will leave a contact for you. Just telegram this number below. I sold about 3000 pi coins to him and he paid me immediately.
Telegram: @Pi_vendor_247
Latino Buying Power - May 2024 Presentation for Latino CaucusDanay Escanaverino
Unlock the potential of Latino Buying Power with this in-depth SlideShare presentation. Explore how the Latino consumer market is transforming the American economy, driven by their significant buying power, entrepreneurial contributions, and growing influence across various sectors.
**Key Sections Covered:**
1. **Economic Impact:** Understand the profound economic impact of Latino consumers on the U.S. economy. Discover how their increasing purchasing power is fueling growth in key industries and contributing to national economic prosperity.
2. **Buying Power:** Dive into detailed analyses of Latino buying power, including its growth trends, key drivers, and projections for the future. Learn how this influential group’s spending habits are shaping market dynamics and creating opportunities for businesses.
3. **Entrepreneurial Contributions:** Explore the entrepreneurial spirit within the Latino community. Examine how Latino-owned businesses are thriving and contributing to job creation, innovation, and economic diversification.
4. **Workforce Statistics:** Gain insights into the role of Latino workers in the American labor market. Review statistics on employment rates, occupational distribution, and the economic contributions of Latino professionals across various industries.
5. **Media Consumption:** Understand the media consumption habits of Latino audiences. Discover their preferences for digital platforms, television, radio, and social media. Learn how these consumption patterns are influencing advertising strategies and media content.
6. **Education:** Examine the educational achievements and challenges within the Latino community. Review statistics on enrollment, graduation rates, and fields of study. Understand the implications of education on economic mobility and workforce readiness.
7. **Home Ownership:** Explore trends in Latino home ownership. Understand the factors driving home buying decisions, the challenges faced by Latino homeowners, and the impact of home ownership on community stability and economic growth.
This SlideShare provides valuable insights for marketers, business owners, policymakers, and anyone interested in the economic influence of the Latino community. By understanding the various facets of Latino buying power, you can effectively engage with this dynamic and growing market segment.
Equip yourself with the knowledge to leverage Latino buying power, tap into their entrepreneurial spirit, and connect with their unique cultural and consumer preferences. Drive your business success by embracing the economic potential of Latino consumers.
**Keywords:** Latino buying power, economic impact, entrepreneurial contributions, workforce statistics, media consumption, education, home ownership, Latino market, Hispanic buying power, Latino purchasing power.
Even tho Pi network is not listed on any exchange yet.
Buying/Selling or investing in pi network coins is highly possible through the help of vendors. You can buy from vendors[ buy directly from the pi network miners and resell it]. I will leave the telegram contact of my personal vendor.
@Pi_vendor_247
Resume
• Real GDP growth slowed down due to problems with access to electricity caused by the destruction of manoeuvrable electricity generation by Russian drones and missiles.
• Exports and imports continued growing due to better logistics through the Ukrainian sea corridor and road. Polish farmers and drivers stopped blocking borders at the end of April.
• In April, both the Tax and Customs Services over-executed the revenue plan. Moreover, the NBU transferred twice the planned profit to the budget.
• The European side approved the Ukraine Plan, which the government adopted to determine indicators for the Ukraine Facility. That approval will allow Ukraine to receive a EUR 1.9 bn loan from the EU in May. At the same time, the EU provided Ukraine with a EUR 1.5 bn loan in April, as the government fulfilled five indicators under the Ukraine Plan.
• The USA has finally approved an aid package for Ukraine, which includes USD 7.8 bn of budget support; however, the conditions and timing of the assistance are still unknown.
• As in March, annual consumer inflation amounted to 3.2% yoy in April.
• At the April monetary policy meeting, the NBU again reduced the key policy rate from 14.5% to 13.5% per annum.
• Over the past four weeks, the hryvnia exchange rate has stabilized in the UAH 39-40 per USD range.
what is the future of Pi Network currency.DOT TECH
The future of the Pi cryptocurrency is uncertain, and its success will depend on several factors. Pi is a relatively new cryptocurrency that aims to be user-friendly and accessible to a wide audience. Here are a few key considerations for its future:
Message: @Pi_vendor_247 on telegram if u want to sell PI COINS.
1. Mainnet Launch: As of my last knowledge update in January 2022, Pi was still in the testnet phase. Its success will depend on a successful transition to a mainnet, where actual transactions can take place.
2. User Adoption: Pi's success will be closely tied to user adoption. The more users who join the network and actively participate, the stronger the ecosystem can become.
3. Utility and Use Cases: For a cryptocurrency to thrive, it must offer utility and practical use cases. The Pi team has talked about various applications, including peer-to-peer transactions, smart contracts, and more. The development and implementation of these features will be essential.
4. Regulatory Environment: The regulatory environment for cryptocurrencies is evolving globally. How Pi navigates and complies with regulations in various jurisdictions will significantly impact its future.
5. Technology Development: The Pi network must continue to develop and improve its technology, security, and scalability to compete with established cryptocurrencies.
6. Community Engagement: The Pi community plays a critical role in its future. Engaged users can help build trust and grow the network.
7. Monetization and Sustainability: The Pi team's monetization strategy, such as fees, partnerships, or other revenue sources, will affect its long-term sustainability.
It's essential to approach Pi or any new cryptocurrency with caution and conduct due diligence. Cryptocurrency investments involve risks, and potential rewards can be uncertain. The success and future of Pi will depend on the collective efforts of its team, community, and the broader cryptocurrency market dynamics. It's advisable to stay updated on Pi's development and follow any updates from the official Pi Network website or announcements from the team.
1. MACD Technical | Divergence MACD
How to use MACD in your Trading whether it’s Stocks, Options, Forex, Futures or CFD’s.
If you don't quite know the best way to use MACD, then you need to visit A Traders
Universe
http://www.atradersuniverse.com/macd.html
MACD Technical | Divergence MACD
>>> Get This MACD Technical Information Free... Sign up to our free members
area and learn how you can use MACD in your trading and much more. By
signing up to our free members area not only will you receive our bonus video
The Dynamic Ways to use MACD you'll also receive:
5 Trading Systems including the '4T's EOD Trading System' and 2 'Intraday 4T's
Trading Systems' on instant video....plus+
7 Step Course - Building a Profitable Trading System'....plus+
'Roadmap to Trading Success' series...and lot's more
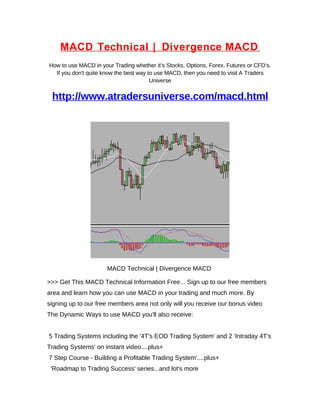
2. http://www.atradersuniverse.com/macd.html
MACD technical is a powerful tool that can sometimes be hard to understand
and use effectively. What if there was a way you could use the various
components of MACD technical to your advantage, rather than using just the one
method, that can see you whipsawed in and out of trades with monotonous
regularity. The more powerful uses of MACD are often overlooked by
inexperienced traders, but it's these other uses of MACD that can add a very
dynamic and powerful tool to your tool box.
Experienced traders will always use MACD in it's dynamic form, and will also use
it in conjunction with other tools such as trend lines, support and resistance,
volume and so on.
MACD stands for Moving Average Convergence Divergence and was developed
by Gerald Appel. MACD uses moving averages (default being 26 and 12) which
are lagging indicators, but these lagging indicators are turned into a momentum
oscillating indicator by subtracting the longer moving average from the the
shorter moving average.
The result is the blue line in the top chart below. The red line is the the 9 day,
exponential moving average of the blue line. (In the top window, the black line is
the 26 day MA and the white line is the 12 day MA) The red and green graphs
are actually what is called the histogram, and is a visual representation of the
distance between the blue and red lines. This can also be used quite effectively.
The theory being that when the blue line crosses the red line to the up side, it is
bullish. When the blue line crosses the red line to the downside it is bearish. But
there is a big problem with this theory on it's own as you can see from the bottom
chart. It is very common to find crossovers happening quite regularly in a
3. sideways market, and the buy and sell signals will see you whipsawed in and out
of the market with losses.
Unfortunately, this negative side of MACD will often scare traders off from using
MACD in a way that gets better results. The other dynamics to MACD are called
divergence, and utilizing the zero line in conjunction with support and resistance.
Divergence MACD is split into two parts, positive divergence and negative
divergence, and it is basically a visual representation of a weakening in price
coupled with increasing strength in MACD, or a weakening in MACD coupled
with increasing prices. There are two ways of spotting divergence and that is with
the MACD line itself and/or the histogram.
The other dynamic is to use the zero line, or what it sometimes called the
waterline, as a way of confirming a bullish or bearish move with some form of
support and resistance in price, and usually this follows a divergence signal.
If you’re interested in getting more free content and information, just access the
Macd Technical & Divergence Macd page.
Cheers,
A Traders Universe