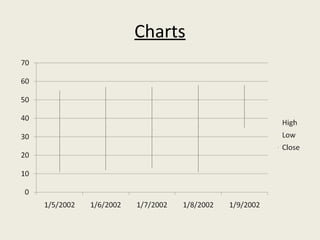
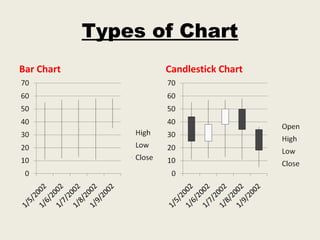
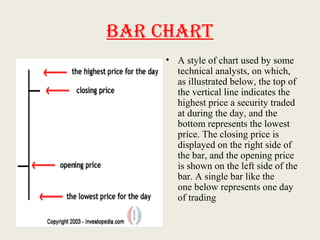
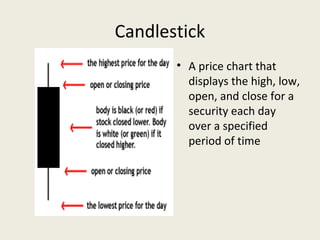
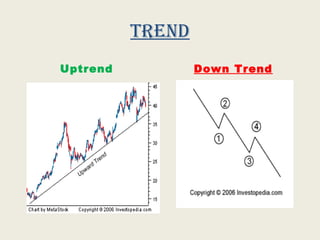
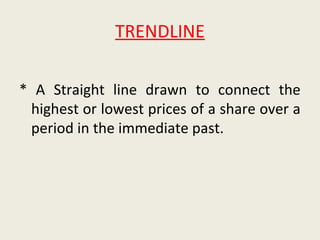
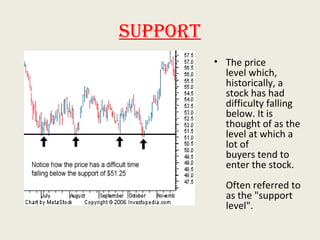
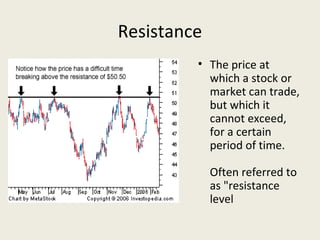
SlideShare a Scribd company logo
Invest Systemically & Earn Smartly
Sanjay Lad
IntroductIon
• A simple course design for common Trader.
• This course is related to moving averages and
oscillators.
• This TECHNICAL ANALYSIS COURSE will make a vast
difference in your approach & attitude towards
STOCK MARKET.
• The course is designed in such a way that TECHNICAL
ANALYSIS subject becomes very easy to understand
even for a new person knowing nothing about it.
Technical analysis for investor & trader
• Short or medium or long term investor
• Trader
• Day trader
• Trading in Derivatives
Summary of course
• STUDY OF Minimum Indicator.
• How to change the parameter with respect to
individual trading?
• How to make better use of readymade software
available in market?
(i.e. Falcon, Trend, Iris etc)
• How to find Support , Resistance and
Panic in the market by simple methods?
• Different Methods or Strategies of Speculation.
Concepts
Price
Open Price :
Low Price :
High Price :
CLOSE Price :
Charts
Types of Chart
Bar Chart Candlestick Chart
Bar Chart
• A style of chart used by some
technical analysts, on which,
as illustrated below, the top of
the vertical line indicates the
highest price a security traded
at during the day, and the
bottom represents the lowest
price. The closing price is
displayed on the right side of
the bar, and the opening price
is shown on the left side of the
bar. A single bar like the
one below represents one day
of trading
Candlestick
• A price chart that
displays the high, low,
open, and close for a
security each day
over a specified
period of time
Line Chart
• A style of chart that
is created by
connecting a series
of data points
together with
a line. This is the
most basic type of
chart used in
finance and it is
generally created
by connecting a
series of past prices
together with a line
trend
Uptrend Down Trend
TRENDLINE
* A Straight line drawn to connect the
highest or lowest prices of a share over a
period in the immediate past.
Support
• The price
level which,
historically, a
stock has had
difficulty falling
below. It is
thought of as the
level at which a
lot of
buyers tend to
enter the stock.
Often referred to
as the "support
level".
Resistance
• The price at
which a stock or
market can trade,
but which it
cannot exceed,
for a certain
period of time.
Often referred to
as "resistance
level
MatheMaticS
Average
• If ‘x’ and ‘y’ are two
numbers then,
Average = (x + y)
2
Percentage
• Example
Let,
Last close of nifty is 4250
and today close is 4380,
what is its percentage rise?
Moving Average – MA
• An indicator frequently used in technical
analysisshowing theaveragevalueof a
security'spriceover aset period. Moving
averagesaregenerally used to measure
momentum and defineareasof possible
support and resistance.
• Moving averagesareused to emphasize
thedirection of atrend and to smooth out
priceand volumefluctuations, or "noise",
that can confuseinterpretation. Typically,
upward momentum isconfirmed when a
short-term average(e.g.15-day) crosses
abovealonger-term average(e.g. 50-day).
Downward momentum isconfirmed when
ashort-term averagecrossesbelow along-
term average.
Simple Moving Average – SMA
• A simple, or arithmetic,
moving average that is
calculated by adding the
closing price of the security
for a number of time periods
and then dividing this total
by the number of time
periods. Short-term
averages respond quickly to
changes in the price of the
underlying, while long-term
averages are slow to react
Exponential Moving Average – EMA
• A type of moving average that is similar to a
simple moving average, except that more
weight is given to the latest data. Also known
as "exponentially weighted moving average
EMA to be use in charts
EMA 6 Short Term
Average
EMA 30 MID Term
Average
EMA 52 LONG Term
Average
Uses of Moving
Averages
• BUY & SELL SIGNAL
• SUPPORT
• RESISTANCE
• TO TAKE POSITION
• IT INDICATES TREND
Moving Average Convergence Divergence
– MACD
• A trend-following
momentum indicator that
shows the relationship
between two moving
averages of prices. The
MACD is calculated
by subtracting the 26-
day exponential moving
average (EMA) from the 12-
day EMA. A nine-day EMA
of the MACD, called the
"signal line", is then plotted
on top of the MACD,
functioning as a trigger for
buy and sell signals
MACD ( In chart)
MACD (6,30,E,6) IN DAILY, WEEKLY, MONTHLY
AND QUARTERLY CHARTS
MACD
( 25,52,E,6)
IN DAILY CHART
MACD
(5,15,E,5)
QUARTERLY CHART
MACD INTRADAY CHART
Uses of MACD
• BUY AND SELL SIGNAL
• TREND
• POSITIVE DIVERGENCE
• NEGATIVE DIVERGENCE

More Related Content

What's hot

Technical indicators
Technical indicatorsTechnical indicators
Technical indicators
vermaayushi
 

What's hot (20)

Risk fundamental & technical analysi- dow theory- chartss
Risk  fundamental  & technical analysi- dow theory- chartssRisk  fundamental  & technical analysi- dow theory- chartss
Risk fundamental & technical analysi- dow theory- chartss
 
Chapter 17 technical analysis
Chapter 17 technical analysisChapter 17 technical analysis
Chapter 17 technical analysis
 
Technical Analysis
Technical AnalysisTechnical Analysis
Technical Analysis
 
Technical Analysis
Technical AnalysisTechnical Analysis
Technical Analysis
 
Cmt learning objective 4 trend system part i
Cmt learning objective 4   trend system part iCmt learning objective 4   trend system part i
Cmt learning objective 4 trend system part i
 
Technical Analysis
Technical AnalysisTechnical Analysis
Technical Analysis
 
Technical analysis
Technical analysisTechnical analysis
Technical analysis
 
Stock and Share Market Technical Analysis
Stock and Share Market Technical AnalysisStock and Share Market Technical Analysis
Stock and Share Market Technical Analysis
 
Technical indicators
Technical indicatorsTechnical indicators
Technical indicators
 
Security analysis (technical) and portfolio management
Security analysis (technical) and portfolio managementSecurity analysis (technical) and portfolio management
Security analysis (technical) and portfolio management
 
Technical analysis
Technical analysisTechnical analysis
Technical analysis
 
Technical analysis doc
Technical analysis doc Technical analysis doc
Technical analysis doc
 
Fundamental analysis
Fundamental analysis Fundamental analysis
Fundamental analysis
 
Cmt learning objective 2 c concept of directional movement
Cmt learning objective 2 c   concept of directional movementCmt learning objective 2 c   concept of directional movement
Cmt learning objective 2 c concept of directional movement
 
Cmt learning objective 6 momentum and oscillators Part-1
Cmt learning objective 6   momentum and oscillators Part-1Cmt learning objective 6   momentum and oscillators Part-1
Cmt learning objective 6 momentum and oscillators Part-1
 
Technical analysis, market efficiency, and behavioral finance
Technical analysis, market efficiency, and behavioral financeTechnical analysis, market efficiency, and behavioral finance
Technical analysis, market efficiency, and behavioral finance
 
SAPM - Technical analysis
SAPM - Technical analysisSAPM - Technical analysis
SAPM - Technical analysis
 
Basic Technical Analysis
Basic Technical AnalysisBasic Technical Analysis
Basic Technical Analysis
 
Cmt learning objective 3 time based trend calculation
Cmt learning objective 3   time based trend calculationCmt learning objective 3   time based trend calculation
Cmt learning objective 3 time based trend calculation
 
Trend Reversal Patterns
Trend Reversal PatternsTrend Reversal Patterns
Trend Reversal Patterns
 

Similar to Invest systemically earn smartly03

Techincal analysis chart patterns part 2
Techincal analysis chart patterns part 2Techincal analysis chart patterns part 2
Techincal analysis chart patterns part 2
Indranil Bhattacharjee
 

Similar to Invest systemically earn smartly03 (20)

Techincal analysis chart patterns part 2
Techincal analysis chart patterns part 2Techincal analysis chart patterns part 2
Techincal analysis chart patterns part 2
 
Technical Analysis - Asif Poiserwala
Technical Analysis - Asif PoiserwalaTechnical Analysis - Asif Poiserwala
Technical Analysis - Asif Poiserwala
 
Day 4 2
Day 4 2Day 4 2
Day 4 2
 
Section 2 - Chapter 13 Part IV - Confirmations - Price Confirmations
Section 2 - Chapter 13 Part IV - Confirmations - Price  ConfirmationsSection 2 - Chapter 13 Part IV - Confirmations - Price  Confirmations
Section 2 - Chapter 13 Part IV - Confirmations - Price Confirmations
 
Day 4
Day 4Day 4
Day 4
 
TECHNICAL ANALYSIS
TECHNICAL ANALYSISTECHNICAL ANALYSIS
TECHNICAL ANALYSIS
 
Idiots guide to stocks
Idiots guide to stocksIdiots guide to stocks
Idiots guide to stocks
 
Oscillators- Investment Management..pptx
Oscillators- Investment Management..pptxOscillators- Investment Management..pptx
Oscillators- Investment Management..pptx
 
QNBFS Daily Technical Trader - Qatar for July 12 2018 التحليل الفني اليومي لب...
QNBFS Daily Technical Trader - Qatar for July 12 2018 التحليل الفني اليومي لب...QNBFS Daily Technical Trader - Qatar for July 12 2018 التحليل الفني اليومي لب...
QNBFS Daily Technical Trader - Qatar for July 12 2018 التحليل الفني اليومي لب...
 
QNBFS Daily Technical Trader - Qatar for July 18 2018 التحليل الفني اليومي لب...
QNBFS Daily Technical Trader - Qatar for July 18 2018 التحليل الفني اليومي لب...QNBFS Daily Technical Trader - Qatar for July 18 2018 التحليل الفني اليومي لب...
QNBFS Daily Technical Trader - Qatar for July 18 2018 التحليل الفني اليومي لب...
 
QNBFS Daily Technical Trader - Qatar for May 31 2018 التحليل الفني اليومي لبو...
QNBFS Daily Technical Trader - Qatar for May 31 2018 التحليل الفني اليومي لبو...QNBFS Daily Technical Trader - Qatar for May 31 2018 التحليل الفني اليومي لبو...
QNBFS Daily Technical Trader - Qatar for May 31 2018 التحليل الفني اليومي لبو...
 
QNBFS Daily Technical Trader - Qatar for July 16 2018 التحليل الفني اليومي لب...
QNBFS Daily Technical Trader - Qatar for July 16 2018 التحليل الفني اليومي لب...QNBFS Daily Technical Trader - Qatar for July 16 2018 التحليل الفني اليومي لب...
QNBFS Daily Technical Trader - Qatar for July 16 2018 التحليل الفني اليومي لب...
 
QNBFS Daily Technical Trader - Qatar for July 22 2018 التحليل الفني اليومي لب...
QNBFS Daily Technical Trader - Qatar for July 22 2018 التحليل الفني اليومي لب...QNBFS Daily Technical Trader - Qatar for July 22 2018 التحليل الفني اليومي لب...
QNBFS Daily Technical Trader - Qatar for July 22 2018 التحليل الفني اليومي لب...
 
QNBFS Daily Technical Trader - Qatar for May 13, 2019 التحليل الفني اليومي لب...
QNBFS Daily Technical Trader - Qatar for May 13, 2019 التحليل الفني اليومي لب...QNBFS Daily Technical Trader - Qatar for May 13, 2019 التحليل الفني اليومي لب...
QNBFS Daily Technical Trader - Qatar for May 13, 2019 التحليل الفني اليومي لب...
 
QNBFS Daily Technical Trader Qatar - November 09, 2021 التحليل الفني اليومي ل...
QNBFS Daily Technical Trader Qatar - November 09, 2021 التحليل الفني اليومي ل...QNBFS Daily Technical Trader Qatar - November 09, 2021 التحليل الفني اليومي ل...
QNBFS Daily Technical Trader Qatar - November 09, 2021 التحليل الفني اليومي ل...
 
Top 5 Indicators for Intraday Trading and How to Use Them
Top 5 Indicators for Intraday Trading and How to Use ThemTop 5 Indicators for Intraday Trading and How to Use Them
Top 5 Indicators for Intraday Trading and How to Use Them
 
QNBFS Daily Technical Trader - Qatar for April 29, 2018 التحليل الفني اليومي ...
QNBFS Daily Technical Trader - Qatar for April 29, 2018 التحليل الفني اليومي ...QNBFS Daily Technical Trader - Qatar for April 29, 2018 التحليل الفني اليومي ...
QNBFS Daily Technical Trader - Qatar for April 29, 2018 التحليل الفني اليومي ...
 
QNBFS Daily Technical Trader - Qatar for July 15 2018 التحليل الفني اليومي لب...
QNBFS Daily Technical Trader - Qatar for July 15 2018 التحليل الفني اليومي لب...QNBFS Daily Technical Trader - Qatar for July 15 2018 التحليل الفني اليومي لب...
QNBFS Daily Technical Trader - Qatar for July 15 2018 التحليل الفني اليومي لب...
 
TECHNICAL ANALYSIS.pptx
TECHNICAL ANALYSIS.pptxTECHNICAL ANALYSIS.pptx
TECHNICAL ANALYSIS.pptx
 
QNBFS Daily Technical Trader Qatar - October 24, 2021 التحليل الفني اليومي لب...
QNBFS Daily Technical Trader Qatar - October 24, 2021 التحليل الفني اليومي لب...QNBFS Daily Technical Trader Qatar - October 24, 2021 التحليل الفني اليومي لب...
QNBFS Daily Technical Trader Qatar - October 24, 2021 التحليل الفني اليومي لب...
 

More from Sanjay Lad (6)

Basic Capital Markets
Basic Capital MarketsBasic Capital Markets
Basic Capital Markets
 
02 aug
02 aug02 aug
02 aug
 
02 aug
02 aug02 aug
02 aug
 
Trading strategy
Trading strategyTrading strategy
Trading strategy
 
Why ask tips
Why ask tipsWhy ask tips
Why ask tips
 
Technical Analysis for Professionals
Technical Analysis for ProfessionalsTechnical Analysis for Professionals
Technical Analysis for Professionals
 

Recently uploaded

一比一原版Adelaide毕业证阿德莱德大学毕业证成绩单如何办理
一比一原版Adelaide毕业证阿德莱德大学毕业证成绩单如何办理一比一原版Adelaide毕业证阿德莱德大学毕业证成绩单如何办理
一比一原版Adelaide毕业证阿德莱德大学毕业证成绩单如何办理
zsewypy
 
NO1 Uk Divorce problem uk all amil baba in karachi,lahore,pakistan talaq ka m...
NO1 Uk Divorce problem uk all amil baba in karachi,lahore,pakistan talaq ka m...NO1 Uk Divorce problem uk all amil baba in karachi,lahore,pakistan talaq ka m...
NO1 Uk Divorce problem uk all amil baba in karachi,lahore,pakistan talaq ka m...
Amil Baba Dawood bangali
 
Monthly Economic Monitoring of Ukraine No. 232, May 2024
Monthly Economic Monitoring of Ukraine No. 232, May 2024Monthly Economic Monitoring of Ukraine No. 232, May 2024

Recently uploaded (20)

how can I transfer pi coins to someone in a different country.
how can I transfer pi coins to someone in a different country.how can I transfer pi coins to someone in a different country.
how can I transfer pi coins to someone in a different country.
 
The European Unemployment Puzzle: implications from population aging
The European Unemployment Puzzle: implications from population agingThe European Unemployment Puzzle: implications from population aging
The European Unemployment Puzzle: implications from population aging
 
Introduction to Indian Financial System ()
Introduction to Indian Financial System ()Introduction to Indian Financial System ()
Introduction to Indian Financial System ()
 
when officially can i withdraw my pi Network coins.
when officially can i withdraw my pi Network coins.when officially can i withdraw my pi Network coins.
when officially can i withdraw my pi Network coins.
 
National Financial Reporting Authority (NFRA)
National Financial Reporting Authority (NFRA)National Financial Reporting Authority (NFRA)
National Financial Reporting Authority (NFRA)
 
is it possible to sell pi network coin in 2024.
is it possible to sell pi network coin in 2024.is it possible to sell pi network coin in 2024.
is it possible to sell pi network coin in 2024.
 
9th issue of our inhouse magazine Ingenious May 2024.pdf
9th issue of our inhouse magazine Ingenious May 2024.pdf9th issue of our inhouse magazine Ingenious May 2024.pdf
9th issue of our inhouse magazine Ingenious May 2024.pdf
 
Falcon Invoice Discounting: Optimizing Returns with Minimal Risk
Falcon Invoice Discounting: Optimizing Returns with Minimal RiskFalcon Invoice Discounting: Optimizing Returns with Minimal Risk
Falcon Invoice Discounting: Optimizing Returns with Minimal Risk
 
how can i use my minded pi coins I need some funds.
how can i use my minded pi coins I need some funds.how can i use my minded pi coins I need some funds.
how can i use my minded pi coins I need some funds.
 
Webinar Exploring DORA for Fintechs - Simont Braun
Webinar Exploring DORA for Fintechs - Simont BraunWebinar Exploring DORA for Fintechs - Simont Braun
Webinar Exploring DORA for Fintechs - Simont Braun
 
how can I sell pi coins after successfully completing KYC
how can I sell pi coins after successfully completing KYChow can I sell pi coins after successfully completing KYC
how can I sell pi coins after successfully completing KYC
 
how can I sell my locked pi coins safety.
how can I sell my locked pi coins safety.how can I sell my locked pi coins safety.
how can I sell my locked pi coins safety.
 
一比一原版Adelaide毕业证阿德莱德大学毕业证成绩单如何办理
一比一原版Adelaide毕业证阿德莱德大学毕业证成绩单如何办理一比一原版Adelaide毕业证阿德莱德大学毕业证成绩单如何办理
一比一原版Adelaide毕业证阿德莱德大学毕业证成绩单如何办理
 
how can I sell my mined pi coins profitabily.
how can I sell my mined pi coins profitabily.how can I sell my mined pi coins profitabily.
how can I sell my mined pi coins profitabily.
 
Proposer Builder Separation Problem in Ethereum
Proposer Builder Separation Problem in EthereumProposer Builder Separation Problem in Ethereum
Proposer Builder Separation Problem in Ethereum
 
NO1 Uk Divorce problem uk all amil baba in karachi,lahore,pakistan talaq ka m...
NO1 Uk Divorce problem uk all amil baba in karachi,lahore,pakistan talaq ka m...NO1 Uk Divorce problem uk all amil baba in karachi,lahore,pakistan talaq ka m...
NO1 Uk Divorce problem uk all amil baba in karachi,lahore,pakistan talaq ka m...
 
The new type of smart, sustainable entrepreneurship and the next day | Europe...
The new type of smart, sustainable entrepreneurship and the next day | Europe...The new type of smart, sustainable entrepreneurship and the next day | Europe...
The new type of smart, sustainable entrepreneurship and the next day | Europe...
 
Monthly Economic Monitoring of Ukraine No. 232, May 2024
Monthly Economic Monitoring of Ukraine No. 232, May 2024Monthly Economic Monitoring of Ukraine No. 232, May 2024
Monthly Economic Monitoring of Ukraine No. 232, May 2024
 
what is the best method to sell pi coins in 2024
what is the best method to sell pi coins in 2024what is the best method to sell pi coins in 2024
what is the best method to sell pi coins in 2024
 
Summary of financial results for 1Q2024
Summary of financial  results for 1Q2024Summary of financial  results for 1Q2024
Summary of financial results for 1Q2024
 

Invest systemically earn smartly03

  • 1. Invest Systemically & Earn Smartly Sanjay Lad
  • 2. IntroductIon • A simple course design for common Trader. • This course is related to moving averages and oscillators. • This TECHNICAL ANALYSIS COURSE will make a vast difference in your approach & attitude towards STOCK MARKET. • The course is designed in such a way that TECHNICAL ANALYSIS subject becomes very easy to understand even for a new person knowing nothing about it.
  • 3. Technical analysis for investor & trader • Short or medium or long term investor • Trader • Day trader • Trading in Derivatives
  • 4. Summary of course • STUDY OF Minimum Indicator. • How to change the parameter with respect to individual trading? • How to make better use of readymade software available in market? (i.e. Falcon, Trend, Iris etc) • How to find Support , Resistance and Panic in the market by simple methods? • Different Methods or Strategies of Speculation.
  • 5. Concepts Price Open Price : Low Price : High Price : CLOSE Price :
  • 7. Types of Chart Bar Chart Candlestick Chart
  • 8. Bar Chart • A style of chart used by some technical analysts, on which, as illustrated below, the top of the vertical line indicates the highest price a security traded at during the day, and the bottom represents the lowest price. The closing price is displayed on the right side of the bar, and the opening price is shown on the left side of the bar. A single bar like the one below represents one day of trading
  • 9. Candlestick • A price chart that displays the high, low, open, and close for a security each day over a specified period of time
  • 10. Line Chart • A style of chart that is created by connecting a series of data points together with a line. This is the most basic type of chart used in finance and it is generally created by connecting a series of past prices together with a line
  • 12. TRENDLINE * A Straight line drawn to connect the highest or lowest prices of a share over a period in the immediate past.
  • 13. Support • The price level which, historically, a stock has had difficulty falling below. It is thought of as the level at which a lot of buyers tend to enter the stock. Often referred to as the "support level".
  • 14. Resistance • The price at which a stock or market can trade, but which it cannot exceed, for a certain period of time. Often referred to as "resistance level
  • 15. MatheMaticS Average • If ‘x’ and ‘y’ are two numbers then, Average = (x + y) 2 Percentage • Example Let, Last close of nifty is 4250 and today close is 4380, what is its percentage rise?
  • 16. Moving Average – MA • An indicator frequently used in technical analysisshowing theaveragevalueof a security'spriceover aset period. Moving averagesaregenerally used to measure momentum and defineareasof possible support and resistance. • Moving averagesareused to emphasize thedirection of atrend and to smooth out priceand volumefluctuations, or "noise", that can confuseinterpretation. Typically, upward momentum isconfirmed when a short-term average(e.g.15-day) crosses abovealonger-term average(e.g. 50-day). Downward momentum isconfirmed when ashort-term averagecrossesbelow along- term average.
  • 17. Simple Moving Average – SMA • A simple, or arithmetic, moving average that is calculated by adding the closing price of the security for a number of time periods and then dividing this total by the number of time periods. Short-term averages respond quickly to changes in the price of the underlying, while long-term averages are slow to react
  • 18. Exponential Moving Average – EMA • A type of moving average that is similar to a simple moving average, except that more weight is given to the latest data. Also known as "exponentially weighted moving average
  • 19. EMA to be use in charts EMA 6 Short Term Average EMA 30 MID Term Average EMA 52 LONG Term Average
  • 20. Uses of Moving Averages • BUY & SELL SIGNAL • SUPPORT • RESISTANCE • TO TAKE POSITION • IT INDICATES TREND
  • 21. Moving Average Convergence Divergence – MACD • A trend-following momentum indicator that shows the relationship between two moving averages of prices. The MACD is calculated by subtracting the 26- day exponential moving average (EMA) from the 12- day EMA. A nine-day EMA of the MACD, called the "signal line", is then plotted on top of the MACD, functioning as a trigger for buy and sell signals
  • 22. MACD ( In chart) MACD (6,30,E,6) IN DAILY, WEEKLY, MONTHLY AND QUARTERLY CHARTS MACD ( 25,52,E,6) IN DAILY CHART MACD (5,15,E,5) QUARTERLY CHART MACD INTRADAY CHART
  • 23. Uses of MACD • BUY AND SELL SIGNAL • TREND • POSITIVE DIVERGENCE • NEGATIVE DIVERGENCE