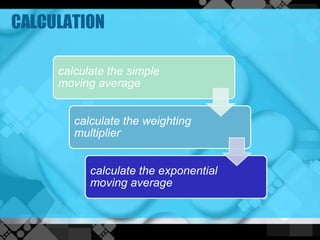
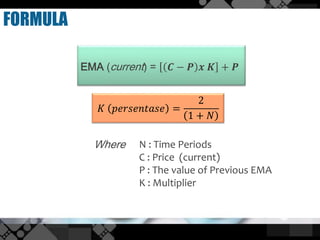
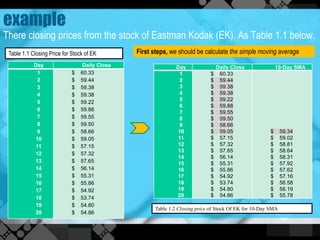
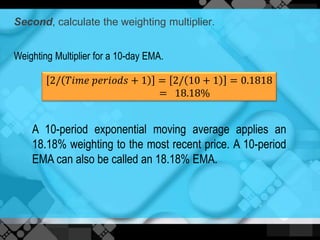
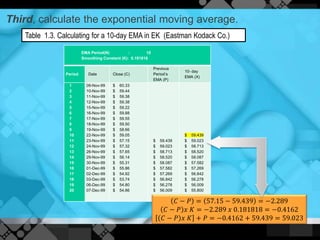
Exponential Moving
Average (EMA)
By ALFIRAMITA HERTANTI
1111040151
Icp 2011
REVISI
DEFINITION
The Exponential Moving Average (EMA) is an average
weighted price data that puts a higher weight on recent
data points.
CONCEPT
The concept used is basis of the EMA is not only of past
price alone, but from the calculation of the moving
average of the past.
CALCULATION
calculate the simple
moving average
calculate the weighting
multiplier
calculate the exponential
moving average
FORMULA
EMA (current) = 𝑪 − 𝑷 𝒙 𝑲 + 𝑷
𝐾 𝑝𝑒𝑟𝑠𝑒𝑛𝑡𝑎𝑠𝑒 =
2
1 + 𝑁
N : Time Periods
C : Price (current)
P : The value of Previous EMA
K : Multiplier
Where
example
There closing prices from the stock of Eastman Kodak (EK). As Table 1.1 below.
Day Daily Close
1
2
3
4
5
6
7
8
9
10
11
12
13
14
15
16
17
18
19
20
$ 60.33
$ 59.44
$ 59.38
$ 59.38
$ 59.22
$ 59.88
$ 59.55
$ 59.50
$ 58.66
$ 59.05
$ 57.15
$ 57.32
$ 57.65
$ 56.14
$ 55.31
$ 55.86
$ 54.92
$ 53.74
$ 54.80
$ 54.86
First steps, we should be calculate the simple moving average
Day Daily Close 10-Day SMA
1
2
3
4
5
6
7
8
9
10
11
12
13
14
15
16
17
18
19
20
$ 60.33
$ 59.44
$ 59.38
$ 59.38
$ 59.22
$ 59.88
$ 59.55
$ 59.50
$ 58.66
$ 59.05
$ 57.15
$ 57.32
$ 57.65
$ 56.14
$ 55.31
$ 55.86
$ 54.92
$ 53.74
$ 54.80
$ 54.86
$ 59.34
$ 59.02
$ 58.81
$ 58.64
$ 58.31
$ 57.92
$ 57.62
$ 57.16
$ 56.58
$ 56.19
$ 55.78
Table 1.2 Closing price of Stock Of EK for 10-Day SMA
Table 1.1 Closing Price for Stock of EK
Second, calculate the weighting multiplier.
Weighting Multiplier for a 10-day EMA.
2/ 𝑇𝑖𝑚𝑒 𝑝𝑒𝑟𝑖𝑜𝑑𝑠 + 1 = 2/ 10 + 1 = 0.1818
= 18.18%
A 10-period exponential moving average applies an
18.18% weighting to the most recent price. A 10-period
EMA can also be called an 18.18% EMA.
Third, calculate the exponential moving average.
Table 1.3. Calculating for a 10-day EMA in EK (Eastman Kodack Co.)
EMA Period(N) : 10
Smoothing Constant (K): 0.181818
Period Date Close (C)
Previous
Period’s
EMA (P)
10- day
EMA (X)
1
2
3
4
5
6
7
8
9
10
11
12
13
14
15
16
17
18
19
20
09-Nov-99
10-Nov-99
11-Nov-99
12-Nov-99
15-Nov-99
16-Nov-99
17-Nov-99
18-Nov-99
19-Nov-99
22-Nov-99
23-Nov-99
24-Nov-99
26-Nov-99
29-Nov-99
30-Nov-99
01-Dec-99
02-Dec-99
03-Dec-99
06-Dec-99
07-Dec-99
$ 60.33
$ 59.44
$ 59.38
$ 59.38
$ 59.22
$ 59.88
$ 59.55
$ 59.50
$ 58.66
$ 59.05
$ 57.15
$ 57.32
$ 57.65
$ 56.14
$ 55.31
$ 55.86
$ 54.92
$ 53.74
$ 54.80
$ 54.86
$ 59.439
$ 59.023
$ 58.713
$ 58.520
$ 58.087
$ 57.582
$ 57.269
$ 56.842
$ 56.278
$ 56.009
$ 59.439
$ 59.023
$ 58.713
$ 58.520
$ 58.087
$ 57.582
$ 57.269
$ 56.842
$ 56.278
$ 56.009
$ 55.800
𝐶 − 𝑃 = 57.15 − 59.439 = −2.289
𝐶 − 𝑃 𝑥 𝐾 = −2.289 𝑥 0.181818 = −0.4162
𝐶 − 𝑃 𝑥 𝐾 + 𝑃 = −0.4162 + 59.439 = 59.023
RESULT & CHART ANALYSIS
ADVANTAGES AND DISADVANTAGES
1. Exponential moving average (EMA)
is able to move quickly and well in
showing the recent price changes
2. Calculation using the EMA produce
an average value that comes closest
to the actual price when compared
to SMA.
1. Calculation of EMA is much more
complicated than in other types of
moving averages
2. Highly susceptible to getting false
signals in determining an ongoing
trend.
Exponential moving average (EMA)

Exponential moving average (EMA)

  • 1.
    Exponential Moving Average (EMA) ByALFIRAMITA HERTANTI 1111040151 Icp 2011 REVISI
  • 2.
    DEFINITION The Exponential MovingAverage (EMA) is an average weighted price data that puts a higher weight on recent data points.
  • 3.
    CONCEPT The concept usedis basis of the EMA is not only of past price alone, but from the calculation of the moving average of the past.
  • 4.
    CALCULATION calculate the simple movingaverage calculate the weighting multiplier calculate the exponential moving average
  • 5.
    FORMULA EMA (current) =𝑪 − 𝑷 𝒙 𝑲 + 𝑷 𝐾 𝑝𝑒𝑟𝑠𝑒𝑛𝑡𝑎𝑠𝑒 = 2 1 + 𝑁 N : Time Periods C : Price (current) P : The value of Previous EMA K : Multiplier Where
  • 6.
    example There closing pricesfrom the stock of Eastman Kodak (EK). As Table 1.1 below. Day Daily Close 1 2 3 4 5 6 7 8 9 10 11 12 13 14 15 16 17 18 19 20 $ 60.33 $ 59.44 $ 59.38 $ 59.38 $ 59.22 $ 59.88 $ 59.55 $ 59.50 $ 58.66 $ 59.05 $ 57.15 $ 57.32 $ 57.65 $ 56.14 $ 55.31 $ 55.86 $ 54.92 $ 53.74 $ 54.80 $ 54.86 First steps, we should be calculate the simple moving average Day Daily Close 10-Day SMA 1 2 3 4 5 6 7 8 9 10 11 12 13 14 15 16 17 18 19 20 $ 60.33 $ 59.44 $ 59.38 $ 59.38 $ 59.22 $ 59.88 $ 59.55 $ 59.50 $ 58.66 $ 59.05 $ 57.15 $ 57.32 $ 57.65 $ 56.14 $ 55.31 $ 55.86 $ 54.92 $ 53.74 $ 54.80 $ 54.86 $ 59.34 $ 59.02 $ 58.81 $ 58.64 $ 58.31 $ 57.92 $ 57.62 $ 57.16 $ 56.58 $ 56.19 $ 55.78 Table 1.2 Closing price of Stock Of EK for 10-Day SMA Table 1.1 Closing Price for Stock of EK
  • 7.
    Second, calculate theweighting multiplier. Weighting Multiplier for a 10-day EMA. 2/ 𝑇𝑖𝑚𝑒 𝑝𝑒𝑟𝑖𝑜𝑑𝑠 + 1 = 2/ 10 + 1 = 0.1818 = 18.18% A 10-period exponential moving average applies an 18.18% weighting to the most recent price. A 10-period EMA can also be called an 18.18% EMA.
  • 8.
    Third, calculate theexponential moving average. Table 1.3. Calculating for a 10-day EMA in EK (Eastman Kodack Co.) EMA Period(N) : 10 Smoothing Constant (K): 0.181818 Period Date Close (C) Previous Period’s EMA (P) 10- day EMA (X) 1 2 3 4 5 6 7 8 9 10 11 12 13 14 15 16 17 18 19 20 09-Nov-99 10-Nov-99 11-Nov-99 12-Nov-99 15-Nov-99 16-Nov-99 17-Nov-99 18-Nov-99 19-Nov-99 22-Nov-99 23-Nov-99 24-Nov-99 26-Nov-99 29-Nov-99 30-Nov-99 01-Dec-99 02-Dec-99 03-Dec-99 06-Dec-99 07-Dec-99 $ 60.33 $ 59.44 $ 59.38 $ 59.38 $ 59.22 $ 59.88 $ 59.55 $ 59.50 $ 58.66 $ 59.05 $ 57.15 $ 57.32 $ 57.65 $ 56.14 $ 55.31 $ 55.86 $ 54.92 $ 53.74 $ 54.80 $ 54.86 $ 59.439 $ 59.023 $ 58.713 $ 58.520 $ 58.087 $ 57.582 $ 57.269 $ 56.842 $ 56.278 $ 56.009 $ 59.439 $ 59.023 $ 58.713 $ 58.520 $ 58.087 $ 57.582 $ 57.269 $ 56.842 $ 56.278 $ 56.009 $ 55.800 𝐶 − 𝑃 = 57.15 − 59.439 = −2.289 𝐶 − 𝑃 𝑥 𝐾 = −2.289 𝑥 0.181818 = −0.4162 𝐶 − 𝑃 𝑥 𝐾 + 𝑃 = −0.4162 + 59.439 = 59.023
  • 9.
  • 10.
    ADVANTAGES AND DISADVANTAGES 1.Exponential moving average (EMA) is able to move quickly and well in showing the recent price changes 2. Calculation using the EMA produce an average value that comes closest to the actual price when compared to SMA. 1. Calculation of EMA is much more complicated than in other types of moving averages 2. Highly susceptible to getting false signals in determining an ongoing trend.