Here are the steps I would take to get the two vehicles to meet at the center of the room at the same time when released from opposite sides:
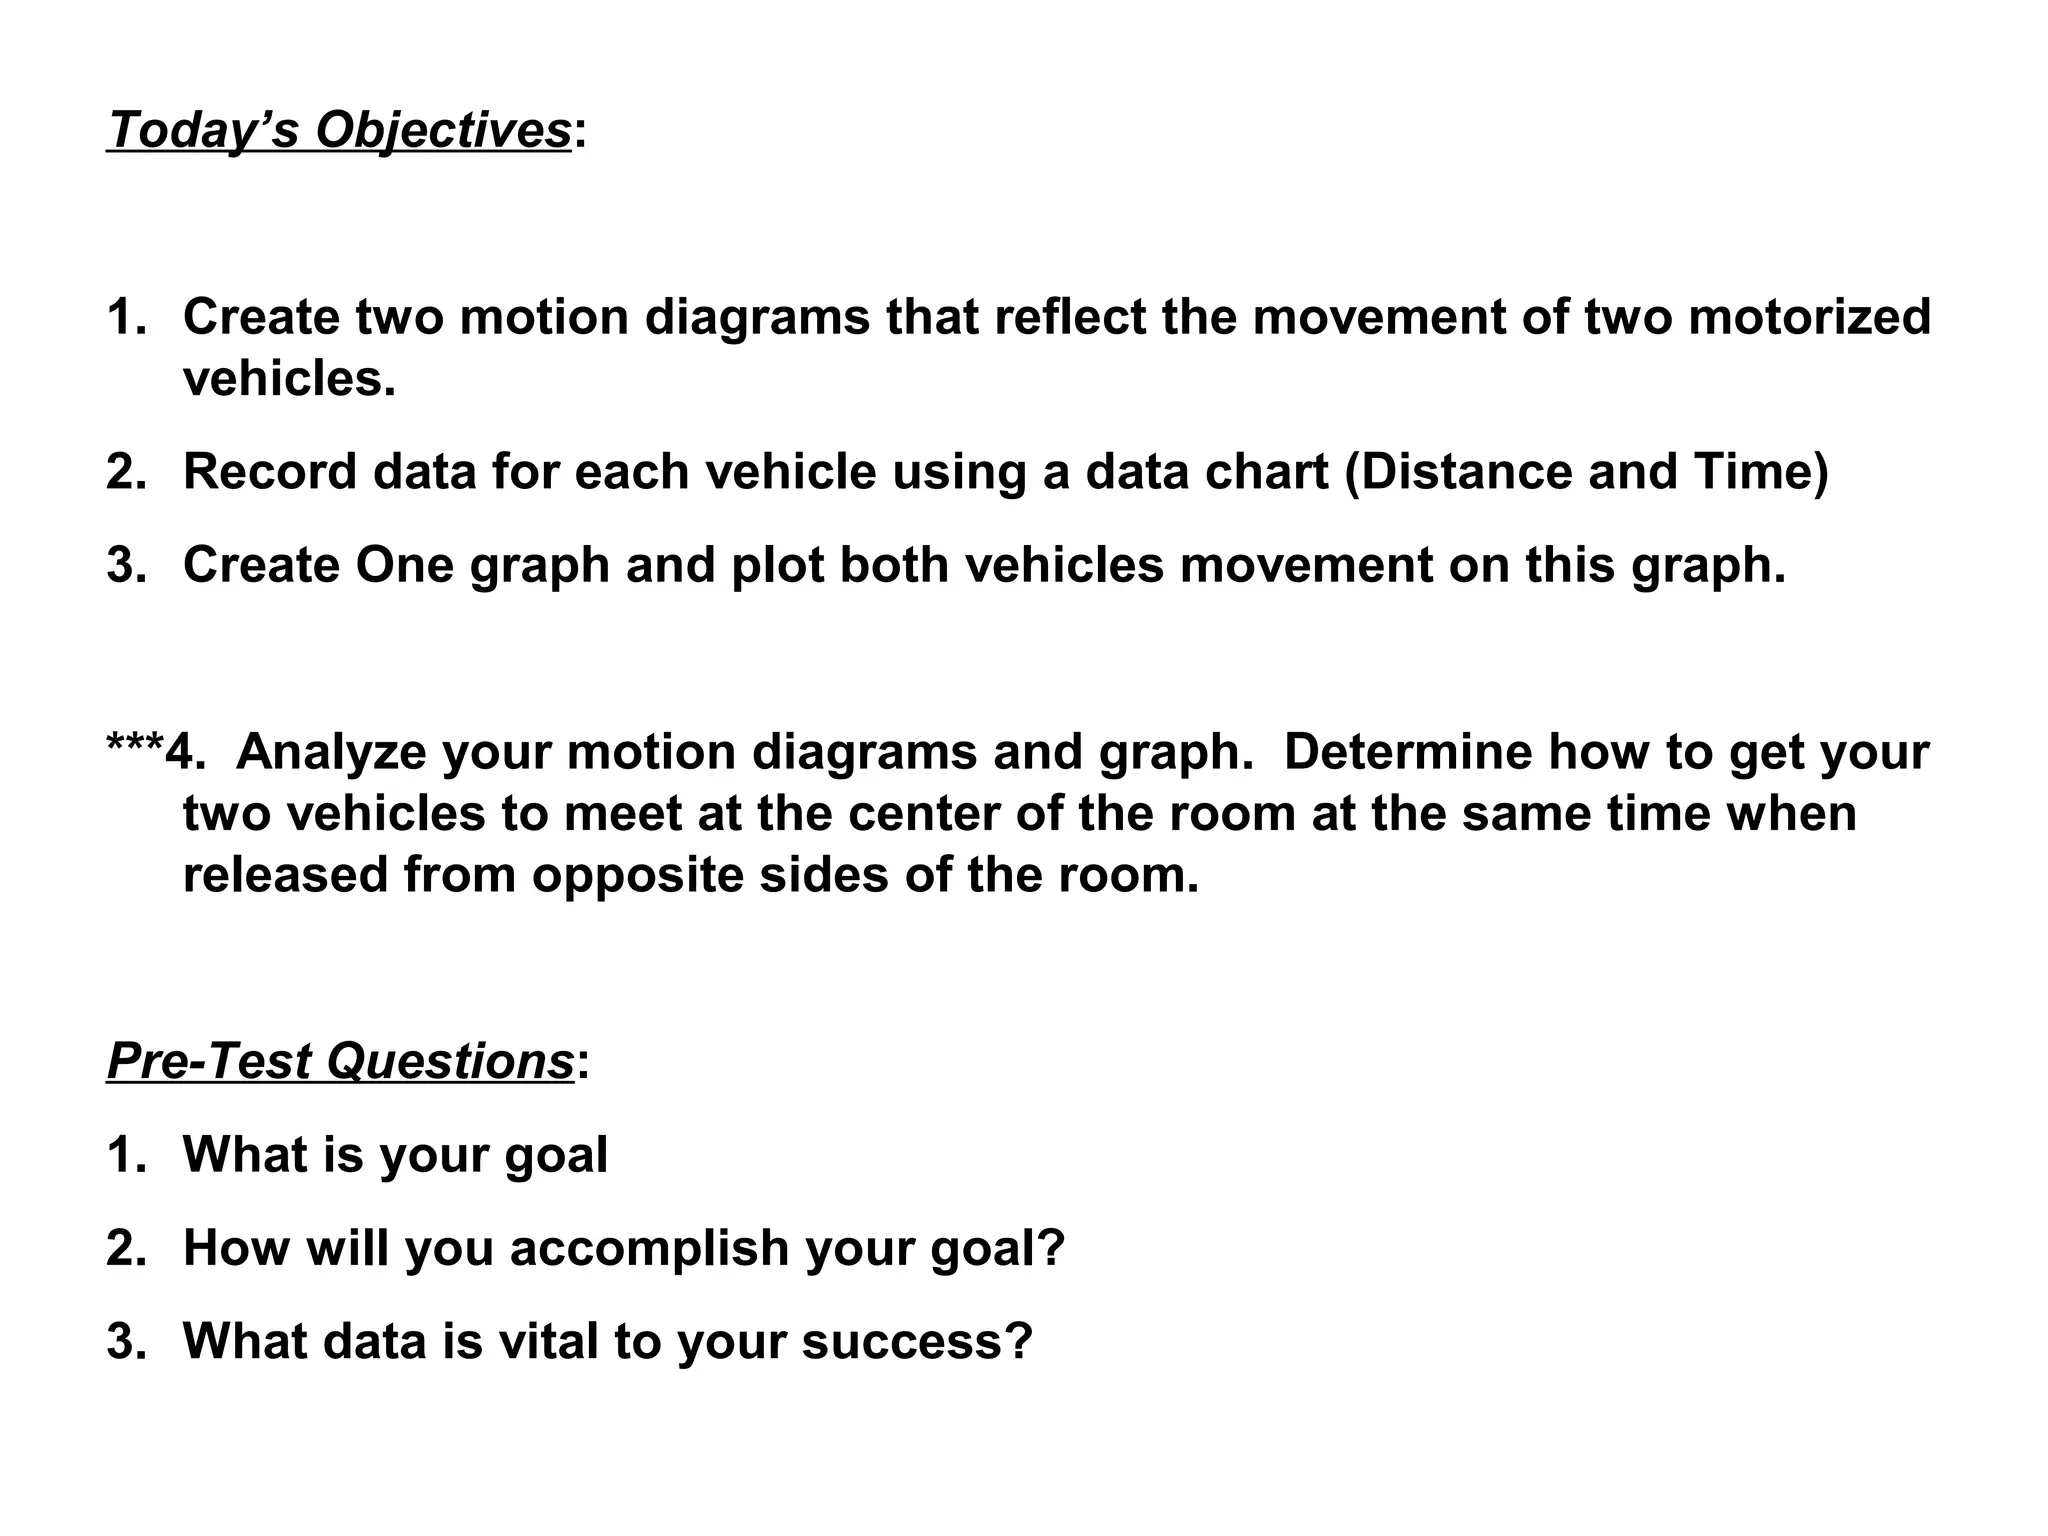
1. My goal is to have the two vehicles meet at the center of the room at the same time.
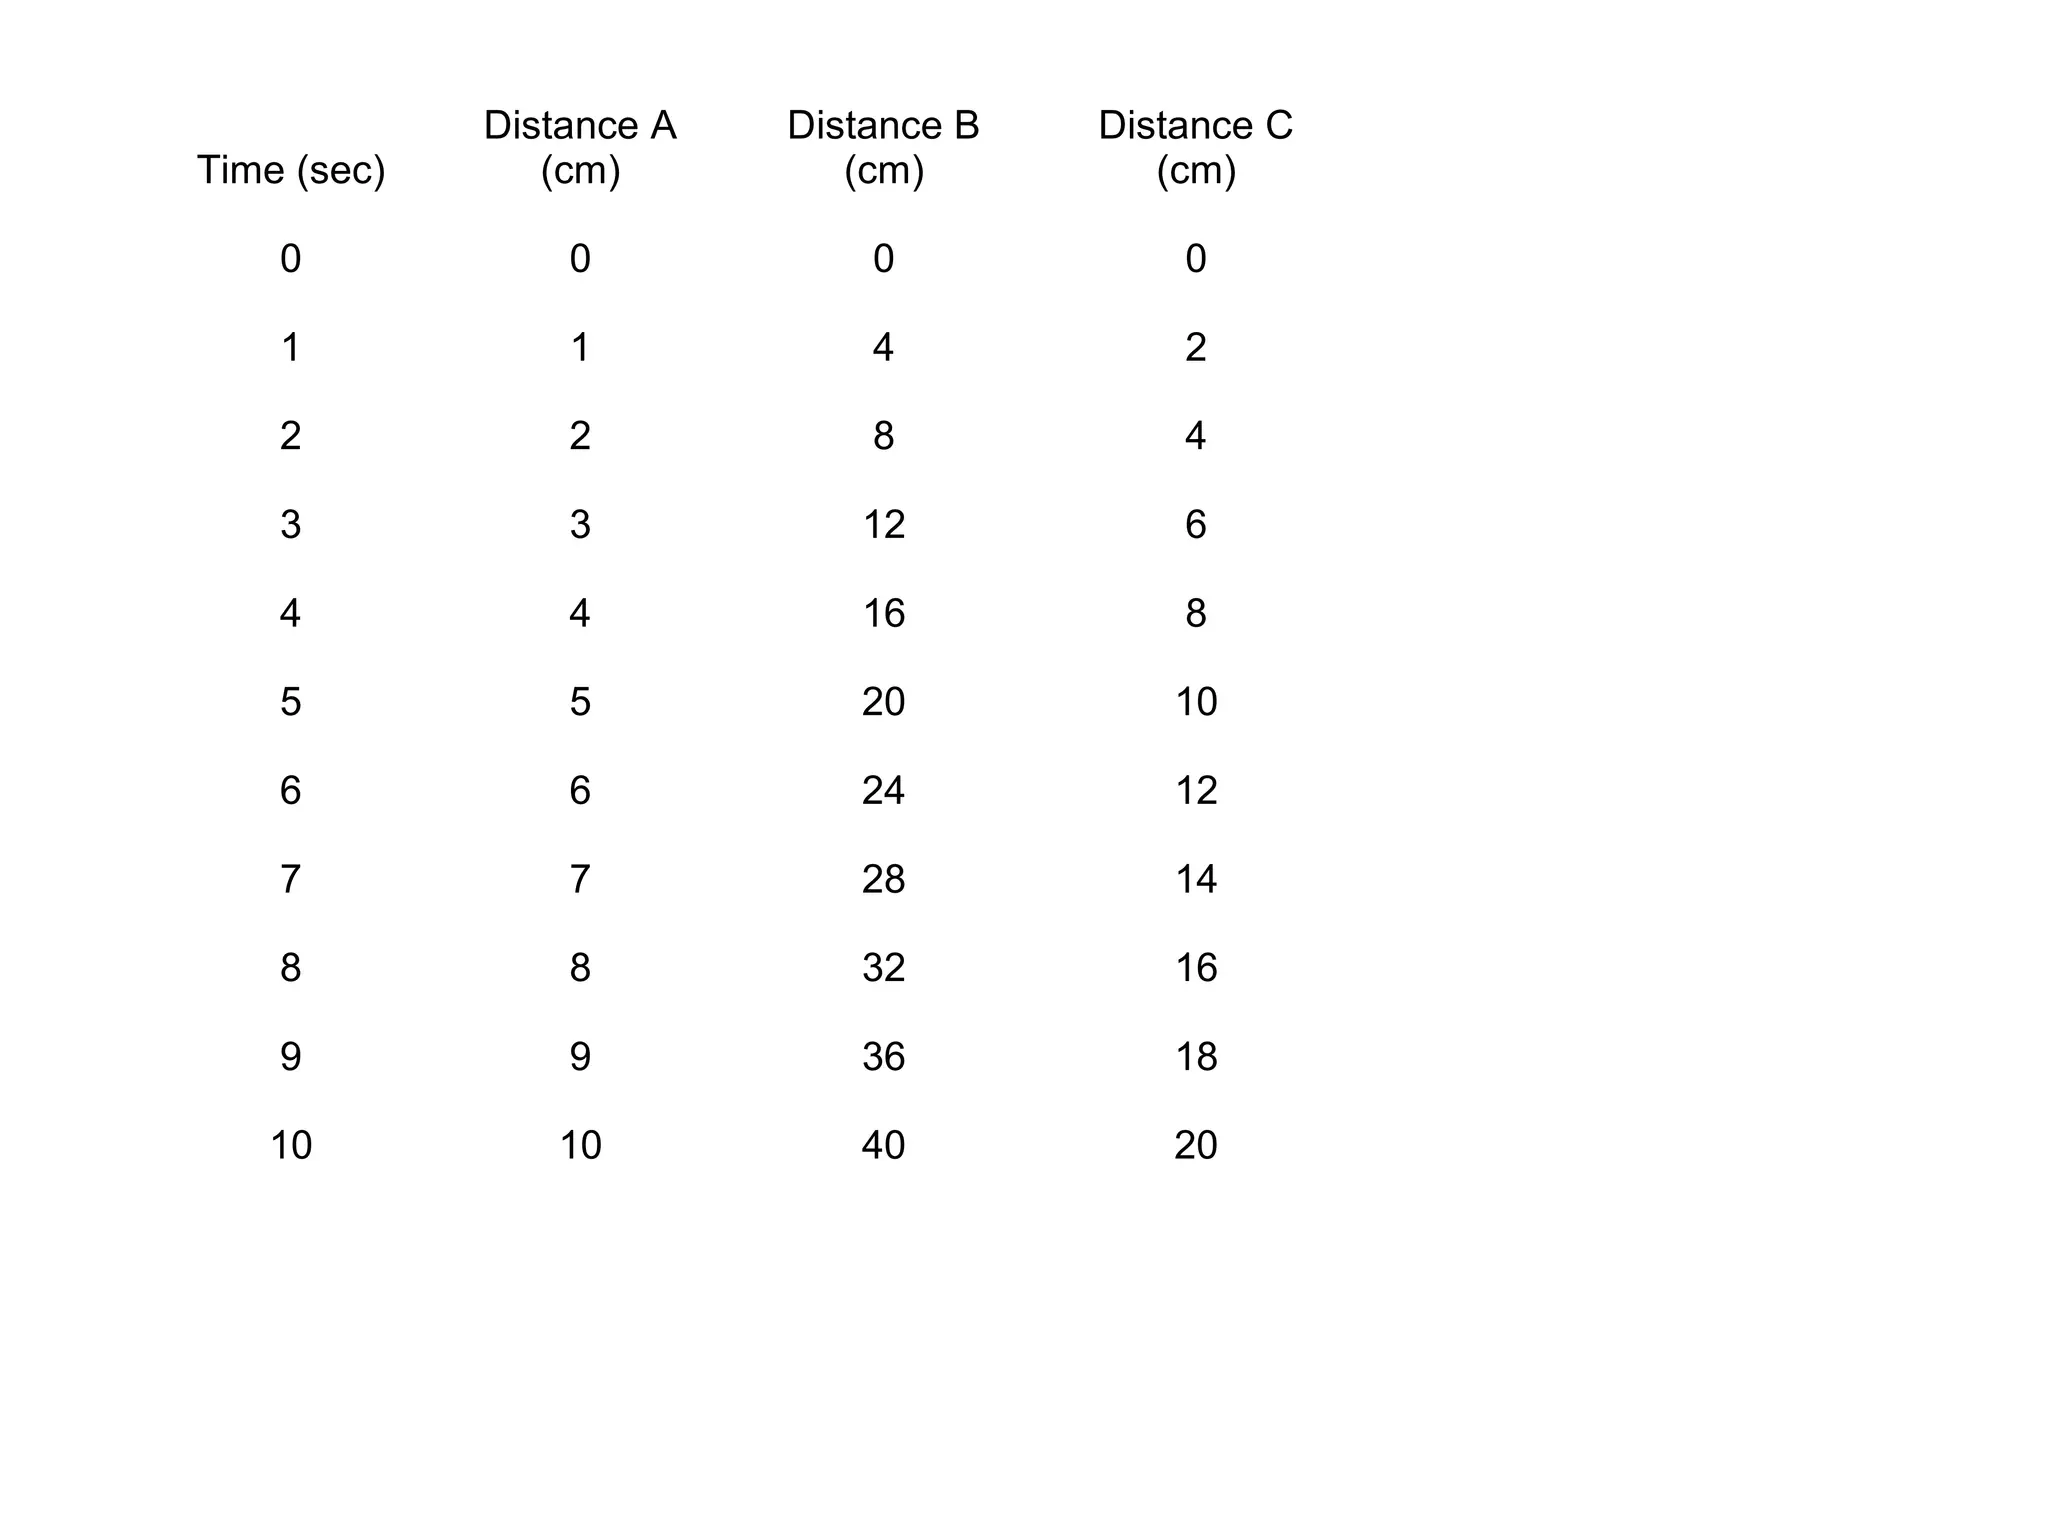
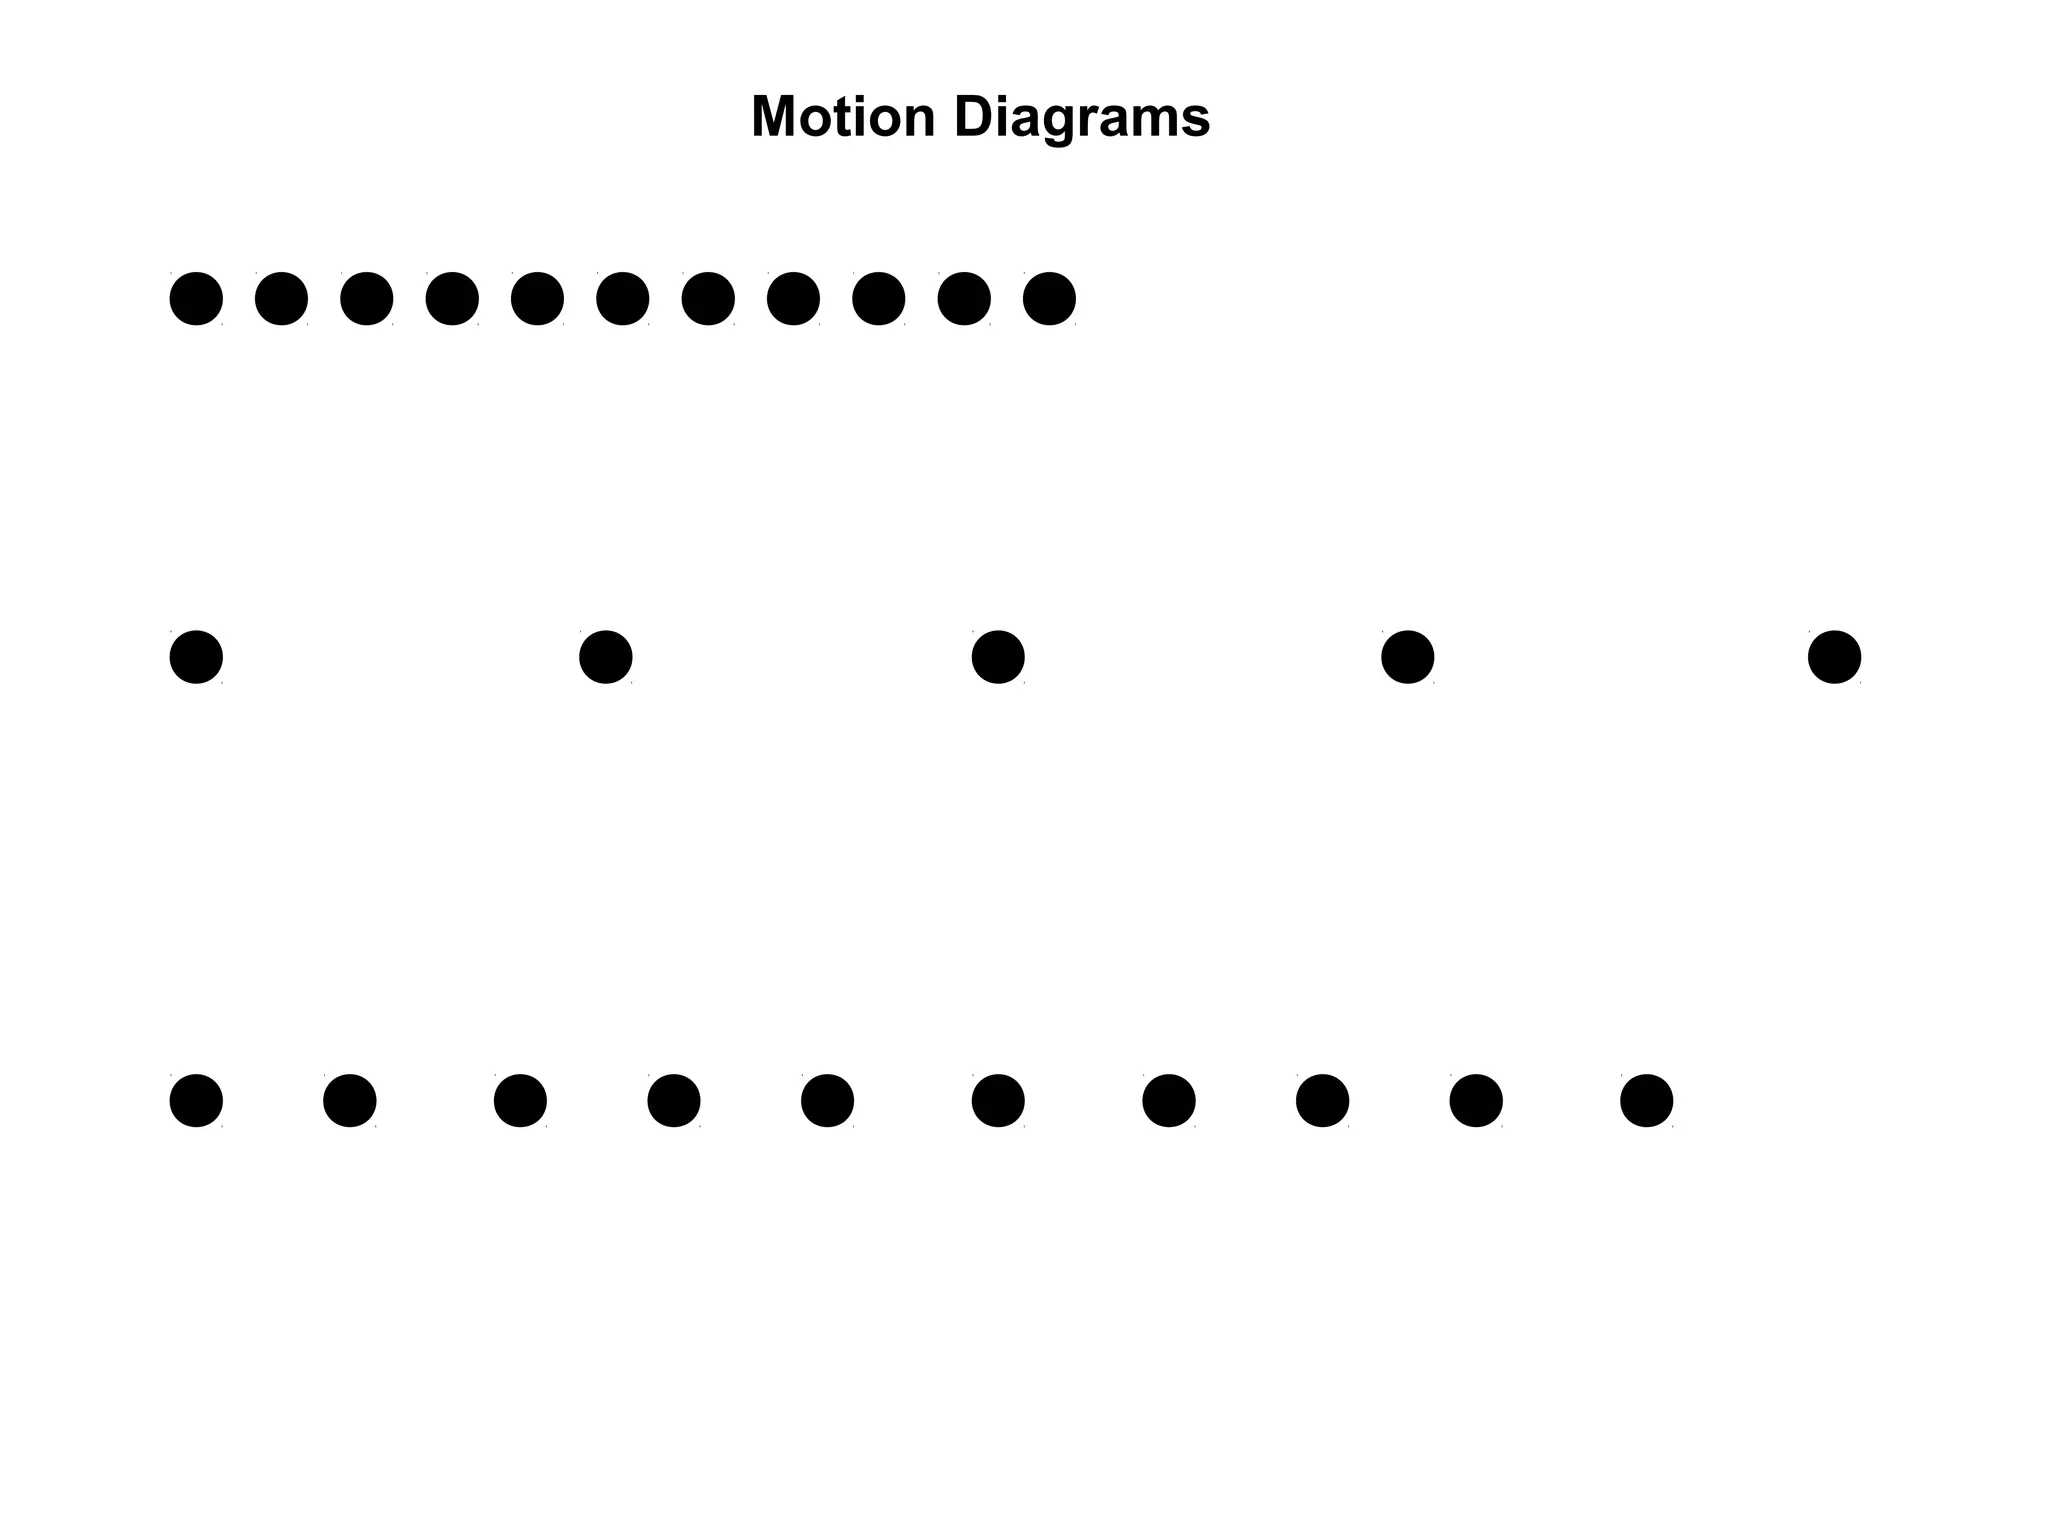
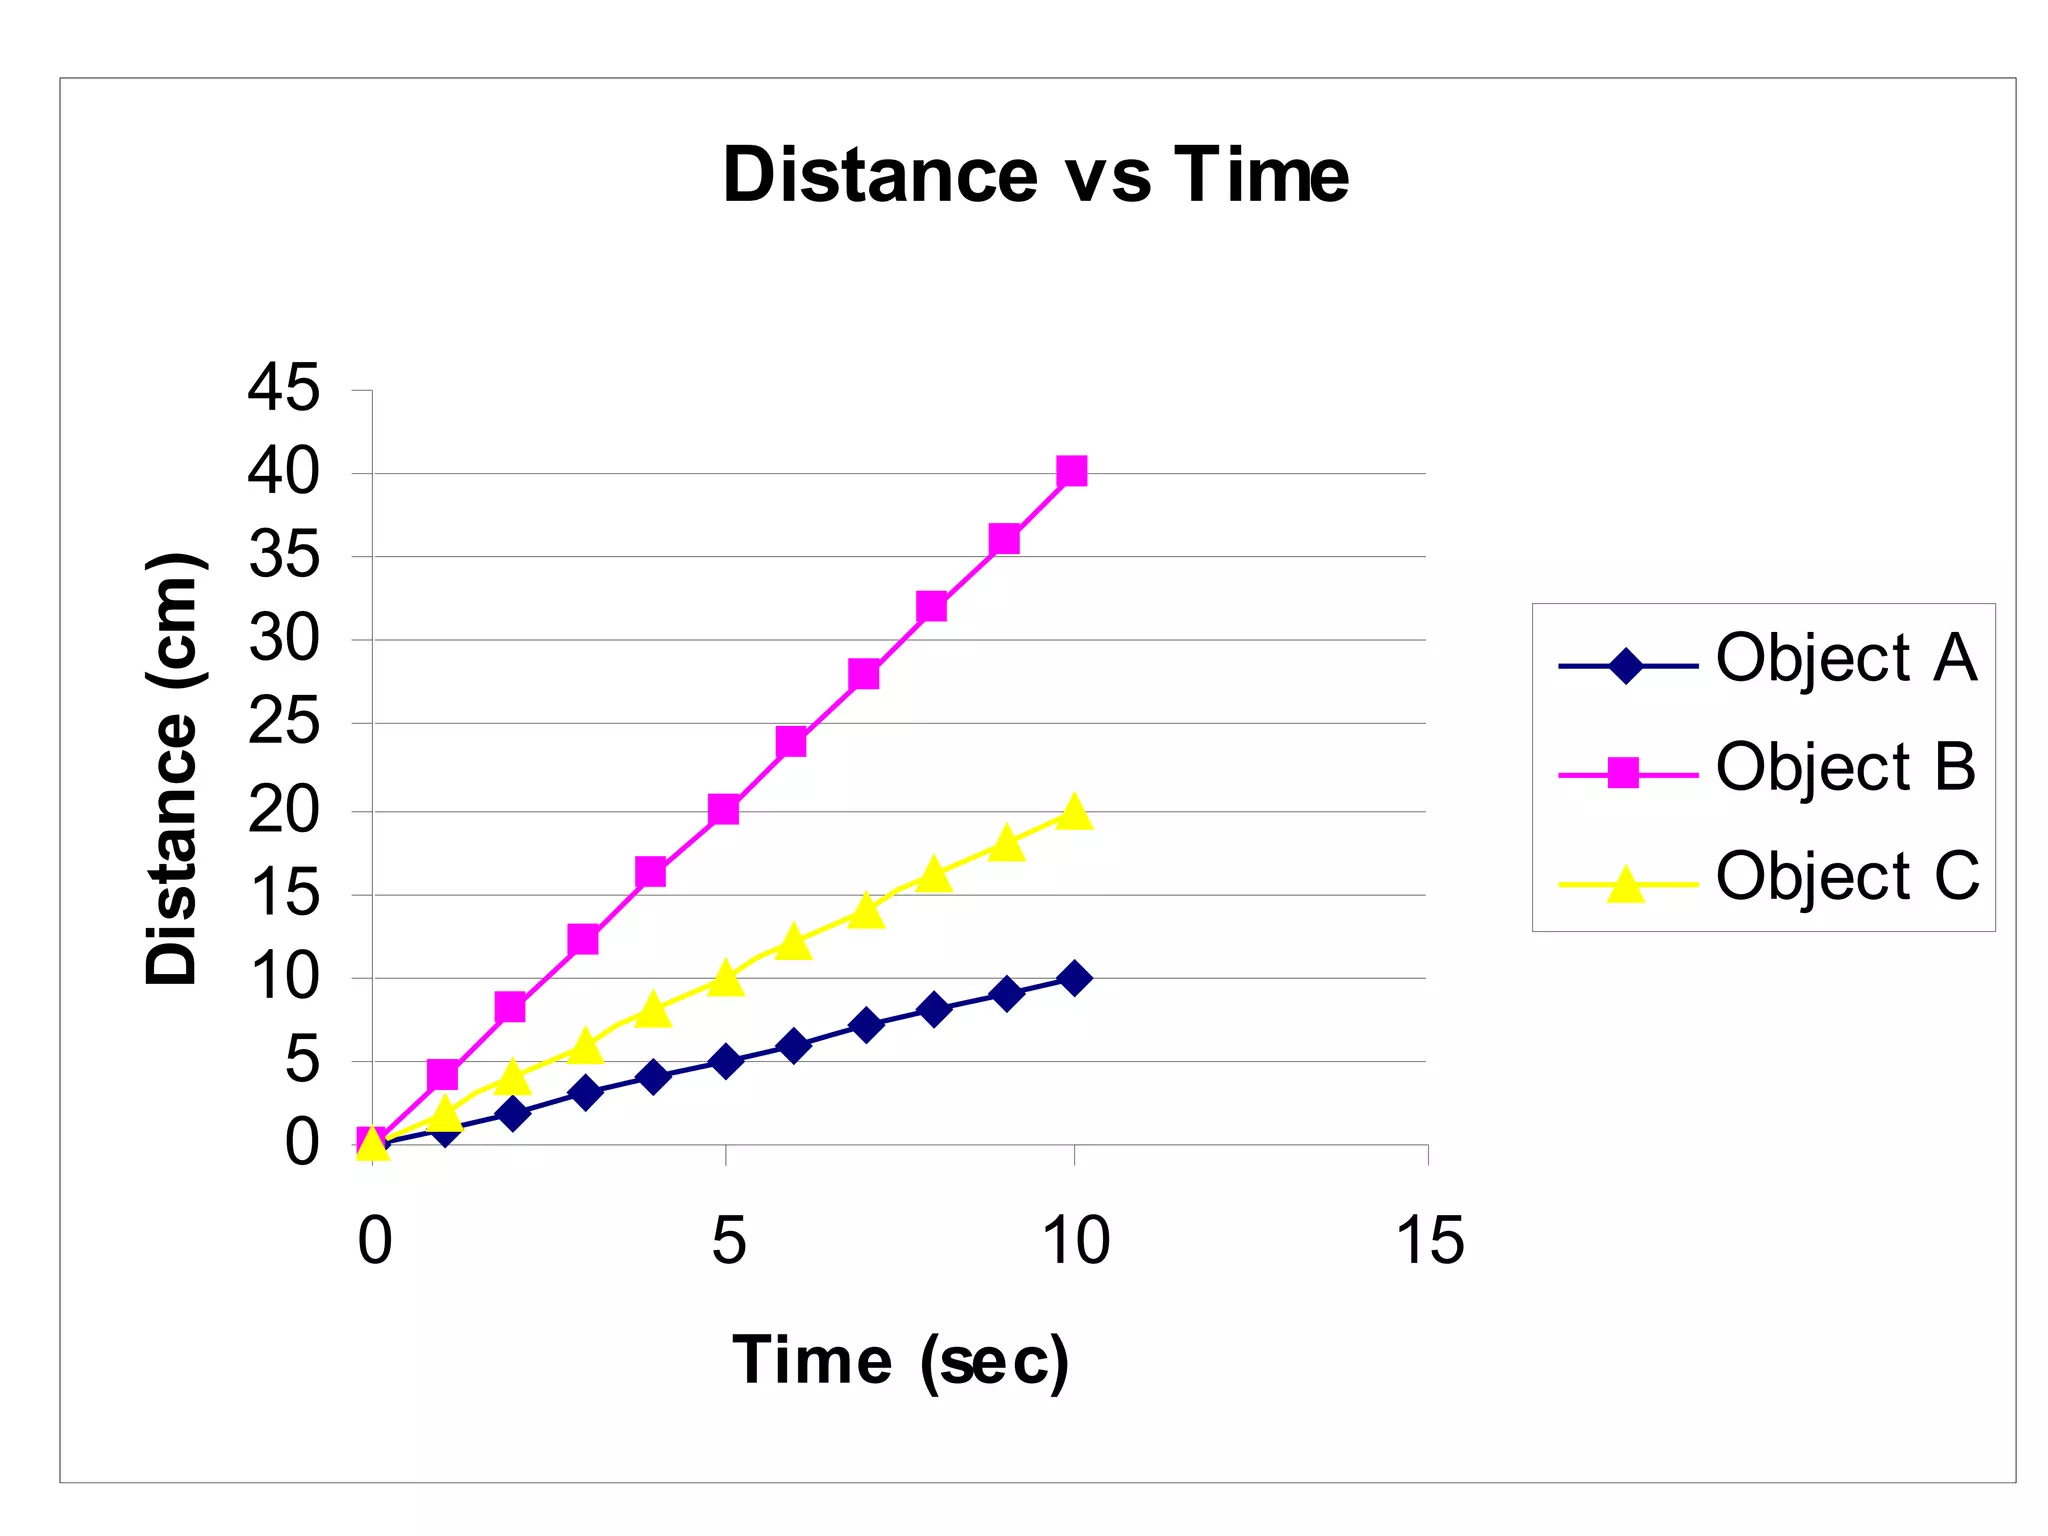
2. To accomplish this, I need to determine the speed each vehicle needs to travel. I will collect distance and time data for test runs of each vehicle and create a graph to determine their speeds.
3. The distance from each starting point to the center and the time it takes each vehicle to travel that distance is vital data. With this information, I can calculate the speed of each vehicle and adjust their speeds so that they meet at the center at the same


![Vibe Coding vs. Spec-Driven Development [Free Meetup]](https://cdn.slidesharecdn.com/ss_thumbnails/vibecodingvsspecdrivendevelopment-251209105622-43f455e7-thumbnail.jpg?width=640&height=640&fit=bounds)


