
Recommended
Recommended
More Related Content
What's hot
What's hot (20)
Viewers also liked
Similar to Ukázkový report - SolidVision
Similar to Ukázkový report - SolidVision (20)
Recently uploaded
Recently uploaded (20)
Ukázkový report - SolidVision
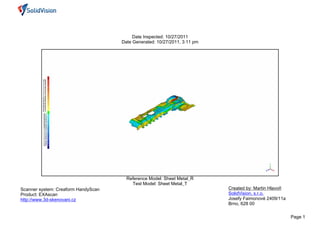
- 1. Date Inspected: 10/27/2011 Date Generated: 10/27/2011, 3:11 pm Reference Model: Sheet Metal_R Test Model: Sheet Metal_T Scanner system: Creaform HandyScan Created by: Martin Hlavoň Product: EXAscan SolidVision, s.r.o. http://www.3d-skenovani.cz Josefy Faimonové 2409/11a Brno, 628 00 Page 1
- 2. Alignment Statistics Alignment Name: Best fit alignment: Sheet Metal_R (2) Model Max. Length: 722.816423495mm Average Error: 0.288247869mm Page 2
- 3. 3D Comparison Results Reference Model Sheet Metal_R Test Model Sheet Metal_T No. of Data Points 1686643 # Outliers 7928 Tolerance Type 3D Deviation Units mm Max. Critical 2.0 Max. Nominal 0.1 Min. Nominal -0.1 Min. Critical -2.0 Deviation Max. Upper Dev. 36.1 Max. Lower Dev. -32.4 Average Deviation 0.3 /-0.3 Standard Deviation 0.9 Deviation Distribution >=Min <Max # Points % Deviation Distribution -2.0 -1.9 28 0.0 -1.9 -1.8 24 0.0 25.0 -1.8 -1.7 22 0.0 -1.7 -1.6 77 0.0 20.0 -1.6 -1.4 314 0.0 -1.4 -1.3 1111 0.1 15.0 -1.3 -1.2 2842 0.2 -1.2 -1.1 5507 0.3 10.0 -1.1 -1.0 6672 0.4 -1.0 -0.9 8916 0.5 5.0 -0.9 -0.8 11520 0.7 -0.8 -0.7 23000 1.4 0.0 -0.7 -0.5 35780 2.1 -2.000 -1.200 -0.400 0.400 1.200 2.000 -0.5 -0.4 55927 3.3 -0.4 -0.3 125441 7.4 -0.3 -0.2 167155 9.9 -0.2 -0.1 177395 10.5 -0.1 0.1 371402 22.0 0.1 0.2 203731 12.1 Page 3
- 4. >=Min <Max # Points % 0.2 0.3 152339 9.0 0.3 0.4 114889 6.8 0.4 0.5 87991 5.2 0.5 0.7 61745 3.7 0.7 0.8 28415 1.7 0.8 0.9 14272 0.8 0.9 1.0 7111 0.4 1.0 1.1 4925 0.3 1.1 1.2 3754 0.2 1.2 1.3 2223 0.1 1.3 1.4 1851 0.1 1.4 1.6 1667 0.1 1.6 1.7 1130 0.1 1.7 1.8 813 0.0 1.8 1.9 643 0.0 1.9 2.0 630 0.0 Out of Upper Critical 4450 0.3 Out of Lower Critical 931 0.3 Standard Deviations Distribution (+/-) # Points % Standard Deviation -6 * Std. Dev. 843 0.0 -5 * Std. Dev. 11 0.0 50.0 -4 * Std. Dev. 10 0.0 45.0 -3 * Std. Dev. 119 0.0 40.0 35.0 -2 * Std. Dev. 26383 1.6 30.0 -1 * Std. Dev. 843364 50.0 25.0 1 * Std. Dev. 791201 46.9 20.0 2 * Std. Dev. 19418 1.2 15.0 3 * Std. Dev. 3109 0.2 10.0 4 * Std. Dev. 339 0.0 5.0 5 * Std. Dev. 137 0.0 0.0 -7.000 -5.000 -3.000 -1.000 1.000 3.000 5.000 7.000 6 * Std. Dev. 1709 0.1 Page 4
- 5. Annotated: Annotation View 1 Units: mm CSYS: World CSYS Name Dev Status Upper Tol. Lower Tol. Ref X Ref Y Ref Z Dev Radius Dev X Dev Y Dev Z Test X Test Y Test Z Normal X Normal Y Normal Z A001 -0.284 462.691 750.300 621.976 1.000 0.002 -0.277 -0.060 462.693 750.023 621.917 -0.008 0.978 0.210 A002 0.736 374.632 744.496 516.509 1.000 -0.103 0.729 0.017 374.529 745.225 516.526 -0.139 0.990 0.023 A003 -0.358 491.380 750.611 230.572 1.000 -0.247 -0.259 -0.001 491.133 750.352 230.571 0.691 0.723 0.003 A004 0.227 551.831 724.800 35.153 1.000 0.000 0.227 0.000 551.831 725.027 35.153 0.000 1.000 0.000 A005 2.426 431.049 757.638 51.824 1.000 2.036 1.314 -0.108 433.085 758.953 51.716 0.839 0.542 -0.044 Page 5
- 6. Compare 2D: 2D Comparison 1 Z = 30.0 mm Method: Planar Deviation Whisker Scale: 1.000 Units: mm Page 6
- 7. 2D Comparison Results CSYS: World CSYS Reference Model Sheet Metal_R Test Model Sheet Metal_T Name 2D Comparison 1 Location Z = 30.0 mm No. of Data Points 1851 Units mm Max. Critical 2.0 Max. Nominal 0.1 Min. Nominal -0.1 Min. Critical -2.0 Deviation Max Dev + 1.8 Max Dev - -1.6 Standard Deviation 0.7 Percentage Deviations Deviation Distribution >=Min <Max # Points % -2.0 -1.9 0 0.0 -1.9 -1.8 0 0.0 20.0 18.0 -1.8 -1.7 0 0.0 16.0 -1.7 -1.6 11 0.6 14.0 -1.6 -1.4 18 1.0 12.0 -1.4 -1.3 19 1.0 10.0 -1.3 -1.2 59 3.2 8.0 -1.2 -1.1 97 5.2 6.0 -1.1 -1.0 39 2.1 4.0 2.0 -1.0 -0.9 34 1.8 0.0 -0.9 -0.8 103 5.6 -2.000 -1.200 -0.400 0.400 1.200 2.000 Page 7
- 8. Dimension 2D: Section 1 Units: mm CSYS: World CSYS Name Measured Nominal Dev Status Upper Tol. Lower Tol. D1 6.154 8.021 -1.867 FAIL 0.200 -0.200 D4 118.772 118.548 0.225 FAIL 0.200 -0.200 Page 8
- 9. Name Measured Nominal Dev Status Upper Tol. Lower Tol. D6 8.153 7.985 0.168 PASS 0.200 -0.200 Page 9
- 10. Dimension 3D: Dim View 1 Units: mm CSYS: World CSYS Name Measured Nominal Dev Status Upper Tol. Lower Tol. DWP 1 44.241 0.000 44.241 Page 10
- 11. Compare Features Views: Compare Features View 1 Units: mm CSYS: World CSYS Feature Name Dimension Reference Test Deviation Upper Tol. Lower Tol. Status Plane 1 FAIL Normal 0.340 0.001 FAIL NormalX -0.087 -0.084 0.004 NormalY 0.996 0.996 0.000 Page 11
- 12. Boundaries: Boundary 1 Whisker Scale: 0.500 Units: mm CSYS: World CSYS Name Dev Status Upper Tol. Lower Tol. Ref X Ref Y Ref Z Dev Radius Dev X Dev Y Dev Z Test X Test Y Test Z Normal X Normal Y Normal Z B006 0.909 414.574 755.550 406.281 -0.634 0.140 0.636 413.940 755.690 406.917 -0.698 0.154 0.700 B007 -1.093 457.000 755.550 379.472 0.918 -0.592 0.000 457.918 754.958 379.472 -0.840 0.542 0.000 Page 12