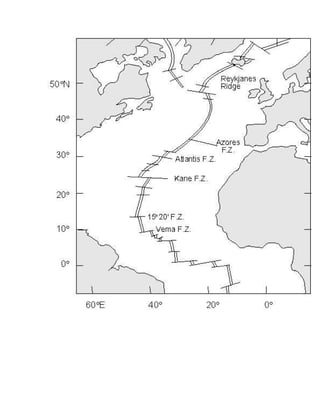
Core sample data mid atlantic ridge for false age data
•Download as DOC, PDF•
0 likes•226 views
Report
Share
Report
Share
Recommended
Kit preparando um indicador ácido
Este documento descreve um experimento simples e de baixo custo para classificar substâncias como ácidas ou básicas usando o extrato do açaí como indicador natural. O procedimento envolve dissolver polpa de açaí em álcool para fazer um extrato que muda de cor quando em contato com ácidos (vermelho) ou bases (verde). A atividade é proposta para ensinar esses conceitos de química em escolas com poucos recursos.
The role of the Knowledge Center in IITA R4D
The document discusses the role of the Knowledge Center at the International Institute of Tropical Agriculture (IITA). The Knowledge Center supports IITA's mission by ensuring scientists have access to needed information, managing knowledge resources, and disseminating research outputs. It provides access to resources like Scopus, ScienceDirect, Springer, CABDirect, and maintains the IITA bibliography and photo collection. Services include reference, circulation, technical services, and instruction. The goal is to make the Knowledge Center more prominent in supporting researchers in finding solutions to hunger and poverty problems.
Renascimento
O Renascimento valorizou a cultura greco-romana e o antropocentrismo, substituindo o teocentrismo da Idade Média. A razão e a natureza foram valorizadas, com o uso de métodos experimentais e observação. Grandes artistas como Michelangelo, Rafael, Donatello e Leonardo da Vinci marcaram a época, enquanto Copérnico e Galileu revolucionaram a ciência com o heliocentrismo. A invenção da prensa móvel por Gutemberg também influenciou o período.
1.o marco do descobrimento
1) O documento descreve a evolução da sociedade humana desde tribos gregárias até a colonização européia e a ideia de superioridade branca;
2) É mencionada a transição da sociedade feudal para o capitalismo e a importância da salvação cristã;
3) Há perguntas reflexivas sobre o poder, a exploração ao longo da história e a perspectiva dos vencedores na narrativa histórica.
3º intermunicipal de oriente – taça marcelo xavier
This document summarizes the results of games from the 3rd Intermunicipal Tournament of Orient - Taça Marcelo Xavier across 8 brackets (A-H). It provides the dates and scores of matches between various soccer teams representing different municipalities.
Divisao 2.0 global
Este documento descreve o Programa de Divisão de Lucros 2.0 da Forever, incluindo os requisitos para três níveis de qualificação. Os empreendedores devem gerar um mínimo de caixas créditos pessoais e patrocinar novos empreendedores. Eles também precisam desenvolver gerentes qualificados em suas linhas descendentes. Os lucros totais serão divididos entre os qualificados dos três níveis com base no volume total de caixas créditos gerados.
Distance vs time chart with questions 2
The document shows the distance traveled by 3 students over a period of 10 seconds. Student 3 traveled the farthest distance of 40 units, indicating they won the race. Student 3 exhibited a constant speed of 4 units per second, while Student 1 had the slowest average speed of 1 unit per second and Student 2 the fastest average speed of 2 units per second.
10.1 reinf ditstance_time%20_graph
Sasha, Kim, and Barry participated in a 10-km bicycle race that was tracked using a time-distance graph. The graph shows each cyclist's distance over time and will be used to determine each rider's total time and average speed to complete the race, identify who finished in each placing, and analyze their speeds over the course of the race.
Motion diagrams, data charts, graphs
Here are the steps I would take to get the two vehicles to meet at the center of the room at the same time when released from opposite sides:
1. My goal is to have the two vehicles meet at the center of the room at the same time.
2. To accomplish this, I need to determine the speed each vehicle needs to travel. I will collect distance and time data for test runs of each vehicle and create a graph to determine their speeds.
3. The distance from each starting point to the center and the time it takes each vehicle to travel that distance is vital data. With this information, I can calculate the speed of each vehicle and adjust their speeds so that they meet at the center at the same
Motion diagrams, data charts, graphs
Here are the steps I would take to get the two vehicles to meet at the center of the room at the same time when released from opposite sides:
1. My goal is to have the two vehicles meet at the center of the room at the same time.
2. To accomplish this, I need to determine the speed each vehicle needs to travel. I will collect distance and time data for test runs of each vehicle and graph it to determine the speed.
3. The data that is vital is the distance traveled over time for each vehicle. This will allow me to calculate the speed and determine the speeds needed for the vehicles to meet in the center.
4. I will then calculate the time needed for each vehicle
Motion diagrams, data charts, graphs
Here are the steps I would take to get the two vehicles to meet at the center of the room at the same time when released from opposite sides:
1. My goal is to have the two vehicles meet at the center of the room at the same time.
2. To accomplish this, I need to determine the speed each vehicle needs to travel. I will collect distance and time data for test runs of each vehicle and create a graph to determine their speeds.
3. The distance from each starting point to the center and the time it takes each vehicle to travel that distance is vital data. With this information, I can calculate the speed of each vehicle and adjust their speeds so that they meet at the center at the same
Motion diagrams
This document provides instructions to analyze motion diagrams and describe the type of motion shown. Students are asked to observe motion diagrams showing objects moving over time intervals, highlight and label different types of motion shown, and create a single diagram demonstrating 4 different kinds of labeled motion using no more than 10 dots.
Motion diagrams
This document provides instructions to analyze motion diagrams and describe the type of motion shown. Students are asked to observe motion diagrams showing objects moving over time intervals represented by circles. For diagrams showing multiple types of motion, students must highlight and label each different kind. Finally, students are asked to create a single diagram using 10 dots or less that combines all 4 types of motion, labeling each one.
Perspective written report
A) From the man's perspective, the box would appear stationary as he holds it on his lap on the moving bus.
B) From the fly's perspective sitting on the box, the box would appear to move smoothly along with the vibrations of the bus.
C) From the bus driver's perspective, the box held by the passenger would appear to move back and forth within the bus as it drives along the road.
Process skills quiz 12 13
Mr. C conducted an experiment to determine how water temperature affects the survival rate of young yellow perch fish. He placed 50 fish in each of 4 tanks containing 25 gallons of water. The temperature between each tank was varied by 2 degrees. Mr. C also provided 5 grams of fish food every other day for 4 weeks. The dependent variable was the survival of yellow perch.
Parents and students first day homework
Mrs. Lori Welsh is starting her 18th year teaching science at Pleasant View Middle School and uses her blog, www.mrswelsh.blogspot.com, to communicate class activities and homework assignments. For homework, students are to log onto the blog, answer questions 1-6 on the "Room 121" page about what to expect in her class, summarize each answer in one sentence, and have a parent read and sign the assignment. The parent signature also indicates awareness of the teacher's blog and email contact information.
Student directions for poster lab
This document outlines an activity where students are assigned to scientific specialties and tectonic plates to analyze maps of plate boundary data and develop classification schemes. Students first work in specialty groups to identify boundary types based on their map data, then come together in plate groups to integrate all data types and create a combined classification system. Presentations and discussion allow the groups to compare their findings and place them within the accepted framework of plate boundary processes. The goal is for students to make observations, compare data sets, and develop their own understanding of plate tectonics.
Plate tectonic activity with maps
1) Earthquakes regularly occur at plate boundaries in the oceans, such as at subduction zones where one tectonic plate slides under another.
2) Major earthquakes can generate destructive tsunamis by displacing large volumes of water very quickly. These tsunami waves travel across the ocean and grow in height as they reach shorelines.
3) Studying areas like the Nankai Trough off Japan, where great earthquakes repeatedly occur, can provide insights into why and how these quakes happen, and help determine zones that may rupture in future events.
Lab for plate boundaries
The document describes a lab activity where students are assigned to scientific specialty groups focusing on seismology, volcanology, geography, or geochronology. Using map data related to their specialty, students observe patterns to infer locations of possible plate boundaries on a world map. They then classify the inferred boundaries into types based on characteristics. Later, students from each specialty discuss their interpretations and reconcile differences to create a consensus map. Finally, they learn about currently recognized plate boundary types from an instructor presentation and formally classify boundaries on the map.
Plate tectonic activity with maps
1) Earthquakes regularly occur at plate boundaries in the oceans, such as at subduction zones where one tectonic plate slides under another.
2) Major earthquakes can generate destructive tsunamis by displacing large volumes of water very quickly. These tsunami waves travel across the ocean and grow in height as they reach shorelines.
3) Studying areas like the Nankai Trough off Japan, where great earthquakes repeatedly occur, can provide insights into why and how these quakes happen, and help determine areas at risk for future seismic events.
Lab for plate boundaries
The document describes a lab activity where students are assigned to scientific specialty groups focusing on seismology, volcanology, geography, or geochronology. Using map data related to their specialty, students observe patterns to infer locations of possible plate boundaries on a world map. They then classify the inferred boundaries into types based on characteristics. Later, students from each specialty discuss their interpretations and reconcile differences to create a consensus map. Finally, they learn about currently recognized plate boundary types from an instructor presentation and formally classify boundaries on the map.
More Related Content
More from Lori Welsh
Motion diagrams, data charts, graphs
Here are the steps I would take to get the two vehicles to meet at the center of the room at the same time when released from opposite sides:
1. My goal is to have the two vehicles meet at the center of the room at the same time.
2. To accomplish this, I need to determine the speed each vehicle needs to travel. I will collect distance and time data for test runs of each vehicle and create a graph to determine their speeds.
3. The distance from each starting point to the center and the time it takes each vehicle to travel that distance is vital data. With this information, I can calculate the speed of each vehicle and adjust their speeds so that they meet at the center at the same
Motion diagrams, data charts, graphs
Here are the steps I would take to get the two vehicles to meet at the center of the room at the same time when released from opposite sides:
1. My goal is to have the two vehicles meet at the center of the room at the same time.
2. To accomplish this, I need to determine the speed each vehicle needs to travel. I will collect distance and time data for test runs of each vehicle and graph it to determine the speed.
3. The data that is vital is the distance traveled over time for each vehicle. This will allow me to calculate the speed and determine the speeds needed for the vehicles to meet in the center.
4. I will then calculate the time needed for each vehicle
Motion diagrams, data charts, graphs
Here are the steps I would take to get the two vehicles to meet at the center of the room at the same time when released from opposite sides:
1. My goal is to have the two vehicles meet at the center of the room at the same time.
2. To accomplish this, I need to determine the speed each vehicle needs to travel. I will collect distance and time data for test runs of each vehicle and create a graph to determine their speeds.
3. The distance from each starting point to the center and the time it takes each vehicle to travel that distance is vital data. With this information, I can calculate the speed of each vehicle and adjust their speeds so that they meet at the center at the same
Motion diagrams
This document provides instructions to analyze motion diagrams and describe the type of motion shown. Students are asked to observe motion diagrams showing objects moving over time intervals, highlight and label different types of motion shown, and create a single diagram demonstrating 4 different kinds of labeled motion using no more than 10 dots.
Motion diagrams
This document provides instructions to analyze motion diagrams and describe the type of motion shown. Students are asked to observe motion diagrams showing objects moving over time intervals represented by circles. For diagrams showing multiple types of motion, students must highlight and label each different kind. Finally, students are asked to create a single diagram using 10 dots or less that combines all 4 types of motion, labeling each one.
Perspective written report
A) From the man's perspective, the box would appear stationary as he holds it on his lap on the moving bus.
B) From the fly's perspective sitting on the box, the box would appear to move smoothly along with the vibrations of the bus.
C) From the bus driver's perspective, the box held by the passenger would appear to move back and forth within the bus as it drives along the road.
Process skills quiz 12 13
Mr. C conducted an experiment to determine how water temperature affects the survival rate of young yellow perch fish. He placed 50 fish in each of 4 tanks containing 25 gallons of water. The temperature between each tank was varied by 2 degrees. Mr. C also provided 5 grams of fish food every other day for 4 weeks. The dependent variable was the survival of yellow perch.
Parents and students first day homework
Mrs. Lori Welsh is starting her 18th year teaching science at Pleasant View Middle School and uses her blog, www.mrswelsh.blogspot.com, to communicate class activities and homework assignments. For homework, students are to log onto the blog, answer questions 1-6 on the "Room 121" page about what to expect in her class, summarize each answer in one sentence, and have a parent read and sign the assignment. The parent signature also indicates awareness of the teacher's blog and email contact information.
Student directions for poster lab
This document outlines an activity where students are assigned to scientific specialties and tectonic plates to analyze maps of plate boundary data and develop classification schemes. Students first work in specialty groups to identify boundary types based on their map data, then come together in plate groups to integrate all data types and create a combined classification system. Presentations and discussion allow the groups to compare their findings and place them within the accepted framework of plate boundary processes. The goal is for students to make observations, compare data sets, and develop their own understanding of plate tectonics.
Plate tectonic activity with maps
1) Earthquakes regularly occur at plate boundaries in the oceans, such as at subduction zones where one tectonic plate slides under another.
2) Major earthquakes can generate destructive tsunamis by displacing large volumes of water very quickly. These tsunami waves travel across the ocean and grow in height as they reach shorelines.
3) Studying areas like the Nankai Trough off Japan, where great earthquakes repeatedly occur, can provide insights into why and how these quakes happen, and help determine zones that may rupture in future events.
Lab for plate boundaries
The document describes a lab activity where students are assigned to scientific specialty groups focusing on seismology, volcanology, geography, or geochronology. Using map data related to their specialty, students observe patterns to infer locations of possible plate boundaries on a world map. They then classify the inferred boundaries into types based on characteristics. Later, students from each specialty discuss their interpretations and reconcile differences to create a consensus map. Finally, they learn about currently recognized plate boundary types from an instructor presentation and formally classify boundaries on the map.
Plate tectonic activity with maps
1) Earthquakes regularly occur at plate boundaries in the oceans, such as at subduction zones where one tectonic plate slides under another.
2) Major earthquakes can generate destructive tsunamis by displacing large volumes of water very quickly. These tsunami waves travel across the ocean and grow in height as they reach shorelines.
3) Studying areas like the Nankai Trough off Japan, where great earthquakes repeatedly occur, can provide insights into why and how these quakes happen, and help determine areas at risk for future seismic events.
Lab for plate boundaries
The document describes a lab activity where students are assigned to scientific specialty groups focusing on seismology, volcanology, geography, or geochronology. Using map data related to their specialty, students observe patterns to infer locations of possible plate boundaries on a world map. They then classify the inferred boundaries into types based on characteristics. Later, students from each specialty discuss their interpretations and reconcile differences to create a consensus map. Finally, they learn about currently recognized plate boundary types from an instructor presentation and formally classify boundaries on the map.