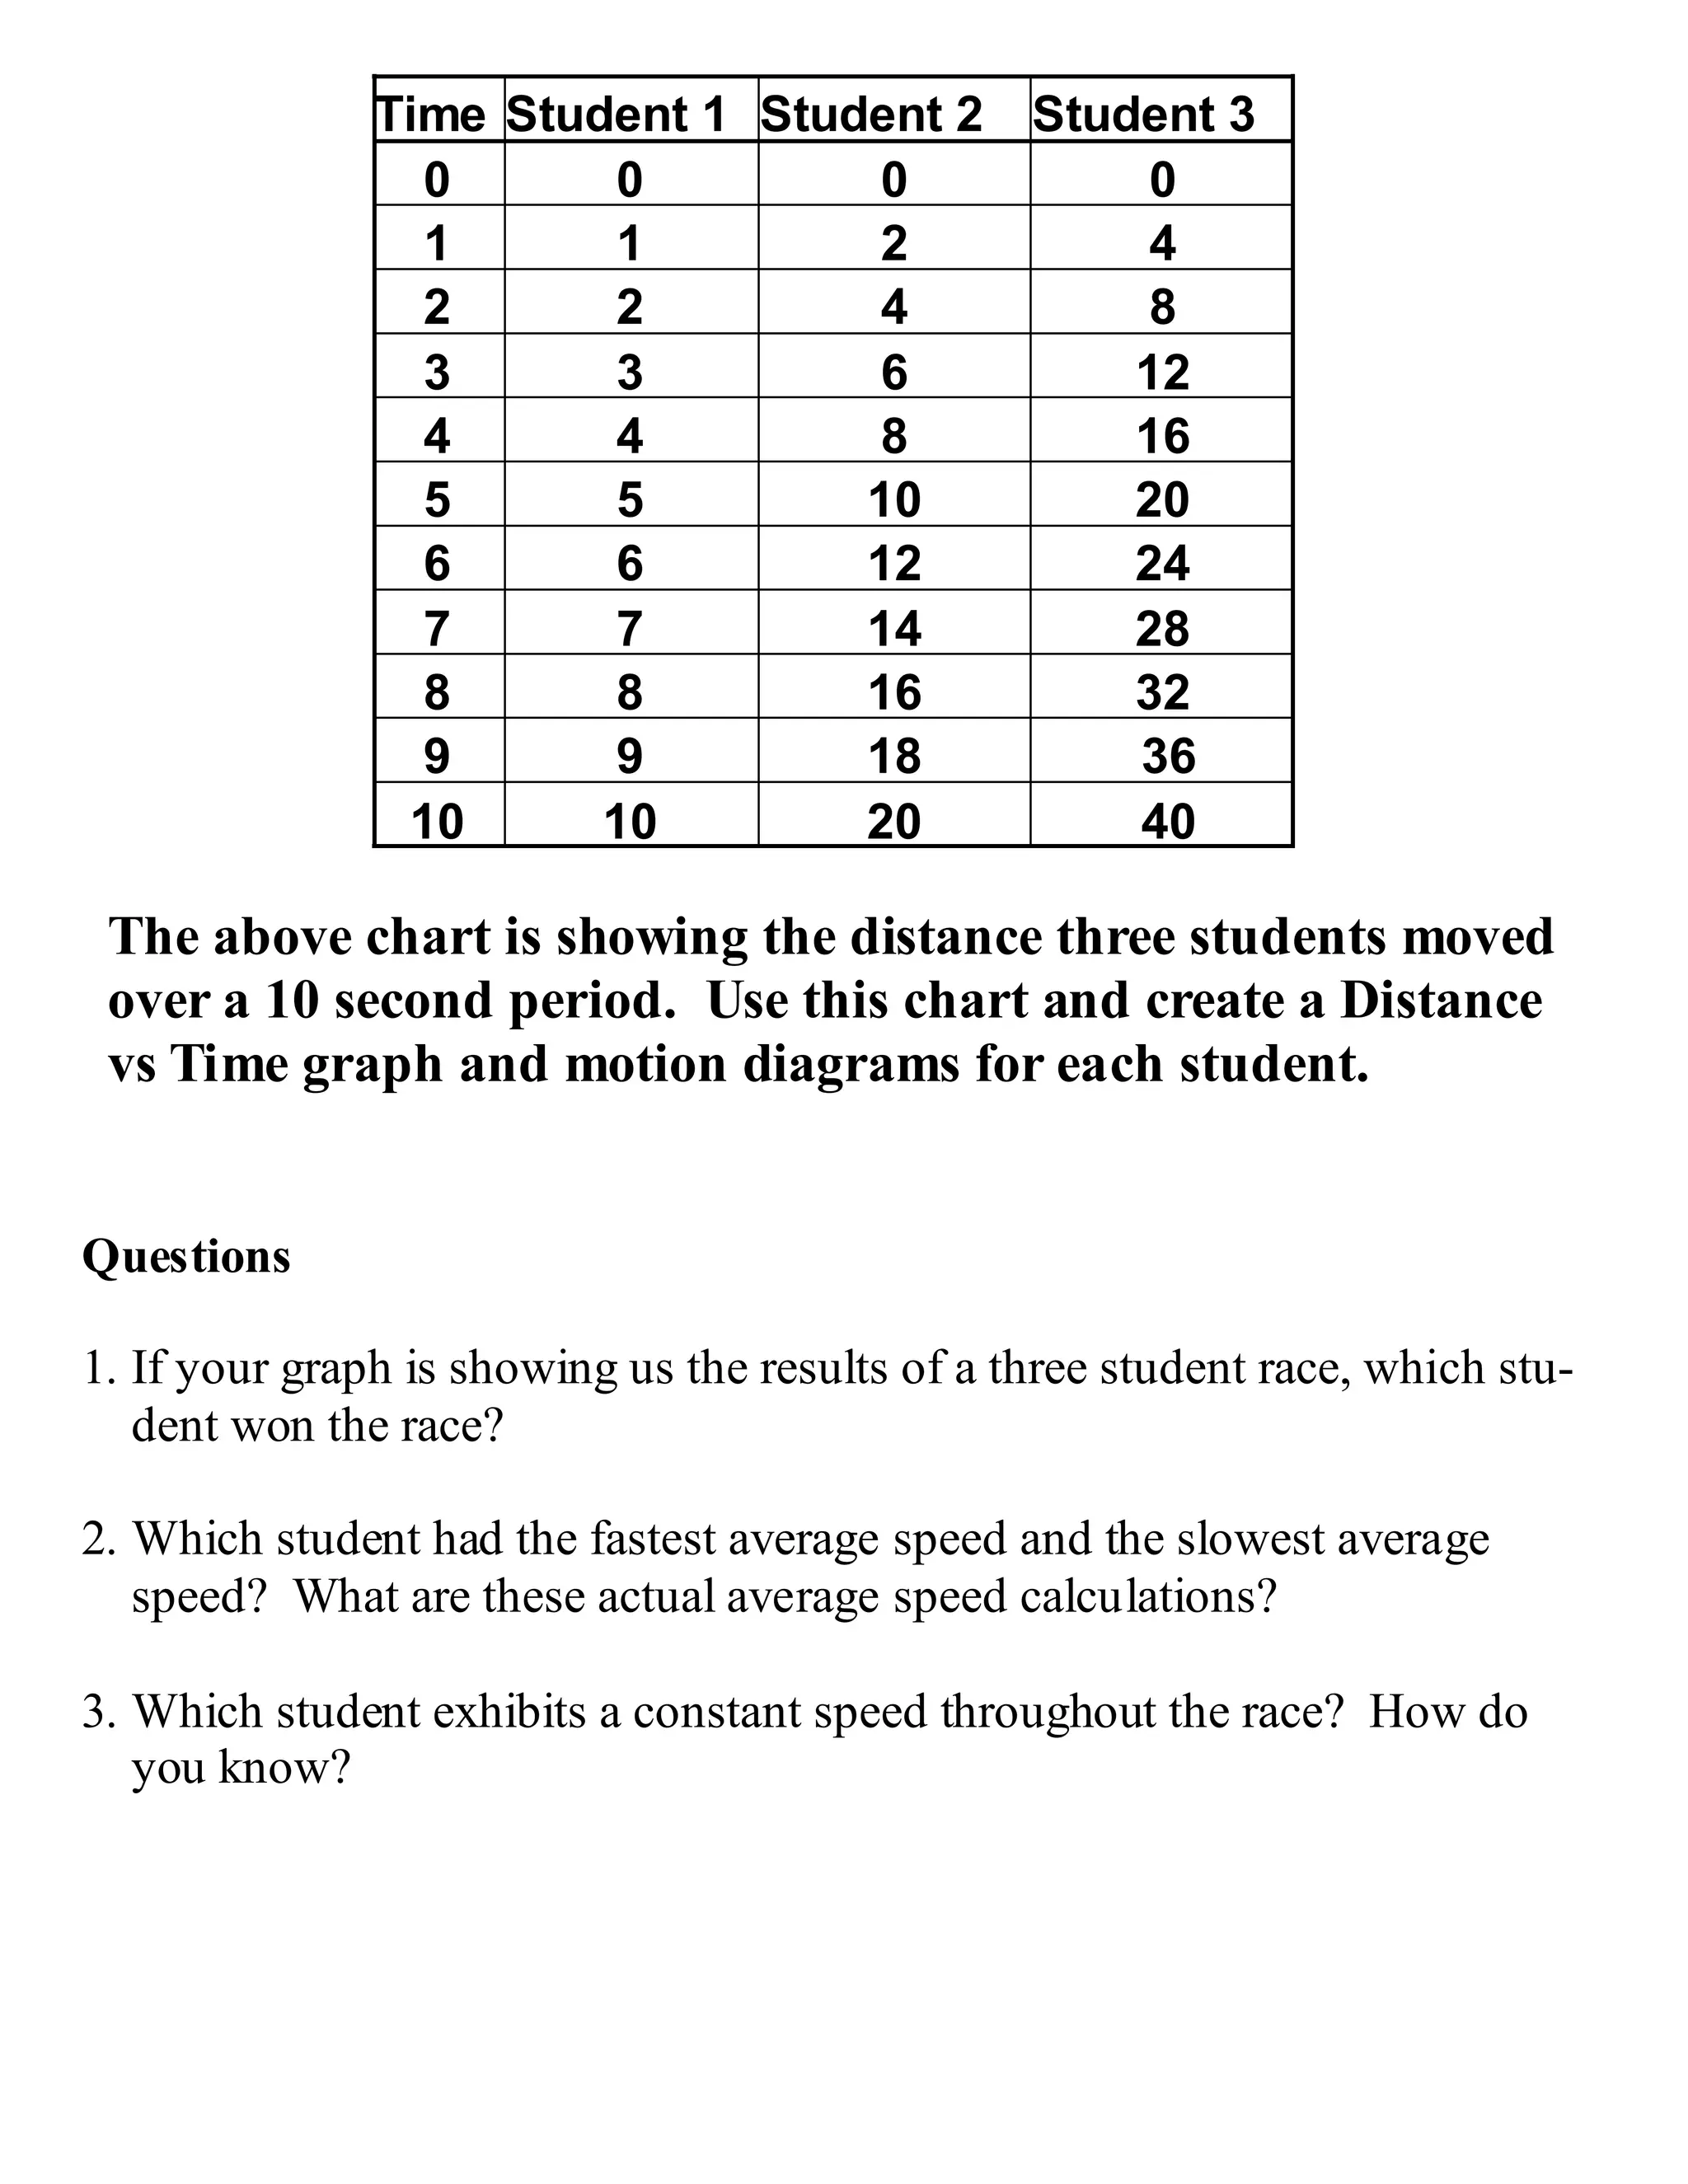
The document shows the distance traveled by 3 students over a period of 10 seconds. Student 3 traveled the farthest distance of 40 units, indicating they won the race. Student 3 exhibited a constant speed of 4 units per second, while Student 1 had the slowest average speed of 1 unit per second and Student 2 the fastest average speed of 2 units per second.