Download to read offline
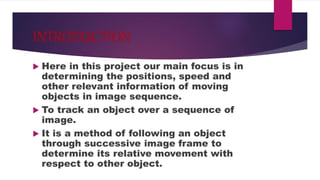
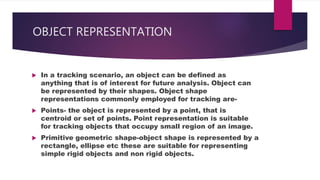
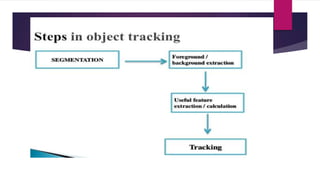
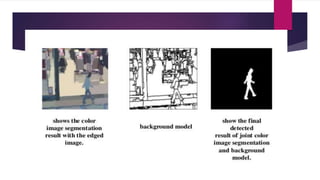
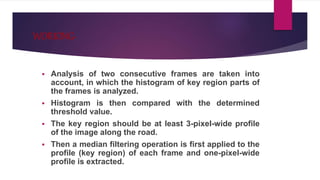
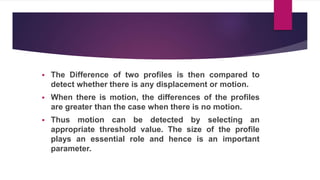
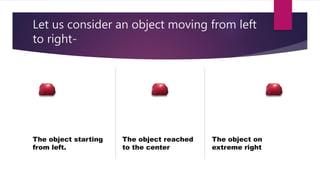
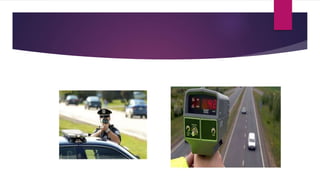
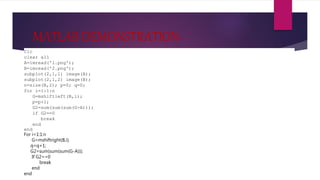
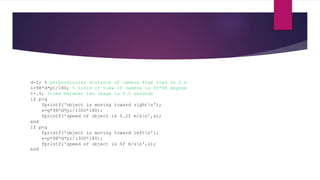
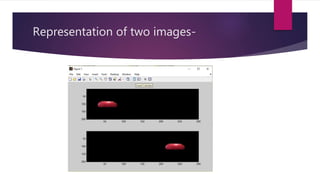

This document describes a project to analyze motion using image processing. It discusses representing objects as points or shapes, working by analyzing histograms of key regions in consecutive frames to detect motion based on profile differences, and applications like radar tracking and speed enforcement. MATLAB code is provided to demonstrate comparing two images, shifting one left and right to find displacement, and calculate speed.