This document summarizes an experiment that evaluated the efficiency of three search strategies for autonomous rendezvous in space: random, semi-autonomous, and autonomous. The experiment used LEGO robots to simulate a space tug searching for a target in a two-dimensional space, and measured the time and energy required for each strategy. It was found that the semi-autonomous strategy was most energy efficient but most time-consuming, while the autonomous strategy proved most suitable for space applications by being both reasonably energy efficient and faster. The results provide insight into optimal search algorithms for an actual space tug vehicle to implement during rendezvous and docking.
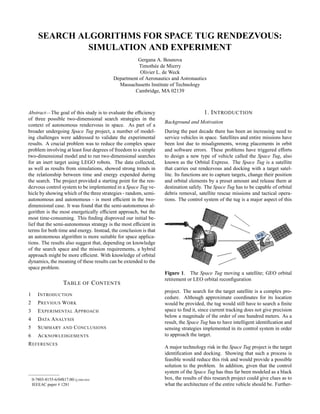
![more, successful search and rendezvous strategies could be
used in other aeronautical applications, such as autonomous
and formation flight.
Search strategies and algorithms for robots have been studied
extensively in the past years. As a result, the design part of
this project was influenced by previous work done on search
algorithms, notably by the MIT Department of Electrical En-
gineering and Computer Science. The basic strategies were
enhanced to fit the purpose of the Space Tug. Time and en-
ergy consumption, as well as the successful implementation
of three searching strategies, are the focus of this research en-
deavor. The search strategies tested are: (1) random sensor-
less search, (2) semi-autonomous with a human in the loop
search and (3) fully autonomous search with sensors. Those
were chosen to be general enough (representative of family
of algorithms), yet tailored to our purposes. At the onset, it
was expected that the semi-autonomous with a human in the
loop search will be the relatively most efficient approach.
Hypothesis
The use of a semi-autonomous search system with a human
in the loop is the algorithm that is the most effective for ren-
dezvous and docking strategies in terms of time and energy
consumption.
2. PREVIOUS WORK
We looked at several references devoted to Mars rovers due
to the similar autonomy and energy requirements and con-
straints of their missions.
Literature Review
Morrison and Nguyen [1] describe the software used to con-
trol the motion of the rover on Mars. The constraints, in terms
of communication and energy, on the control system of the
Mars rover are similar to what the tug will face in space. Due
to electrical and processing power limitations, the control sys-
tem of the rover is unable to communicate and move at the
same time. In addition, due the transmit delay from Mars to
Earth and back, the control system of the rover uses waypoint
navigation and autonomous collision avoidance algorithms.
In the absence of any obstacles, the rover proceeds directly
forward to the waypoint, including stops for proximity scan-
ning - for hazard detection. During proximity scanning pro-
cesses, the rover uses its on-board optical sensors to generate
an approximate map of the terrain map in front of the vehicle.
Based on height differences in the map, the navigation system
analyzes the possible locations of obstacles.
An alternate working mode of the control system is the ”rock
finding” option, which uses the terrain map to detect a rock.
The navigation system corrects the rover heading, centering it
between the rock edges. This feature together with an adapted
version of the collision-avoidance rover control system can be
used as a basis for the tug control architecture.
Search algorithms are thoroughly explored in computer sci-
ence. Gelenbe’s paper [2] provides an example of the ”com-
puter science” point of view. The author models the au-
tonomous process in which an agent, a robot or a software
algorithm searching for information in a computer database,
searches the space around its current location for desired in-
formation. The search area is divided in a set of locations
(x, y), defined in Cartesian coordinates. Associated with each
location is a probability q(x, y) representing the likelihood
of finding the information wanted at this location. Assuming
the environment is static, the space can thus be described as
a probability space. The agent, which in the context of this
project is the tug, always moves in the direction where the
probability q(x, y) is the greatest. Once the agent moves to
the new location - from (x0, y0) to (xnew, ynew) -, the prob-
ability q(xnew, ynew) of finding information at the new point
is updated depending on what was found.
The algorithm thus continuously updates the probability
space, until the agent finds the right information - the target
for the tug. The mathematical tools used in the greedy algo-
rithm were applied to the tug’s autonomous search strategy,
since the underlying probabilistic decision-making processes
are similar (e.g. the agent goes to the location with the great-
est probability in the space). The modeling process used by
Gelenbe in his experiment is also useful in developing the
model of the search space for the tug. In addition, the agent
is also able to build a map of the environment revealing the
exact location of the information with greater precision. Ge-
lenbe’s paper only discusses this simple strategy and does not
consider sensor range effects on the search efficiency.
Another important aspect of rendezvous is target identifica-
tion. Hillenbrand and Hirzinger [3] discuss object recognition
as a two-part process. First, a sequence of hypotheses about
the object - its location, geometric shape, and movements - is
generated, using exterior sensors. The second part of the pro-
cess evaluates these hypotheses based on the object model.
This paper describes a new technique for object recognition
in a specific scene in a probabilistic framework. It also intro-
duces a new statistical criterion - the truncated object proba-
bility - to produce optimal hypotheses about the object to be
evaluated for its match to the data collected by sensors. The
author further develops a mathematical model to fit the search
sequence in the experiment. The object recognition technique
developed by Hillenbrand and Hirzinger is beyond the scope
of the Space Tug project. However, some of their concepts
are useful for the autonomous search strategy model.
Another Mars Pathfinder mission deals with crater and rock
hazard modeling for Mars landing [4]. Measures for safe
landing on the rough and hazardous terrain of Mars are de-
scribed. The investigation examines simple models of crater
size-frequency distribution, rock size-frequency distribution
and scaling relationships to determine the hazard probabil-
ities and choose landing terrains. The approach to hazard
modeling and navigation generated a useful idea. A search of
satellite sizes and geometries was performed in order to scale](https://image.slidesharecdn.com/11585d56-03df-44b8-8cbb-9111d8dd45a9-160503094112/85/Space-Tug-Rendezvous-2-320.jpg)
![the search space for the experimental setup [7]. For example,
a 100-meter radius in space with a 2-meter long target trans-
lates to a 5-meter experimental radius with a 10-centimeter
robot target. This determines the grid size to search space
diameter ratio which impacts the choice of search strate-
gies. Thus, the Pathfinder rock-frequency distribution model
helped focus the search space domain while retaining the va-
lidity of the experiment.
The previous stidues analyzed above show that the field of
search algorithms is heavily explored. At the same time, the
lack of an exact match to the problem at hand demonstrates
that the Space Tug application has not been modeled thor-
oughly before but that one can gain by utilizing technologies
from other domains.
Applicable Theory
The application of this experiment depends on the extendabil-
ity of the obtained results. This demands proper reduction of
the three-dimensional space problem to the two-dimensional
grid search experiment. The main difference between reality
and the model experiment is the number of degrees of free-
dom. All results obtained in this Space Tug experiment are
valid only for target search in two dimensions. In order to
make a conclusion, it is necessary to either find a reasonable
reduction of the space problem to 2D or extend the meaning
of the experimental results to three dimensions. In this case
applicable knowledge of orbital dynamics makes the first ap-
proach feasible and more suitable. In particular, assuming the
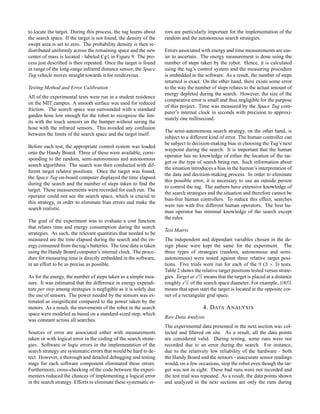
Figure 2. The Hill’s Orbit: Views from central body per-
spective and orbiting bodies frame.
tug spacecraft is within a short distance of the target satel-
lite, their relative dynamics can be described using the Hill’s
frame. This means that with some approximation it can be
assumed that the target is in circular orbit around the tug (or
vice versa).
Figure 2 illustrates the two spacecraft relative positions. The
left drawing in the figure depicts a service vehicle and its tar-
get satellite orbiting the Earth assuming that their orbits are
in the same plane but with different eccentricities1
. The right
drawing looks at the same three-body problem but from the
1Usually, it is assumed that the two bodies are on the same orbits, with
similar radii, eccentricities and inclinations, while only the true anomalies
differ.
point of view of the service vehicle (at the center of the el-
lipse). In its reference frame, the target appears to be in el-
liptic orbit around it while performing its motion around the
Earth.
This shows that the Hill’s relative frame allows the reduction
of the 3D model to two dimensions. To adapt the experiment
to this model, the target has to be designed such that it will
move in a circle at the edge of a circular search space, thus
making the strategies implemented in 2D valid for the space
problem.
3. EXPERIMENTAL APPROACH
Experimental Overview
The experiment’s main objective is to simulate the Space
Tug’s rendezvous with its target in a simplified two-
dimensional environment. The space in which the real Space
Tug contains several degrees of freedom and is too compli-
cated to reproduce in two dimensions. As a result, important
modeling assumptions were made. The simulation makes use
of the relative positions of the Space Tug and the target. The
satellites are assumed to be in the same orbital plane relative
to Earth. The target appears to be orbiting the service vehi-
cle on an elliptic orbit, but for modeling simplicity in 2D, the
experiment was performed with a stationary target.
The experiment makes use of floor space for the search area,
whose dimensions represent the appropriate ratio of search
area to tug/target sizes. This ratio was calculated using the
real sizes of these vehicles and the space around the target
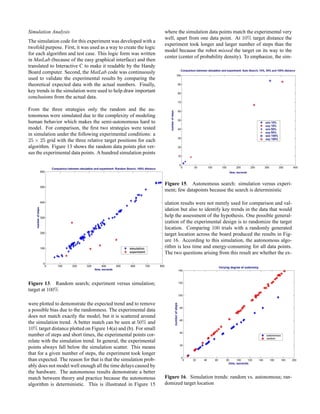
created by position uncertainties. The experimental set up is
shown in Figure 3. The Space Tug computer has to search
Figure 3. Test-bed environment for Tug/Target rendezvous
simulation
through the space for the target, using its sensors. It is under-
stood that the sensors ranges are much smaller than the size of
the search space. Furthermore, in the case of the human-in-
the-loop search strategy, a computer is used to transmit com-
mands to the robot using a serial communication system, in
accordance with the sensor data that the Space Tug computer](https://image.slidesharecdn.com/11585d56-03df-44b8-8cbb-9111d8dd45a9-160503094112/85/Space-Tug-Rendezvous-3-320.jpg)
![sends to the human. For the other two search strategies, the
computer is used only to download the control system that
moves the robot and the decision-making software that tells it
where to go. The Space Tug is made with LEGO Mindstorms,
using an on-board computer, and the target is a 10 × 20-
centimeter box. While the target is non-cooperative and inert,
the Space Tug carries, as mentioned previously, a collection
of on-board sensors, including long and short-range infrared
distance sensors and touch sensors. The first two collect data
about the position of the target, while the last one stops the
vehicle from going out of the search space.
The independent measuring equipment shown in Figure 3 is
used to record the time it takes for the Space Tug to find its tar-
get and the energy consumed during the process. Using this
data, the trade-off (in the form of a cost function) between
time and energy can be evaluated, and the effectiveness of
each strategy can be compared in order to assess the hypoth-
esis of the experiment.
Design of Search Space
The size of the search space is an important aspect of the ex-
periment setup. It has to match the relative sizes of the satel-
lites in space. To calculate the size of the test search space,
some information such as global position system (GPS) ac-
curacy, satellite sizes and sensor ranges was collected. In the
US Army Corps of Engineers manual [6], GPS accuracy is re-
ported as approximately 100 meters. Once the target satellite
has been located, the space which the Space Tug has to search
was assumed to be of radius 100 meters, centered at the ex-
pected location of the target. A database of satellite sizes was
searched and compared to the 100-meter search radius [7].
It turns out that the average satellite geometry is 2x2x2 me-
ters which gives a 50:1 length scale with respect to the search
space radius. The space transformation process is shown in
Figure 4. As can be seen in the figure, the actual spherical
Figure 4. Search space transformation: orbital geometry
reduced to 2D, 10-m grid
space that the real orbital servicer will have to search is three-
dimensional. However, since the target is not stationary, four
variables are needed to define its position, a length, two an-
gles and time. The space transformation involves going from
four dimensions to only two. As a result, the main modeling
assumption that has to be made is that the Space Tug is ca-
pable of insertion in the same orbit as the target. The space
is then modeled as a two-dimensional problem such that the
tug and the target are in the same orbital plane with respect to
Earth. From Figure 4, it can be seen that, for a target of size
0.1 meters, the size ratio is maintained if the search space is
of radius 5 meters. Since the space is designed to be a square,
the sides of the search space will be 10 meters.
Overview of Hardware
The robot simulating the orbital servicer is made of LEGO
Mindstorms parts. The on-board computer is a hand-held,
battery-powered microcontroller board, called the Handy
Board and developed by MIT. Shown in Figure 5(b), the
Handy Board is based on the Motorola 68HC11 micropro-
cessor and includes 32K of battery-backed static Random Ac-
cess Memory (RAM), outputs for four DC motors, inputs for
a wide range of sensors and a 16x2 character Liquid Crystal
Display (LCD) screen [8]. Originally, the experiment was de-
signed to use the LEGO RCX 2.0 on-board computer, shown
in Figure 5(a). However, due to memory constraints on this
computer, the on-board controller had to be changed to the
Handy Board, in order to be able to load the search map nec-
essary for the random and autonomous searches. The func-
tionalities of both computers are very similar, except in terms
of memory and communication. As mentioned earlier, the
Handy Board has more memory than the RCX and thus is
able to handle the search algorithms. While the RCX com-
municates with the command computer through an infrared
interface, the Handy Board uses a standard serial port. Hence,
the communication problem in the semi-autonomous search
tests was solved by tethering the robot to the command com-
puter, which also cut down on communication lags.
The Handy Board runs Interactive C. The latter is a cross-
platform, multi-tasking version of the C programming lan-
guage, which is perfectly adapted to make full use of the con-
troller’s resources. A more detailed description of the soft-
ware can be found in the Overview of Software section.
The Space Tug simulator carries an array of sensors in order
to carry out its search for the target. Added to the standard
touch sensors, the tug possesses two infrared distance sensors
with overlapping ranges, as can be seen in Table 1. The two
Table 1. Operating range for Space Tug sensors
Sensor Long Range Short Range
Upper bound [meters] 0.20 0.04
Lower bound [meters] 1.50 0.30
Resolution [meters] 0.01 0.005
infrared distance sensors are built by Sharp and are shown in
Figure 6. Even though they are essentially the same sensors,
their overlapping ranges provide an appropriate field of view,
so that the target can be detected. The long-range sensor is
used in the semi-autonomous and autonomous searches, but
not in the random search. On the other hand, the short-range
sensor is used in all three searches to detect whether the target
is found or not. Once a value high enough - corresponding to
approximately 10 centimeters - is returned by the short-range
sensor, the search stops and the target is said to be found. The
Sharp sensors are available off the shelf and are fairly reliable.](https://image.slidesharecdn.com/11585d56-03df-44b8-8cbb-9111d8dd45a9-160503094112/85/Space-Tug-Rendezvous-4-320.jpg)
![(a) (b)
(a) (b)
Figure 5. Space Tug robot (parts and picture courtesy of LEGO) (a) and on-board computer (Handyboard courtesy of MIT
course 6.270) (b)
Figure 6. Sharp Infrared Distance sensor, courtesy of
SHARP
They use an infrared beam, coupled with an optical triangle
measuring method which reduces the influence of the reading
on the colors of the reflected objects and their reflectivity [9].
In order to use these sensors with the Handy Board, the con-
troller had to be physically modified. The Sharp sensors do
not work with the Handy Board unless the pull-up resistors
connected to the analog sensor ports are taken out of the loop.
Hence, the Handy Board needs to be rewired. The leads to
the pull-up resistors were cut on analog ports 5, 6 and 7, and
a wire was soldered to close the loop behind these three ports.
The latter modification allows for the use of the analog ports
8 through 16. A disadvantage caused by these hardware mod-
ifications is that it makes the readings from the sensors less
accurate. Furthermore, if the leads to the pull-up resistors
are not cut completely, current spikes in the analog port can
cause flawed sensor readings that can be misinterpreted by
the robot’s control system software.
The third type of sensor used on the tug robot is the touch sen-
sor. There are two touch sensors used on a dynamic bumper
built on the vehicle. These sensors detect any pressure ap-
plied on the bumper arms. When no pressure is applied the
sensor reading is the passive reading on the analog port (255).
Once the robot bumps into an object, the current through the
analog port changes and and the sensor reading decreases
from the rest value of 255.
Overview of Software
The software for this project is developed in two steps. First,
the random and autonomous strategies are coded as Matlab
simulations. The semi-autonomous search cannot be simu-
lated due to the involvement of a human operator. The first
purpose of the simulation is to validate the soundness and
logic of the algorithms. Second, the algorithms are converted
to the C language to be uploaded on the Handy Board com-
puter. The compiler used is Interactive C, developed by New-
ton Labs, and is specially adapted to load programs on the
Handy Board. Interactive C compiles the C code, customized
with special sensor and motor functions to use the computer’s
resources, and loads it onto the board. The Handy Board con-
tains firmware, called the PCode, which then serves as an in-
terpreter for the compiled C code.
The three search strategies are random sensor-less search,
semi-autonomous with a human decision maker search and
fully autonomous with sensors search. The algorithms were
designed to be general enough, so that they span the space of
all different strategies that could be used to find the target.
The random search algorithm is inspired by the ”Greedy Al-
gorithm” described by Gelenbe [2]. It is a probabilistic search
where the agent - the tug in the experiment - is able to learn
as it moves in the space. Each displacement in the space pro-
vides information to the robot. In other words, when the robot
moves to a point and does not find the target, it then knows
that the target is not located at that point. Its knowledge about
the search space has increased. The search space is trans-
formed into a grid that contains a certain number of locations,
as shown in Figure 7. The distance between each point de-
pends on the size of the Space Tug and the size of the target.](https://image.slidesharecdn.com/11585d56-03df-44b8-8cbb-9111d8dd45a9-160503094112/85/Space-Tug-Rendezvous-5-320.jpg)
![Figure 7. Grid for random search: probability as a function
of visited squares
An appropriate separation between two points given that the
tug and target sizes are approximately 20 centimeters would
be of the order of two times the size of the objects, or 40
centimeters. The Space Tug at its starting location has eight
possibilities for its next move. As can be seen in Figure 7, the
probability of going to any of the eight next locations is 1/8.
Once the tug has moved, the probability associated with the
location that the vehicle just left is set to zero. As a result, the
tug has now only seven possibilities for its next move. The
Space Tug computer thus learns about the space as it moves
from point to point. The search ends when the target is found,
which is detected by the short-range infrared distance sensor -
due to its relatively short range, this infrared sensor will only
detect the target once the Space Tug is on the same grid.
The basic concept for the semi-autonomous search is that the
decision-maker is a human controller. Using the on-board
sensors, the human operator moves the Space Tug to find the
target. Figure 8 shows a simplified flowchart for the proce-
dure to be followed during the semi-autonomous search with
human-in-the-loop. At any time, the tug can perform a 360-
degree sweep of the surroundings using the long-range in-
frared distance sensor. If the sensor does not report any pres-
ence of an object, then the human operator has to make a
decision about where to move next. The operator sends a
command to the tug on-board computer, which then moves
the vehicle to the next desired location. All sensor data at
each step is sent back to the human operator, in order to de-
cide the next move in the search. Another decision is made
Figure 8. Flow chart for semi-autonomous search; green -
autonomous decision; red - input by operator
based on the new data, and so on until the target is found. In
order to transmit information, the tug is tethered and waits for
the new command through its serial port. As a result, there is
a lag between the command transmission and the tug’s move.
Although the transmission could be time-consuming, it is a
good simulation of what happens with space transmission.
For instance, as Morrison and Nguyen [1] describe, the Mars
Pathfinder also uses waypoint navigation and delayed trans-
mission to communicate with the Earth operator.
An important consideration for this strategy is human bias. A
human operator has to have no prior knowledge of the initial
conditions on the search space, so that decisions will not be
influenced by that knowledge. Therefore, the operator cannot
see the experiment, but will only read sensor data on the com-
puter. Another part of human bias is the employment of a con-
sistent strategy by a single person. A variety of people should
be invited to conduct the semi-autonomous search in order to
ensure unbiased data. These logistics require prior organiza-
tion, communication with people external to the project and
maybe an additional expense.
The fully autonomous search makes use of the long-range ul-
trasonic sensor to find the target in the test space. The au-
tonomous strategy is based on a probabilistic model, in which
the algorithm develops a probability density function to de-
scribe the search area. Since the Space Tug initially has no
information about the location of the target, the probability
density has to be uniform across the space. As can be seen in
Figure 9. Autonomous search strategy; probability density
is redistributed
Figure 9, the symmetry and the uniformity of the distribution
places the center of mass - labeled ”Cg0” - in the middle of
the two-dimensional search area. At the start of the search se-
quence, the tug travels toward the center of mass of the prob-
ability density distribution to its first waypoint. This location
has to be a point in the search space close enough to the cen-
ter of mass so that the latter is in range of the tug’s long-range
infrared distance sensor. Once at its new location, the vehicle
performs a 360-degree sweep of the surroundings in an effort](https://image.slidesharecdn.com/11585d56-03df-44b8-8cbb-9111d8dd45a9-160503094112/85/Space-Tug-Rendezvous-6-320.jpg)
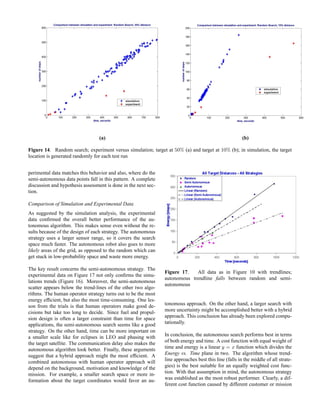
![Table 2. Test matrix: Target position vs. strategy and
number of trials
Pos-Strategy Random Autonomous Semi-
autonomous
Target at 100% I II III
Target at 50% IV V VI
Target at 10% VII VIII IX
which the robot found the target successfully and without any
sensor errors. Table 3 shows the time and energy for the five
trials of the random search runs and Table 4 shows the data
points for the semi-autonomous search. In the latter, each trial
represents a different human operator. Finally, the results of
the deterministic run for the autonomous search is shown in
Table 5. It is difficult to see any trends in the data in ta-
ble form. The data was processed and graphed in order to
observe what is the relationship between time and energy for
each search algorithm. Figure 10 shows all the experimental
data points in the time-energy space. It is already possible to
observe some linear trends, especially with the measurements
from the random search runs.
Figure 10. All search strategies, all experimental data points
Table 3. Random search data
10% Relative Distance
Trial Time [seconds] Energy [steps]
1 429.36 134
2 12.06 3
3 58.11 19
4 25.98 7
5 558.08 165
50% Relative Distance
Trial Time [seconds] Energy [steps]
1 101.56 35
2 47.19 13
3 275.10 96
4 229.31 75
5 981.20 315
100% Relative Distance
Trial Time [seconds] Energy [steps]
1 485.56 156
2 782.17 267
3 143.37 52
4 373.70 119
5 308.31 97
Figure 11. All search strategies: target is at maximum dis-
tance, 100%
An important aspect of the results is to look at the distance
factor in the data. Figures 11, 12(a) and (b) show the re-
sults for all strategies for the 100%, 50% and 10% relative
distance test cases, respectively. In Figure 11, the general
trend of the trade-off between time and energy for each strat-
egy can be seen well. On average, the random search algo-
rithm is the strategy that expands the most energy, while the
semi-autonomous search algorithm is the slowest strategy. It
can also be observed that the autonomous search is more ef-
ficient in terms of both time and energy than the other two
strategies. The same phenomenon can be observed in Fig-
ure 12(a), where the autonomous search algorithm is the most
efficient of all three strategies for the 50% relative distance](https://image.slidesharecdn.com/11585d56-03df-44b8-8cbb-9111d8dd45a9-160503094112/85/Space-Tug-Rendezvous-8-320.jpg)
![(a) (b)
(a) (b)
Figure 12. All search strategies; experimental data: target at 50% (a) and target at 10% (b); not clear if closer target takes less
time and energy to find on average
Table 4. Semi-autonomous search data
10% Relative Distance
Trial Time [seconds] Energy [steps]
1 352.36 81
2 70.55 23
3 49.86 7
4 245.65 75
5 51.13 7
50% Relative Distance
Trial Time [seconds] Energy [steps]
1 245.84 30
2 211.54 28
3 53.88 16
4 150.25 46
5 366.01 45
100% Relative Distance
Trial Time [seconds] Energy [steps]
1 775.52 158
2 1066.1 168
3 776.79 139
4 256.17 43
5 323.99 48
test case. The fact that the efficiency difference between the
autonomous and semi-autonomous searches for this test case
is so flagrant can be explained by the way the autonomous
search works. The autonomous strategy favors the center of
probability space. Since the search space is initially overlayed
with a uniform probability distribution, the center of mass of
the distribution is right where the target has to be in the 50%
relative distance case. The autonomous search always goes
to the center of mass, and hence finds the target extremely
quickly in this test case.
Table 5. Autonomous search data
10% Relative Distance
Trial Time [seconds] Energy [steps]
1 254.90 67
50% Relative Distance
Trial Time [seconds] Energy [steps]
1 33.05 9
100% Relative Distance
Trial Time [seconds] Energy [steps]
1 354.35 93
The experimental results for the 10% relative distance test
case show a slightly different trend. Unlike the other two
cases, as can be seen in Figure 12(b), the semi-autonomous
search is the most efficient strategy, with regards to both time
and energy. The autonomous search in this case does not
perform as well. Again, as mentioned earlier, the reason for
this phenomenon is the way the autonomous search was pro-
grammed. The robot goes very close to the center of the
search space as its first move. Hence, after that first move,
the Space Tug finds itself further away from the target than it
originally was.
Overall, it can be seen that the random search is not efficient
at all compared to the other two strategies. The autonomous
search seems to be most efficient in terms of time and as ef-
ficient as the semi-autonomous strategy in terms of energy
needed. Looking at only experimental data, the hypothesis
is disproved, as the semi-autonomous search algorithm is not
the most efficient. The following section presents the simula-
tion analysis which was used to verify and explain the exper-
imental results.](https://image.slidesharecdn.com/11585d56-03df-44b8-8cbb-9111d8dd45a9-160503094112/85/Space-Tug-Rendezvous-9-320.jpg)
![requirements might incite a different conclusion.
Experiment Validation and Future Work
The primary goal for designing this two-dimensional target
search experiment was to solve a subset of the general Space
Tug problem. The results from this project support one of
the key themes in the servicing vehicle concept - autonomy.
Depending on the mission, the tug can have different degrees
of autonomy which corresponds to the hybrid search concept.
A higher-fidelity experiment can be designed with a greater
level of detail, mission and customer requirements to assess
the same hypothesis for a larger design trade space.
In summary, this project successfully models an important
aspect of the general Space Tug problem by assessing uncer-
tainty and autonomy with a simple scheme. Future work in
this area might involve modifications in both the model and
the experiment design. There are a number of possible ways
to improve the experiment as designed. For example, obtain-
ing more data might give more insight into important trends
and possibly point towards better versions of the strategies
used. Also, randomizing the target location (as done in simu-
lation) will remove some of the bias in the algorithms relative
performance. Furthermore, for higher precision of the data,
metrology on the robot can be implemented to close the con-
trol loop and thus approach better the situation in space.
The experiment design can also be modified in a variety of
ways. For instance, the Hill’s frame scheme can be imple-
mented by designing a target which moves on the edge of a
circular search space. Thus the robot will have to find, track
and phase with the target satellite, which is much closer to
the real scenario in orbit. Another potential arising from the
semi-autonomous data is to develop a separate human factors
experiment which would model decision-making and human
behavior in comparison with automated logic. Together with
all the above, a higher-fidelity simulation will be needed to
precede the spacecraft software and testing programs devel-
opment for the real Space Tug. This would involve not only
modeling the orbital dynamics, but also all hardware effects.
5. SUMMARY AND CONCLUSIONS
In view of the results presented above, the designed experi-
ment was implemented successfully to assess the starting hy-
pothesis. The theory based in simulation was confirmed by
the tests. As expected, the autonomous strategy outperforms
the random, which is the most time and energy inefficient
overall. Moreover, it was found that the semi-autonomous al-
gorithm is the most energetically efficient approach, but the
most time-consuming. This finding disproved our hypoth-
esis which stated that the semi-autonomous strategy is the
most efficient in terms for both time and energy. Instead, we
conclude that an autonomous algorithm is more suitable for
space applications. The results also suggest that, depending
on knowledge of the search space and the mission require-
ments, a hybrid approach might be more efficient.
The successful hypothesis assessment together with our con-
clusions about autonomy make this experiment an important
asset for the general Space Tug project. The analysis of the
results demonstrates a lot of potential for a new phase of mod-
eling and experimentation.
6. ACKNOWLEDGEMENTS
This project would not have seen the light without the sup-
port of the MIT Aero/Astro staff and faculty. The many sug-
gestions made by the technical staff during the oral presen-
tation and team meetings have provided the necessary infor-
mation to make this project report complete. Moreover, the
feedback from the faculty, Professors Edward Greitzer, John
Deyst, Earll Murman and Jennifer Pixley, has been of great
importance in the shaping of this experiment. The authors
would also like to acknowledge Danny Craig and Greg Mark
for their comments and support throughout the project.
The authors also thank the human operators - Victoria Davis,
Carlos Pinedo, Devjit Chakravarti, Danny Craig and Jennifer
Shih - who took time out of their busy schedules to help
us collect the necessary data. Furthermore, the experiment
would not have been possible without a few friends and class-
mates who were there to support and help this team through
its worst times. Their assistance is more than greatly appreci-
ated.
REFERENCES
[1] Morrison, J., Nguyen, T. On-board Software for the
Mars Pathfinder Microrover Proceedings of the Sec-
ond IAA International Conference on Low-Cost Plan-
etary Missions, John Hopkins University Applied
Physics Laboratory, Laurel, Maryland, April 1996,
http://mars.jpl.nasa.gov/MPF/roverctrlnav/publications.
html, NASA public site, Date accessed: 10/5/2002.
[2] Gelenbe, E. Autonomous Search for Information in an
Unknown Environment, M. Klusch, O.M. Shehory, and
G. Weiss (Eds): CIA’99, LNAI 1652, pp. 47−60, 1999,
http://link.springer.de/link/service/series/0558/bibs/165
2/16520047.htm, Lecture Notes in Computer Science
Journal site, Date accessed: 10/4/2002.
[3] Hillenbrand, U., Hirzinger, G., Probabilistic
Search for Object Segmentation and Recog-
nition, Proceedings European Conference on
Computer Vision 2002, Lecture Notes in Com-
puter Science vol. 2352, pp. 791-806, 2002.
http://cogprints.ecs.soton.ac.uk/archive/00002393/,
Cogprints site, Date accessed: 10/6/2002.
[4] Bernard, D., Golombek, M. Crater and Rock Hazard
Modeling for Mars Landing, AIAA Space 2001 Con-
ference and Exposition, Albuquerque, NM Aug. 28 −
30, 2001 AIAA − 2001 − 4697
[5] Diop, Julie Claire, Robotic Vision, Premium
Content Upstream Article, October 2002,](https://image.slidesharecdn.com/11585d56-03df-44b8-8cbb-9111d8dd45a9-160503094112/85/Space-Tug-Rendezvous-12-320.jpg)
![https://www.technologyreview.com/articles/upstream
1002.asp, Technology Review site, Date Accessed:
10/5/2002
[6] ”Chapter 5 - GPS Absolute Positioning Deter-
mination Concepts, Errors, and Accuracies” En-
gineering and Design - NAVSTAR Global Posi-
tioning System Surveying, US Army Corps of
Engineers Engineering Manuals, August 1, 1996,
EM 1110-1-1003. http://www.usace.army.mil/usace-
docs/eng-manuals/em1110-1-1003/, US Army Corps of
Engineers site, Date accessed: 09/30/2002.
[7] Galabova,K., ”Satellite Database”, Space Tug Project
Progress Presentation, summer 2002, source: aero-
astroPublicShareKalina’s DatabaseSatDatabase.ppt,
MIT AeroAstro public domain
[8] The Handyboard Page. http://www.handyboard.com,
Date accessed: 03/02/2003.
[9] Sharp SMA Optoelectron-
ics Distance Measuring sensors.
http://www.sharpsma.com/sma/products/opto/OSD/
distance measuring sensors.htm, Date accessed:
03/06/2003.
Gergana A. Bounova is a Graduate Stu-
dent at the Massachusetts Institute of
Technology, Cambridge, MA. She has a
B.S. degree in Aeronautics and Astro-
nautics and a B.S. degree in Mathemat-
ics also from MIT. Her research interests
are in applied mathematics for appli-
cations in engineering systems design;
complex systems, their robust design and
evolution. Her previous research involves algorithms for ren-
dezvous in space and spacecraft autonomy. She is a student
member of AIAA.
Timoth´ee de Mierry is an Undergradu-
ate Student at the Massachusetts Insti-
tute of Technology, Cambridge, MA. He
is currently completing his fourth year of
a B.S. degree in Aeronautics and Astro-
nautics. His research interests include
control systems, unmanned aerial vehi-
cle supervision, control, trajectory plan-
ning and obstacle avoidance, as well as
the design of complex space systems. He is a student mem-
ber of AIAA and a member and current president of Sigma
Gamma Tau at MIT.
Olivier L. de Weck is a Robert N. Noyce
Assistant Professor of Aeronautics and
Astronautics and Engineering Systems
at the Massachusetts Institute of Tech-
nology, Cambridge, MA. His research
interests include Multidisciplinary De-
sign Optimization (MDO), engineering
systems architecture and aerospace and
automotive product development. He is
the author of many articles in the areas indicated above. Dr.
de Weck obtained an M.S. degree in Aeronautics and Astro-
nautics from MIT in 1999, and a Ph.D. in Aeronautics and
Astronautics also from MIT in 2001. He is a member of
AIAA, SPIE, IEEE, IASTED and the Sigma Xi research soci-
ety. Since 2002 he has been a member of the AIAA Multidis-
ciplinary Design Optimization (MDO) Technical Committee
(TC).](https://image.slidesharecdn.com/11585d56-03df-44b8-8cbb-9111d8dd45a9-160503094112/85/Space-Tug-Rendezvous-13-320.jpg)


![Hi_We_are_Kelompok_1st[1]](https://cdn.slidesharecdn.com/ss_thumbnails/6f9d7d0e-0e46-4754-8e99-2d0c7c5146ca-160428065131-thumbnail.jpg?width=640&height=640&fit=bounds)


