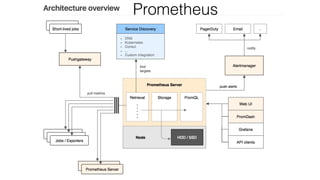
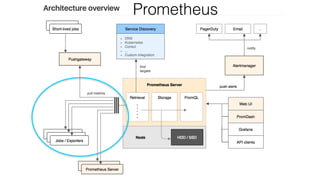
Download as PDF, PPTX


![Data Model
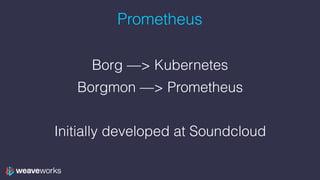
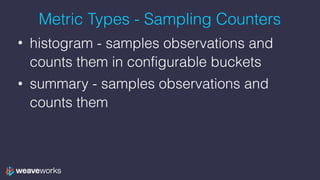
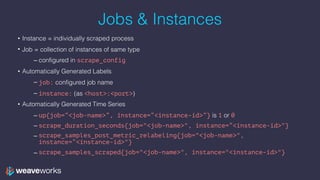
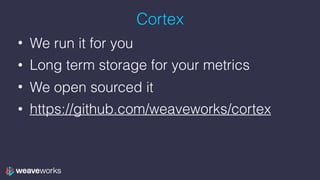
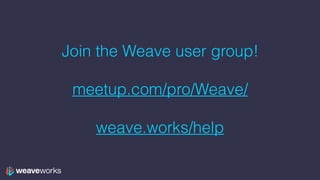
• Prometheus is a labelled time-series database
• Labels are key-value pairs
• A time-series is [(timestamp, value), …]
• lists of timestamp, value tuples
• values are just floats – PromQL lets you make sense of them
• So the data type of Prometheus is
• {key1=A, key2=B} —> [(t0, v0), (t1, v1), …]
• …](https://image.slidesharecdn.com/3-prometheus-training-171016155530/85/Monitoring-your-Application-in-Kubernetes-with-Prometheus-6-320.jpg)
![Data Model
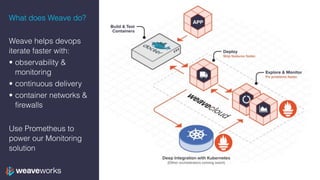
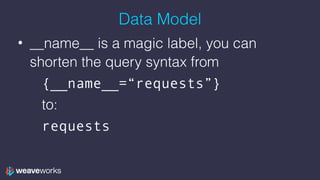
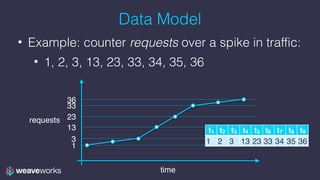
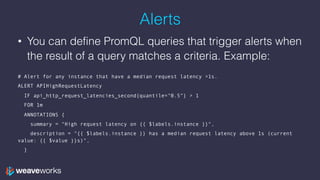
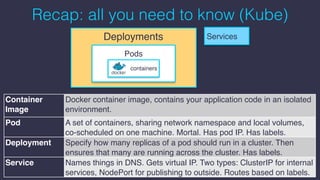
• What Prom is storing
• {__name__=“requests”} —>
[(t1, 1), (t2, 2), (t3, 3), (t4, 13),
(t5, 23), (t6, 33), (t7, 34), (t8, 35),
(t9, 36), (t10, 37)]
or
t1 t2 t3 t4 t5 t6 t7 t8 t9
1 2 3 13 23 33 34 35 36](https://image.slidesharecdn.com/3-prometheus-training-171016155530/85/Monitoring-your-Application-in-Kubernetes-with-Prometheus-12-320.jpg)
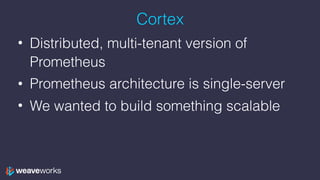
![Data model & PromQL
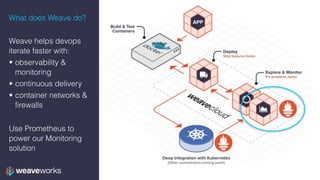
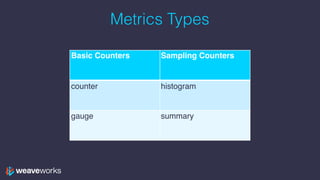
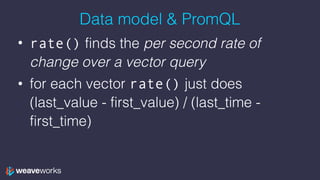
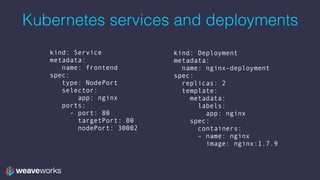
• the [P] (period) syntax after a label turns
an instant type into a vector type
• for each value, turn the value into a vector
of all the values before and including that
value for the last period P
• Example P: 5s, 1m, 2h…](https://image.slidesharecdn.com/3-prometheus-training-171016155530/85/Monitoring-your-Application-in-Kubernetes-with-Prometheus-13-320.jpg)
![Data model & PromQL
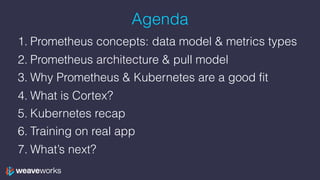
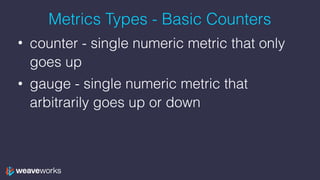
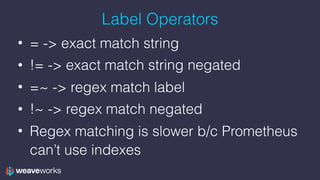
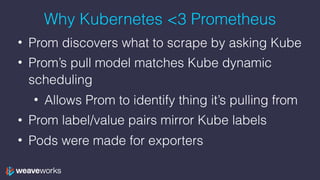
• Recall our time-series requests
• What is requests[3s]? Vector query:
t1 t2 t3 t4 t5 t6 t7 t8 t9
1 2 3 13 23 33 34 35 36
t1-3 t2-4 t3-5 t4-6 t5-7 t6-8 t7-9
1
2
3](https://image.slidesharecdn.com/3-prometheus-training-171016155530/85/Monitoring-your-Application-in-Kubernetes-with-Prometheus-14-320.jpg)
![Data model & PromQL
• Recall our time-series requests
• What is requests[3s]? Vector query:
t1 t2 t3 t4 t5 t6 t7 t8 t9
1 2 3 13 23 33 34 35 36
t1-3 t2-4 t3-5 t4-6 t5-7 t6-8 t7-9
1 2
2 3
3 13](https://image.slidesharecdn.com/3-prometheus-training-171016155530/85/Monitoring-your-Application-in-Kubernetes-with-Prometheus-15-320.jpg)
![Data model & PromQL
• Recall our time-series requests
• What is requests[3s]? Vector query:
t1 t2 t3 t4 t5 t6 t7 t8 t9
1 2 3 13 23 33 34 35 36
t1-3 t2-4 t3-5 t4-6 t5-7 t6-8 t7-9
1 2 3
2 3 13
3 13 23](https://image.slidesharecdn.com/3-prometheus-training-171016155530/85/Monitoring-your-Application-in-Kubernetes-with-Prometheus-16-320.jpg)
![Data model & PromQL
• Recall our time-series requests
• What is requests[3s]? Vector query:
t1 t2 t3 t4 t5 t6 t7 t8 t9
1 2 3 13 23 33 34 35 36
t1-3 t2-4 t3-5 t4-6 t5-7 t6-8 t7-9
1 2 3 13 23 33 34
2 3 13 23 33 34 35
3 13 23 33 34 35 36](https://image.slidesharecdn.com/3-prometheus-training-171016155530/85/Monitoring-your-Application-in-Kubernetes-with-Prometheus-17-320.jpg)
![Data model & PromQL
• rate(requests[3s])
• [
t1-3 t2-4 t3-5 t4-6 t5-7 t6-8 t7-9
1 2 3 13 23 33 34
2 3 13 23 33 34 35
3 13 23 33 34 35 36
(last_value - first_value) / (last_time - first_time)](https://image.slidesharecdn.com/3-prometheus-training-171016155530/85/Monitoring-your-Application-in-Kubernetes-with-Prometheus-19-320.jpg)
![Data model & PromQL
• rate(requests[3s])
• [3-1
t1-3 t2-4 t3-5 t4-6 t5-7 t6-8 t7-9
1 2 3 13 23 33 34
2 3 13 23 33 34 35
3 13 23 33 34 35 36
(last_value - first_value) / (last_time - first_time)](https://image.slidesharecdn.com/3-prometheus-training-171016155530/85/Monitoring-your-Application-in-Kubernetes-with-Prometheus-20-320.jpg)
![Data model & PromQL
• rate(requests[3s])
• [2
t1-3 t2-4 t3-5 t4-6 t5-7 t6-8 t7-9
1 2 3 13 23 33 34
2 3 13 23 33 34 35
3 13 23 33 34 35 36
(last_value - first_value) / (last_time - first_time)](https://image.slidesharecdn.com/3-prometheus-training-171016155530/85/Monitoring-your-Application-in-Kubernetes-with-Prometheus-21-320.jpg)
![Data model & PromQL
• rate(requests[3s])
• [2/(3-1)
t1-3 t2-4 t3-5 t4-6 t5-7 t6-8 t7-9
1 2 3 13 23 33 34
2 3 13 23 33 34 35
3 13 23 33 34 35 36
(last_value - first_value) / (last_time - first_time)](https://image.slidesharecdn.com/3-prometheus-training-171016155530/85/Monitoring-your-Application-in-Kubernetes-with-Prometheus-22-320.jpg)
![Data model & PromQL
• rate(requests[3s])
• [2/2
t1-3 t2-4 t3-5 t4-6 t5-7 t6-8 t7-9
1 2 3 13 23 33 34
2 3 13 23 33 34 35
3 13 23 33 34 35 36
(last_value - first_value) / (last_time - first_time)](https://image.slidesharecdn.com/3-prometheus-training-171016155530/85/Monitoring-your-Application-in-Kubernetes-with-Prometheus-23-320.jpg)
![Data model & PromQL
• rate(requests[3s])
• [1,
t1-3 t2-4 t3-5 t4-6 t5-7 t6-8 t7-9
1 2 3 13 23 33 34
2 3 13 23 33 34 35
3 13 23 33 34 35 36
(last_value - first_value) / (last_time - first_time)](https://image.slidesharecdn.com/3-prometheus-training-171016155530/85/Monitoring-your-Application-in-Kubernetes-with-Prometheus-24-320.jpg)
![Data model & PromQL
• rate(requests[3s])
• [1, 13-2
t1-3 t2-4 t3-5 t4-6 t5-7 t6-8 t7-9
1 2 3 13 23 33 34
2 3 13 23 33 34 35
3 13 23 33 34 35 36
(last_value - first_value) / (last_time - first_time)](https://image.slidesharecdn.com/3-prometheus-training-171016155530/85/Monitoring-your-Application-in-Kubernetes-with-Prometheus-25-320.jpg)
![Data model & PromQL
• rate(requests[3s])
• [1, 11
t1-3 t2-4 t3-5 t4-6 t5-7 t6-8 t7-9
1 2 3 13 23 33 34
2 3 13 23 33 34 35
3 13 23 33 34 35 36
(last_value - first_value) / (last_time - first_time)](https://image.slidesharecdn.com/3-prometheus-training-171016155530/85/Monitoring-your-Application-in-Kubernetes-with-Prometheus-26-320.jpg)
![Data model & PromQL
• rate(requests[3s])
• [1, 11/(4-2)
t1-3 t2-4 t3-5 t4-6 t5-7 t6-8 t7-9
1 2 3 13 23 33 34
2 3 13 23 33 34 35
3 13 23 33 34 35 36
(last_value - first_value) / (last_time - first_time)](https://image.slidesharecdn.com/3-prometheus-training-171016155530/85/Monitoring-your-Application-in-Kubernetes-with-Prometheus-27-320.jpg)
![Data model & PromQL
• rate(requests[3s])
• [1, 11/2
t1-3 t2-4 t3-5 t4-6 t5-7 t6-8 t7-9
1 2 3 13 23 33 34
2 3 13 23 33 34 35
3 13 23 33 34 35 36
(last_value - first_value) / (last_time - first_time)](https://image.slidesharecdn.com/3-prometheus-training-171016155530/85/Monitoring-your-Application-in-Kubernetes-with-Prometheus-28-320.jpg)
![Data model & PromQL
• rate(requests[3s])
• [1, 5.5
t1-3 t2-4 t3-5 t4-6 t5-7 t6-8 t7-9
1 2 3 13 23 33 34
2 3 13 23 33 34 35
3 13 23 33 34 35 36
(last_value - first_value) / (last_time - first_time)](https://image.slidesharecdn.com/3-prometheus-training-171016155530/85/Monitoring-your-Application-in-Kubernetes-with-Prometheus-29-320.jpg)
![Data model & PromQL
• rate(requests[3s])
• [1, 5.5, 23-3
t1-3 t2-4 t3-5 t4-6 t5-7 t6-8 t7-9
1 2 3 13 23 33 34
2 3 13 23 33 34 35
3 13 23 33 34 35 36
(last_value - first_value) / (last_time - first_time)](https://image.slidesharecdn.com/3-prometheus-training-171016155530/85/Monitoring-your-Application-in-Kubernetes-with-Prometheus-30-320.jpg)
![Data model & PromQL
• rate(requests[3s])
• [1, 5.5, 20
t1-3 t2-4 t3-5 t4-6 t5-7 t6-8 t7-9
1 2 3 13 23 33 34
2 3 13 23 33 34 35
3 13 23 33 34 35 36
(last_value - first_value) / (last_time - first_time)](https://image.slidesharecdn.com/3-prometheus-training-171016155530/85/Monitoring-your-Application-in-Kubernetes-with-Prometheus-31-320.jpg)
![Data model & PromQL
• rate(requests[3s])
• [1, 5.5, 20/2
t1-3 t2-4 t3-5 t4-6 t5-7 t6-8 t7-9
1 2 3 13 23 33 34
2 3 13 23 33 34 35
3 13 23 33 34 35 36
(last_value - first_value) / (last_time - first_time)](https://image.slidesharecdn.com/3-prometheus-training-171016155530/85/Monitoring-your-Application-in-Kubernetes-with-Prometheus-32-320.jpg)
![Data model & PromQL
• rate(requests[3s])
• [1, 5.5, 10
t1-3 t2-4 t3-5 t4-6 t5-7 t6-8 t7-9
1 2 3 13 23 33 34
2 3 13 23 33 34 35
3 13 23 33 34 35 36
(last_value - first_value) / (last_time - first_time)](https://image.slidesharecdn.com/3-prometheus-training-171016155530/85/Monitoring-your-Application-in-Kubernetes-with-Prometheus-33-320.jpg)
![Data model & PromQL
• rate(requests[3s])
• [1, 5.5, 10, 10
t1-3 t2-4 t3-5 t4-6 t5-7 t6-8 t7-9
1 2 3 13 23 33 34
2 3 13 23 33 34 35
3 13 23 33 34 35 36
(last_value - first_value) / (last_time - first_time)](https://image.slidesharecdn.com/3-prometheus-training-171016155530/85/Monitoring-your-Application-in-Kubernetes-with-Prometheus-34-320.jpg)
![Data model & PromQL
• rate(requests[3s])
• [1, 5.5, 10, 10, 5.5,
t1-3 t2-4 t3-5 t4-6 t5-7 t6-8 t7-9
1 2 3 13 23 33 34
2 3 13 23 33 34 35
3 13 23 33 34 35 36
(last_value - first_value) / (last_time - first_time)](https://image.slidesharecdn.com/3-prometheus-training-171016155530/85/Monitoring-your-Application-in-Kubernetes-with-Prometheus-35-320.jpg)
![Data model & PromQL
• rate(requests[3s])
• [1, 5.5, 10, 10, 5.5, 1
t1-3 t2-4 t3-5 t4-6 t5-7 t6-8 t7-9
1 2 3 13 23 33 34
2 3 13 23 33 34 35
3 13 23 33 34 35 36
(last_value - first_value) / (last_time - first_time)](https://image.slidesharecdn.com/3-prometheus-training-171016155530/85/Monitoring-your-Application-in-Kubernetes-with-Prometheus-36-320.jpg)
![Data model & PromQL
• rate(requests[3s])
• [1, 5.5, 10, 10, 5.5, 1, 1]
t1-3 t2-4 t3-5 t4-6 t5-7 t6-8 t7-9
1 2 3 13 23 33 34
2 3 13 23 33 34 35
3 13 23 33 34 35 36
(last_value - first_value) / (last_time - first_time)](https://image.slidesharecdn.com/3-prometheus-training-171016155530/85/Monitoring-your-Application-in-Kubernetes-with-Prometheus-37-320.jpg)
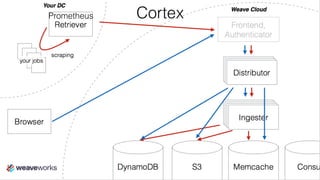
![time
requests
1
3
13
23
33
36
t1 t2 t3 t4 t5 t6 t7 t8 t9
1 2 3 13 23 33 34 35 36
t1-3 t2-4 t3-5 t4-6 t5-7 t6-8 t7-9
1 2 3 13 23 33 34
2 3 13 23 33 34 35
3 13 23 33 34 35 36
requests[3s]
time
rate(requests[3s])
1
5
10
t3 t4 t5 t6 t7 t8 t9
1 5.5 10 10 5.5 1 1](https://image.slidesharecdn.com/3-prometheus-training-171016155530/85/Monitoring-your-Application-in-Kubernetes-with-Prometheus-38-320.jpg)
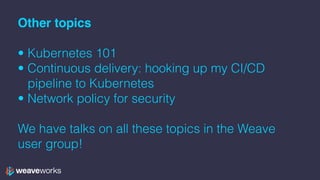
![Now we can understand irate (“instantaneous rate”)
• irate(requests[3s])
• [
t1-3 t2-4 t3-5 t4-6 t5-7 t6-8 t7-9
1 2 3 13 23 33 34
2 3 13 23 33 34 35
3 13 23 33 34 35 36
(last_value - 2nd_last_value) / (last_time - 2nd_last_time)](https://image.slidesharecdn.com/3-prometheus-training-171016155530/85/Monitoring-your-Application-in-Kubernetes-with-Prometheus-39-320.jpg)
![Now we can understand irate (“instantaneous rate”)
• irate(requests[3s])
• [1, 10, 10, 10, 1, 1, 1]
t1-3 t2-4 t3-5 t4-6 t5-7 t6-8 t7-9
1 2 3 13 23 33 34
2 3 13 23 33 34 35
3 13 23 33 34 35 36
(last_value - 2nd_last_value) / (last_time - 2nd_last_time)
it’s “spikier”](https://image.slidesharecdn.com/3-prometheus-training-171016155530/85/Monitoring-your-Application-in-Kubernetes-with-Prometheus-40-320.jpg)
![Labels
• Recall that requests is just shorthand for
{__name__=“requests”}
• We can have more labels:
{__name__=“requests”, job=“frontend”}
• Shortens to requests{job=“frontend”}
• And so we could query
rate(requests{job=“frontend”}[1m])](https://image.slidesharecdn.com/3-prometheus-training-171016155530/85/Monitoring-your-Application-in-Kubernetes-with-Prometheus-41-320.jpg)
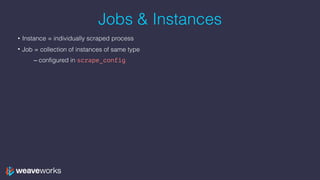
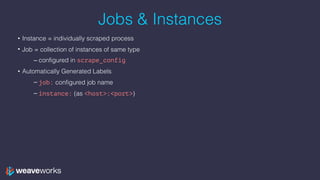


The document provides an overview of using Prometheus for monitoring applications in Kubernetes, detailing its data model, metric types, and architecture. It highlights the integration advantages of Prometheus with Kubernetes, presents key concepts and functionalities such as data types, query syntax, and metrics like counters and histograms. Additionally, it includes practical applications and training elements for real-world scenarios.