Download as PDF, PPTX


![Outline Installation Basic Classes Generating Graphs Analyzing Graphs Save/Load Plotting (Matplotlib)
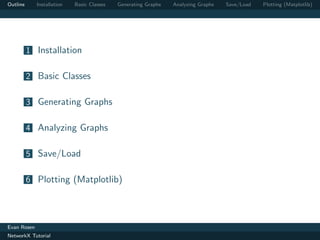
Basic Example
>>> import networkx as nx
>>> G = nx . Graph ()
>>> G . add_node ( " spam " )
>>> G . add_edge (1 ,2)
>>> print ( G . nodes () )
[1 , 2 , ’ spam ’]
>>> print ( G . edges () )
[(1 , 2) ]
Evan Rosen
NetworkX Tutorial](https://image.slidesharecdn.com/nxtutorialbasics-120510050428-phpapp02/85/Nx-tutorial-basics-5-320.jpg)
![Outline Installation Basic Classes Generating Graphs Analyzing Graphs Save/Load Plotting (Matplotlib)
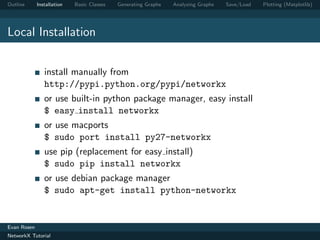
Adding Nodes
add nodes from() takes any iterable collection and any
object
>>> g = nx . Graph ()
>>> g . add_node ( ’a ’)
>>> g . add_nodes_from ( [ ‘ b ’ ,‘c ’ ,‘d ’ ])
>>> g . add_nodes_from ( ’ xyz ’)
>>> h = nx . path_graph (5)
>>> g . add_nodes_from ( h )
>>> g . nodes ()
[0 ,1 , ‘ c ’ ,‘b ’ ,4 , ‘ d ’ ,2 ,3 ,5 , ‘ x ’ ,‘y ’ ,‘z ’]
Evan Rosen
NetworkX Tutorial](https://image.slidesharecdn.com/nxtutorialbasics-120510050428-phpapp02/85/Nx-tutorial-basics-7-320.jpg)
![Outline Installation Basic Classes Generating Graphs Analyzing Graphs Save/Load Plotting (Matplotlib)
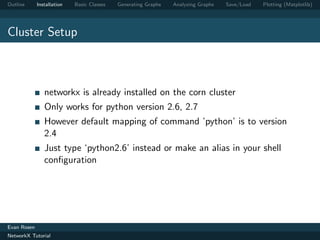
Adding Edges
Adding an edge between nodes that don’t exist will
automatically add those nodes
add nodes from() takes any iterable collection and any type
(anything that has a iter () method)
>>> g = nx . Graph ( [( ‘ a ’ ,‘b ’) ,( ‘ b ’ ,‘c ’) ,( ‘ c ’
,‘a ’) ] )
>>> g . add_edge ( ’a ’ , ’d ’)
>>> g . add_edges_from ([( ‘ d ’ , ‘c ’) , ( ‘ d ’ , ‘b ’)
])
Evan Rosen
NetworkX Tutorial](https://image.slidesharecdn.com/nxtutorialbasics-120510050428-phpapp02/85/Nx-tutorial-basics-8-320.jpg)
![Outline Installation Basic Classes Generating Graphs Analyzing Graphs Save/Load Plotting (Matplotlib)
Adding Node and Edge attributes
Every node and edge is associated with a dictionary from
attribute keys to values
Type indifferent, just needs to be hashable
i.e. can’t use list, must use tuple
>>> G = nx . Graph ()
>>> G . add_node ([1 ,2])
Traceback ( most recent call last ) :
File " < stdin > " , line 1 , in < module >
File " / usr / lib / pymodules / python2 .7/
networkx / classes / graph . py " , line 377 ,
in add_node
if n not in self . adj :
TypeError : unhashable type : ’ list ’
No consistency among attribute dicts enforced by NetworkX
Evan Rosen
NetworkX Tutorial](https://image.slidesharecdn.com/nxtutorialbasics-120510050428-phpapp02/85/Nx-tutorial-basics-9-320.jpg)
![Outline Installation Basic Classes Generating Graphs Analyzing Graphs Save/Load Plotting (Matplotlib)
Node attributes
Can add node attributes as optional arguments along with
most add methods
>>> g = nx . Graph ()
>>> g . add_node (1 , name = ‘ Obrian ’)
>>> g . add_nodes_from ([2] , name = ‘ Quintana ’ ])
>>> g [1][ ‘ name ’]
‘ Obrian ’
Evan Rosen
NetworkX Tutorial](https://image.slidesharecdn.com/nxtutorialbasics-120510050428-phpapp02/85/Nx-tutorial-basics-10-320.jpg)
![Outline Installation Basic Classes Generating Graphs Analyzing Graphs Save/Load Plotting (Matplotlib)
Edge attributes
Can add edge attributes as optional arguments along with
most add methods
>>> g . add_edge (1 , 2 , w =4.7 )
>>> g . add_edges_from ([(3 ,4) ,(4 ,5) ] , w =3.0)
>>> g . add_edges_from ([(1 ,2 ,{ ‘ val ’ :2.0}) ])
# adds third value in tuple as ‘ weight ’ attr
>>> g . ad d _w ei g h t e d _ e d g e s _ f r o m ([(6 ,7 ,3.0) ])
>>> g . get_edge_data (3 ,4)
{ ‘ w ’ : 3.0}
>>> g . add_edge (5 ,6)
>>> g [5][6]
{}
Evan Rosen
NetworkX Tutorial](https://image.slidesharecdn.com/nxtutorialbasics-120510050428-phpapp02/85/Nx-tutorial-basics-11-320.jpg)
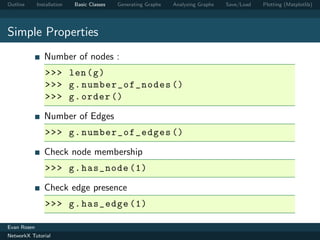
![Outline Installation Basic Classes Generating Graphs Analyzing Graphs Save/Load Plotting (Matplotlib)
Neighbors
Iterating over edges
can be useful for efficiency
>>> G = nx . Graph ()
>>> G . add_path ([0 ,1 ,2 ,3])
>>> [ e for e in G . edges_iter () ]
[(0 , 1) , (1 , 2) , (2 , 3) ]
>>> [( n , nbrs ) for n , nbrs in G . adjacency_iter
() ]
[(0 , {1: {}}) , (1 , {0: {} , 2: {}}) , (2 , {1:
{} , 3: {}}) , (3 , {2: {}}) ]
>>> G [1][2][ ’ new_attr ’] = 5
>>> G [1][2][ ’ new_attr ’]
5
Evan Rosen
NetworkX Tutorial](https://image.slidesharecdn.com/nxtutorialbasics-120510050428-phpapp02/85/Nx-tutorial-basics-13-320.jpg)
![Outline Installation Basic Classes Generating Graphs Analyzing Graphs Save/Load Plotting (Matplotlib)
Degrees
>>> G . degree (0)
1
>>> G . degree ([0 ,1])
{0: 1 , 1: 2}
>>> G . degree ()
{1: 1 , 2: 2 , 3: 2 , 4: 1}
>>> G . degree () . values () # useful for degree
dist
[1 , 2 , 2 , 1]
Evan Rosen
NetworkX Tutorial](https://image.slidesharecdn.com/nxtutorialbasics-120510050428-phpapp02/85/Nx-tutorial-basics-14-320.jpg)
![Outline Installation Basic Classes Generating Graphs Analyzing Graphs Save/Load Plotting (Matplotlib)
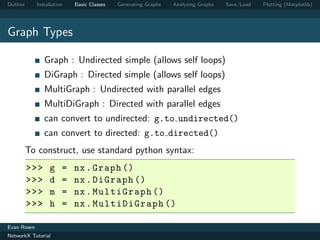
Simple Graph Generators
located in networkx.generators.classic module
Complete Graph
nx . complete_graph (5)
Chain
nx . path_graph (5)
Bipartite
nx . c om p l e te _ b i p a r t i t e _ g r a p h ( n1 , n2 )
Arbitrary Dimensional Lattice (nodes are tuples of ints)
nx . grid_graph ([10 ,10 ,10 ,10]) # 4D , 100^4
nodes
Evan Rosen
NetworkX Tutorial](https://image.slidesharecdn.com/nxtutorialbasics-120510050428-phpapp02/85/Nx-tutorial-basics-15-320.jpg)
![Outline Installation Basic Classes Generating Graphs Analyzing Graphs Save/Load Plotting (Matplotlib)
Edge List Text File
nx . read_edgelist ( ‘ elist ’ , comment = ‘# ’ ,
delimiter = ‘ t ’)
nx . write_edgelist (G , path )
>>> G . edges ()
[( u ‘1 ’ , u ‘3 ’) , (u ‘1 ’ , u ‘2 ’) , (u ‘3 ’ , u ‘2 ’) ]
>>> G . add_edge (u ‘1 ’ ,u ‘3 ’)
>>> nx . save_edgelist (G , ’ elist_new ’ , data =
False )
# edge list file # new edge list file
1 2 1 2
3 2 3 2
3 1
Evan Rosen
NetworkX Tutorial](https://image.slidesharecdn.com/nxtutorialbasics-120510050428-phpapp02/85/Nx-tutorial-basics-22-320.jpg)
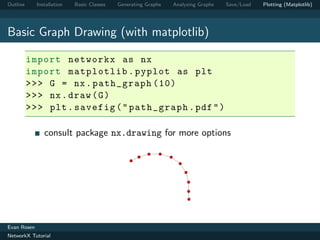
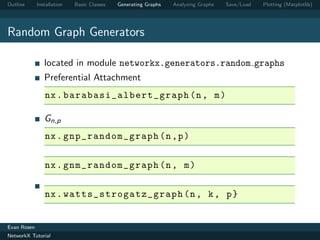
![Outline Installation Basic Classes Generating Graphs Analyzing Graphs Save/Load Plotting (Matplotlib)
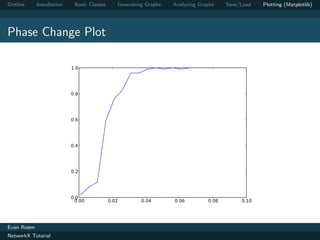
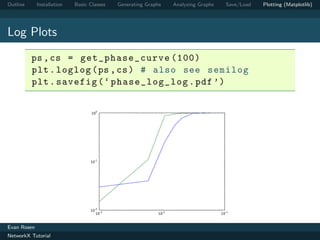
Basic Data Plotting
def get_phase_curve ( n ) :
ps = np . arange (0.001 ,0.1 ,0.005)
cs = []
for p in ps :
G = nx . gnp_random_graph (n , p )
c = nx . c o n n e c t e d _ c o m p o n e n t _ s u b g r a p h s
( G ) [0]. order ()
cs . append ( float ( c ) /100)
return cs
plt . plot ( ps , get_phase_curve (100) )
plt . savefig ( ‘ phase . pdf ’)
Evan Rosen
NetworkX Tutorial](https://image.slidesharecdn.com/nxtutorialbasics-120510050428-phpapp02/85/Nx-tutorial-basics-28-320.jpg)
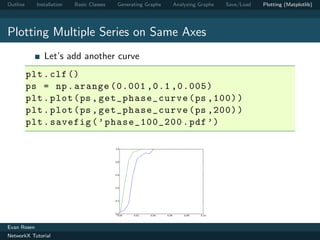
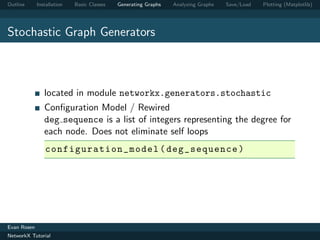
![Outline Installation Basic Classes Generating Graphs Analyzing Graphs Save/Load Plotting (Matplotlib)
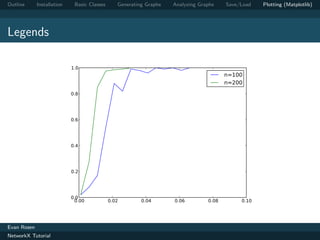
Legends
each call to plt.plot returns a handle object for the series
of type matplotlib.lines.Line2D
to add a legend, call use method
plt.legend([handles],[labels])
can control placement with keyword argument
loc=[1,. . .,10] (uppper left, lower left, ...)
h_100 = plt . plot ( ps , get_phase_curve (100) )
h_200 = plt . plot ( ps , get_phase_curve (200) )
plt . legend ([ h_100 , h_200 ] ,[ ‘ n =100 ’ ,‘n =200 ’ ])
Evan Rosen
NetworkX Tutorial](https://image.slidesharecdn.com/nxtutorialbasics-120510050428-phpapp02/85/Nx-tutorial-basics-33-320.jpg)
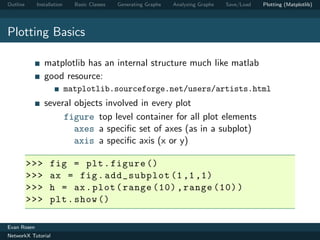
![Outline Installation Basic Classes Generating Graphs Analyzing Graphs Save/Load Plotting (Matplotlib)
Legends
Can use Latex:
plt . legend ([ h_100 , h_200 ] ,[ ’ $$ n =100 $$ ’ , ’
$$ n =200 $$ ’ ])
Evan Rosen
NetworkX Tutorial](https://image.slidesharecdn.com/nxtutorialbasics-120510050428-phpapp02/85/Nx-tutorial-basics-35-320.jpg)

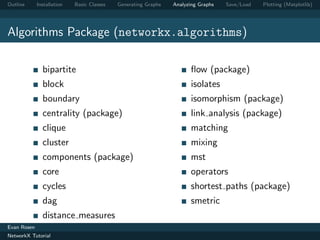
The document outlines topics covered in a NetworkX tutorial, including installation, basic classes, generating graphs, analyzing graphs, saving/loading graphs, and plotting graphs with Matplotlib. Specific sections cover local and cluster installation of NetworkX, adding nodes and edges to graphs along with attributes, basic graph properties like number of nodes/edges and neighbors, simple graph generators, random graph generators, and the algorithms package.