Download as PDF, PPTX
![Websocket API – response
{
"responses” :
[
{
"metric" : "sys.cpu.user",
"timestamp" : 1469028728091,
"value" : 1.0,
"tags” :
[
{
"key" : "rack",
"value" : "r1"
}
],
"subscriptionId” : <unique id>,
"complete” : false,
}
]
}](https://image.slidesharecdn.com/timelyyeartwo-171016182259/75/Timely-Year-Two-Lessons-Learned-Building-a-Scalable-Metrics-Analytic-System-12-2048.jpg)
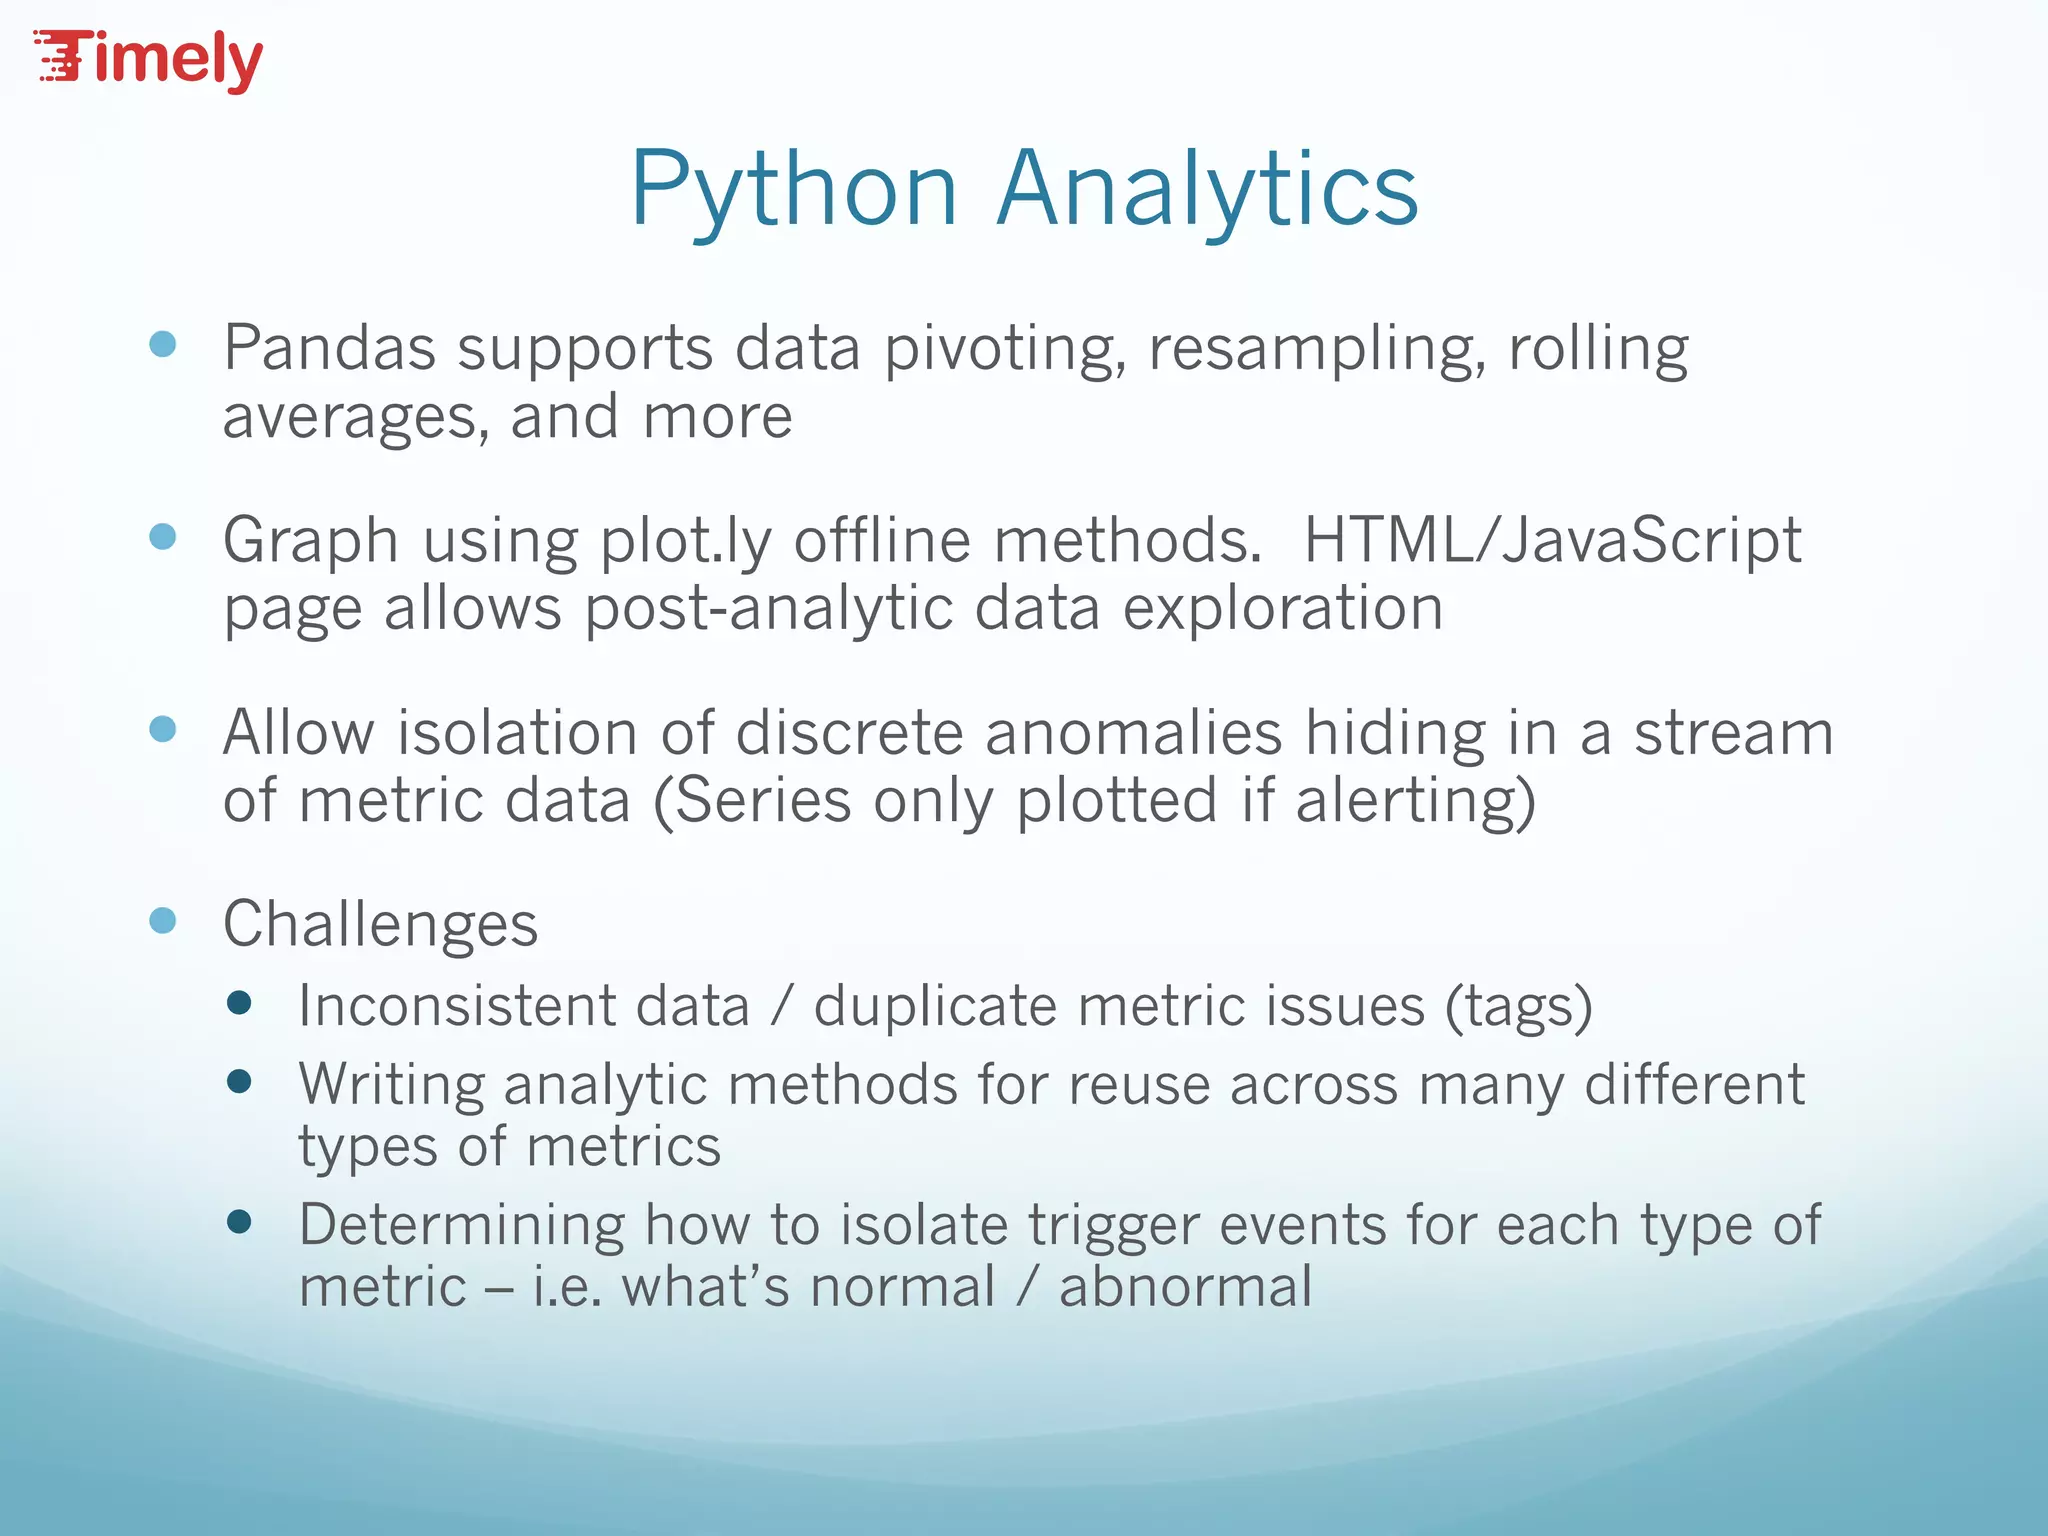
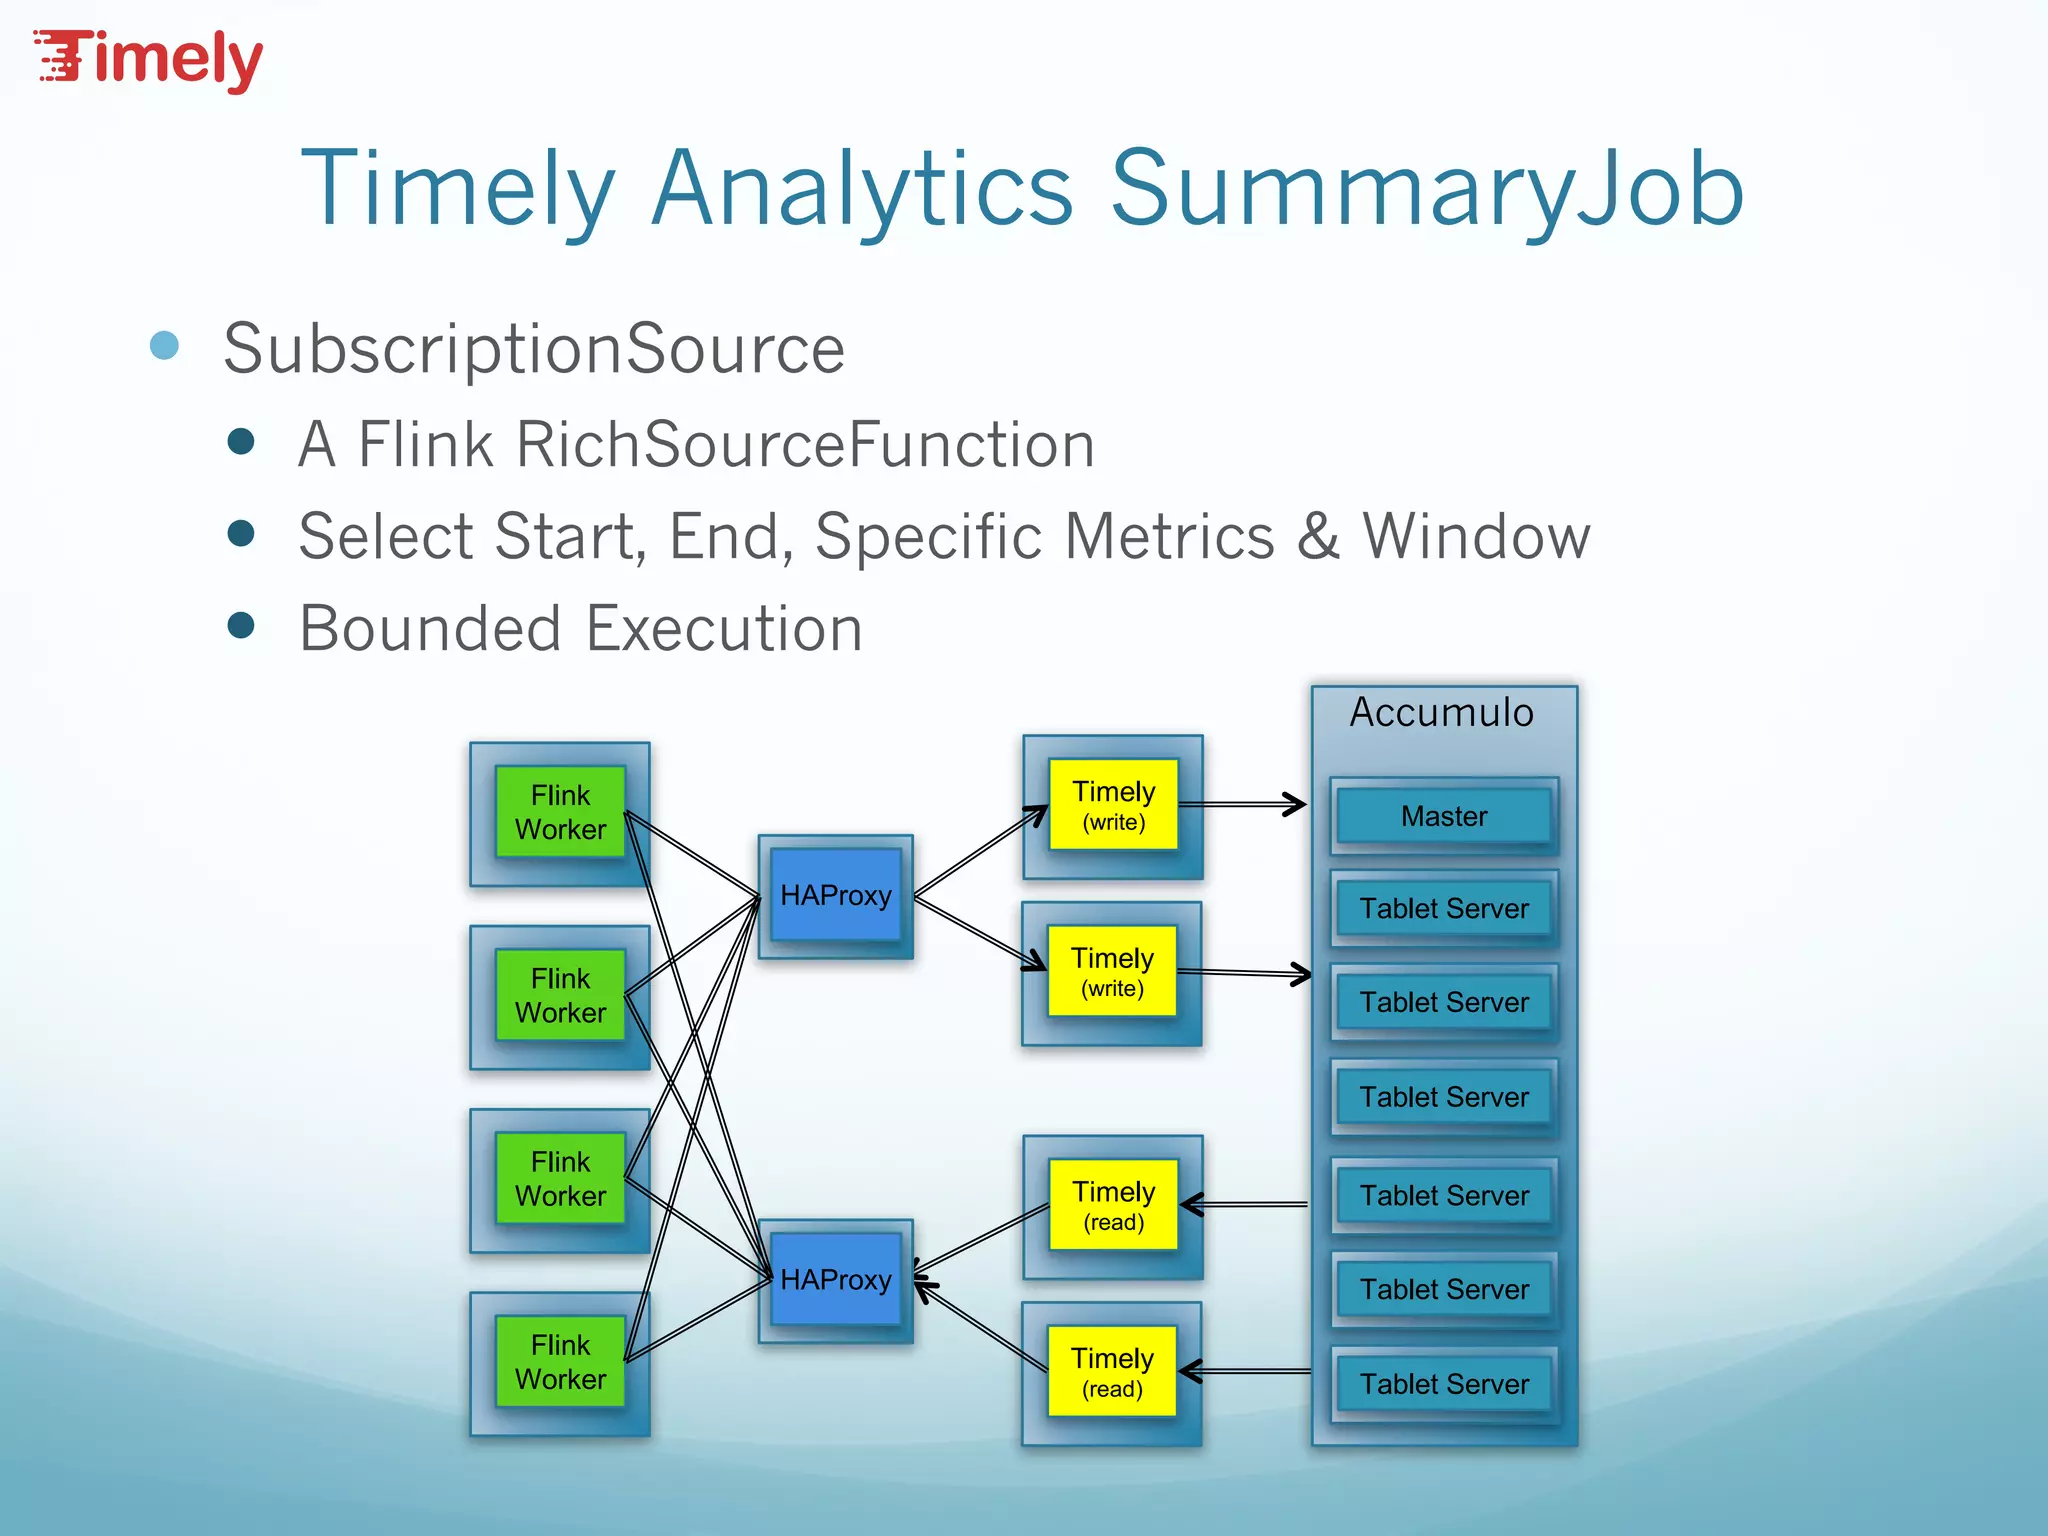
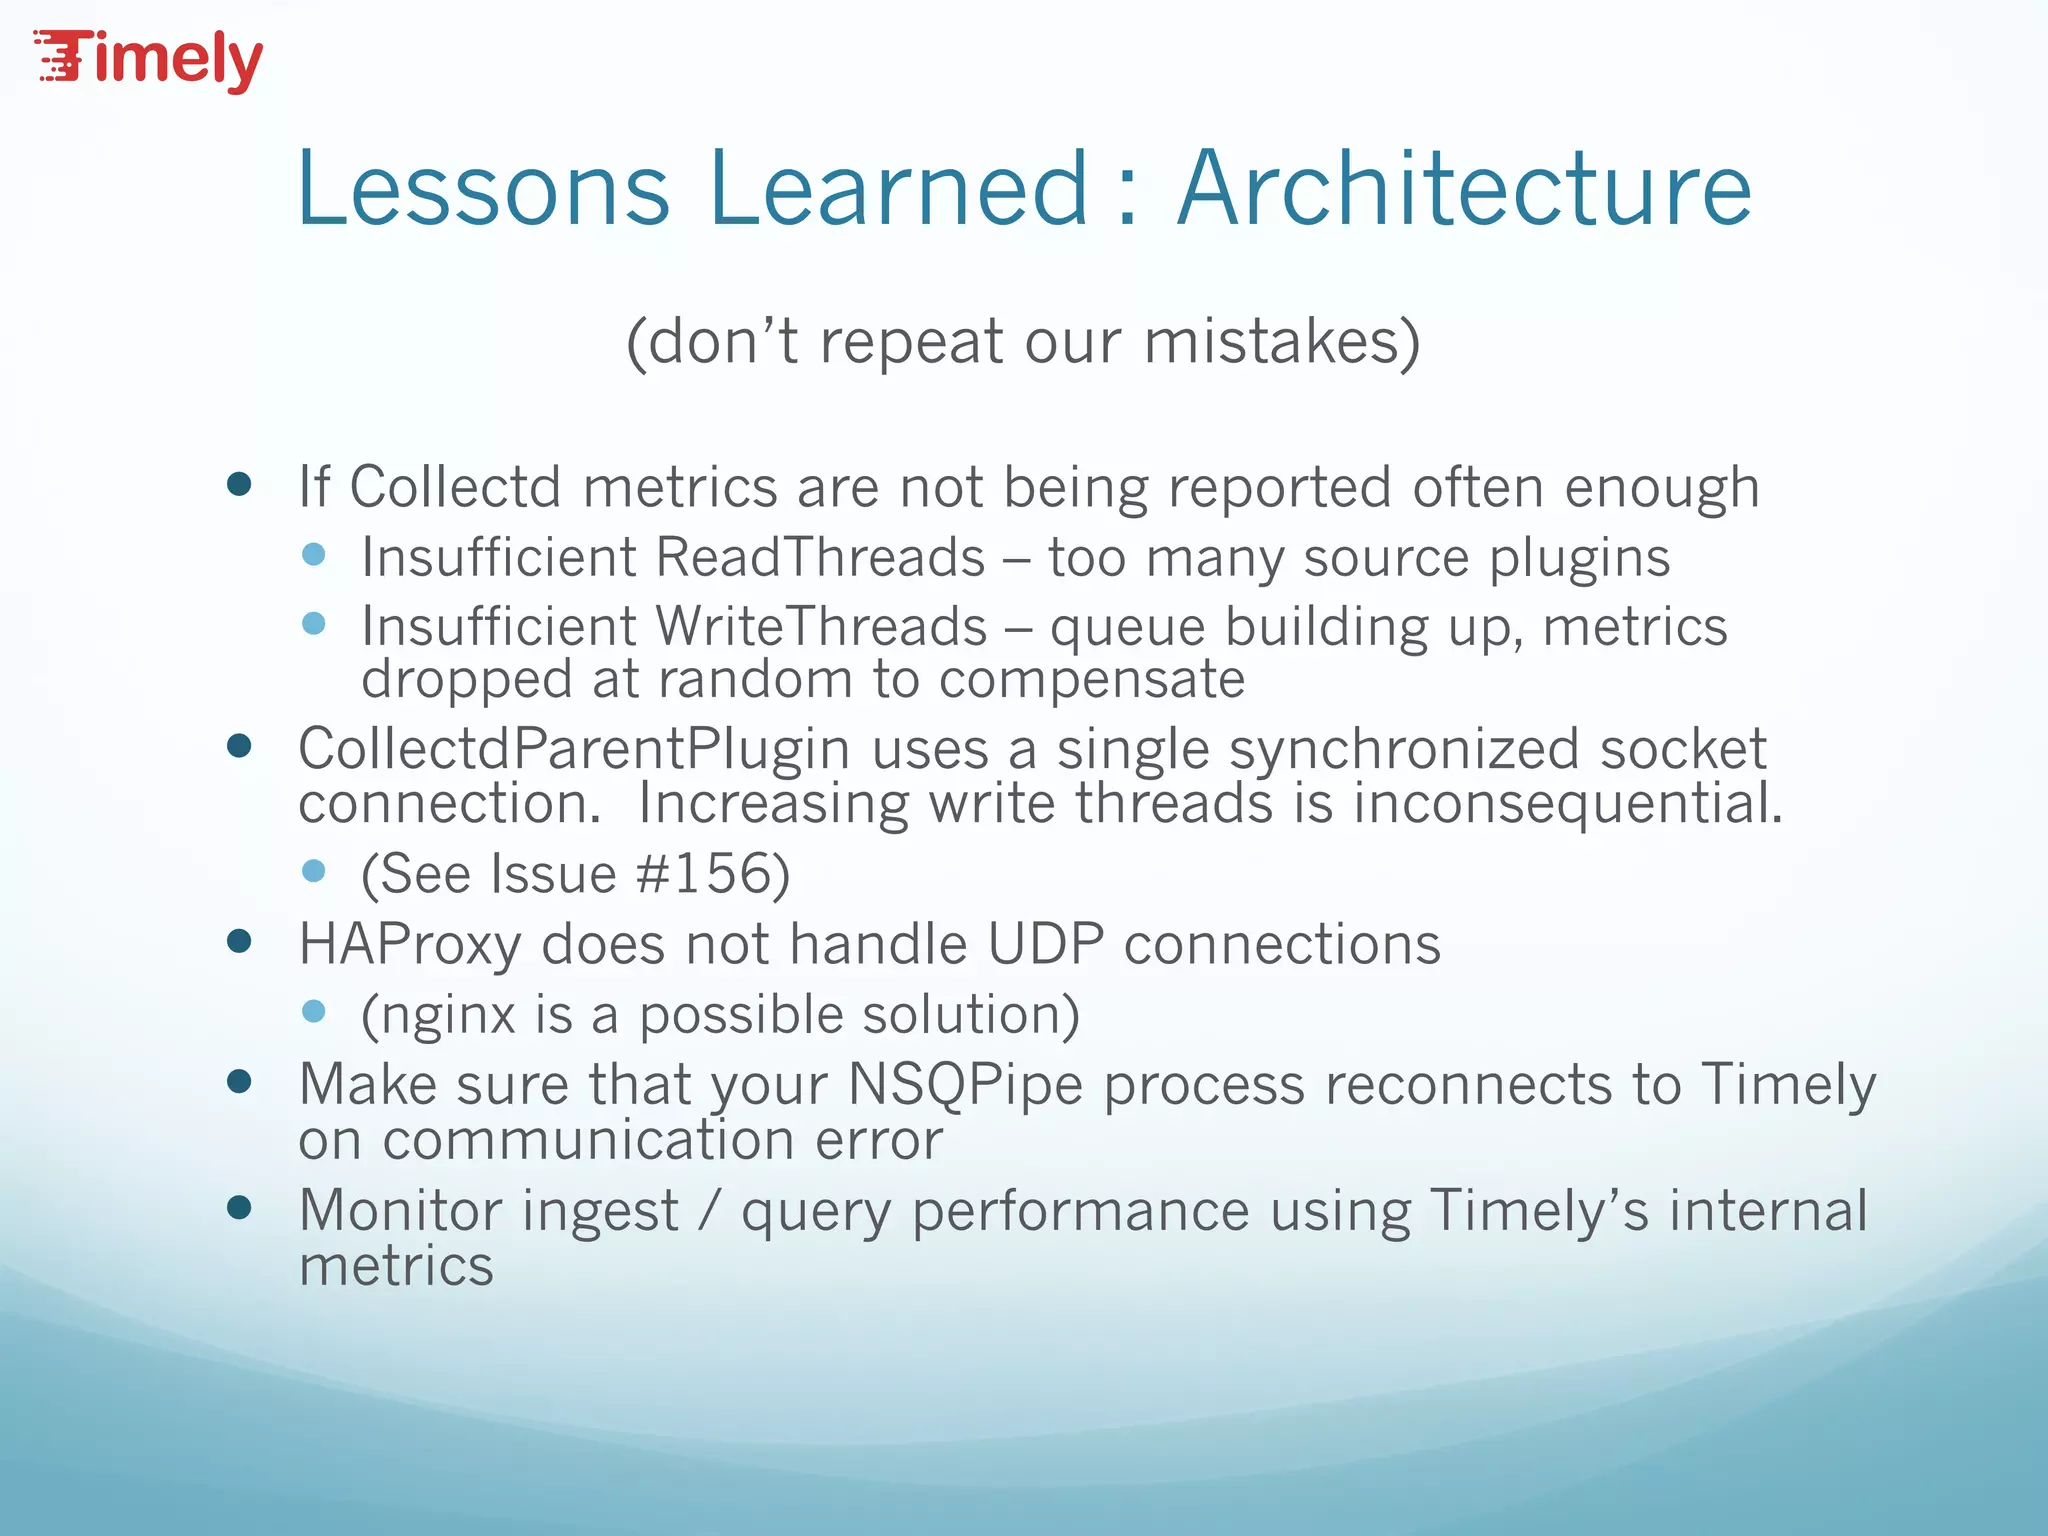
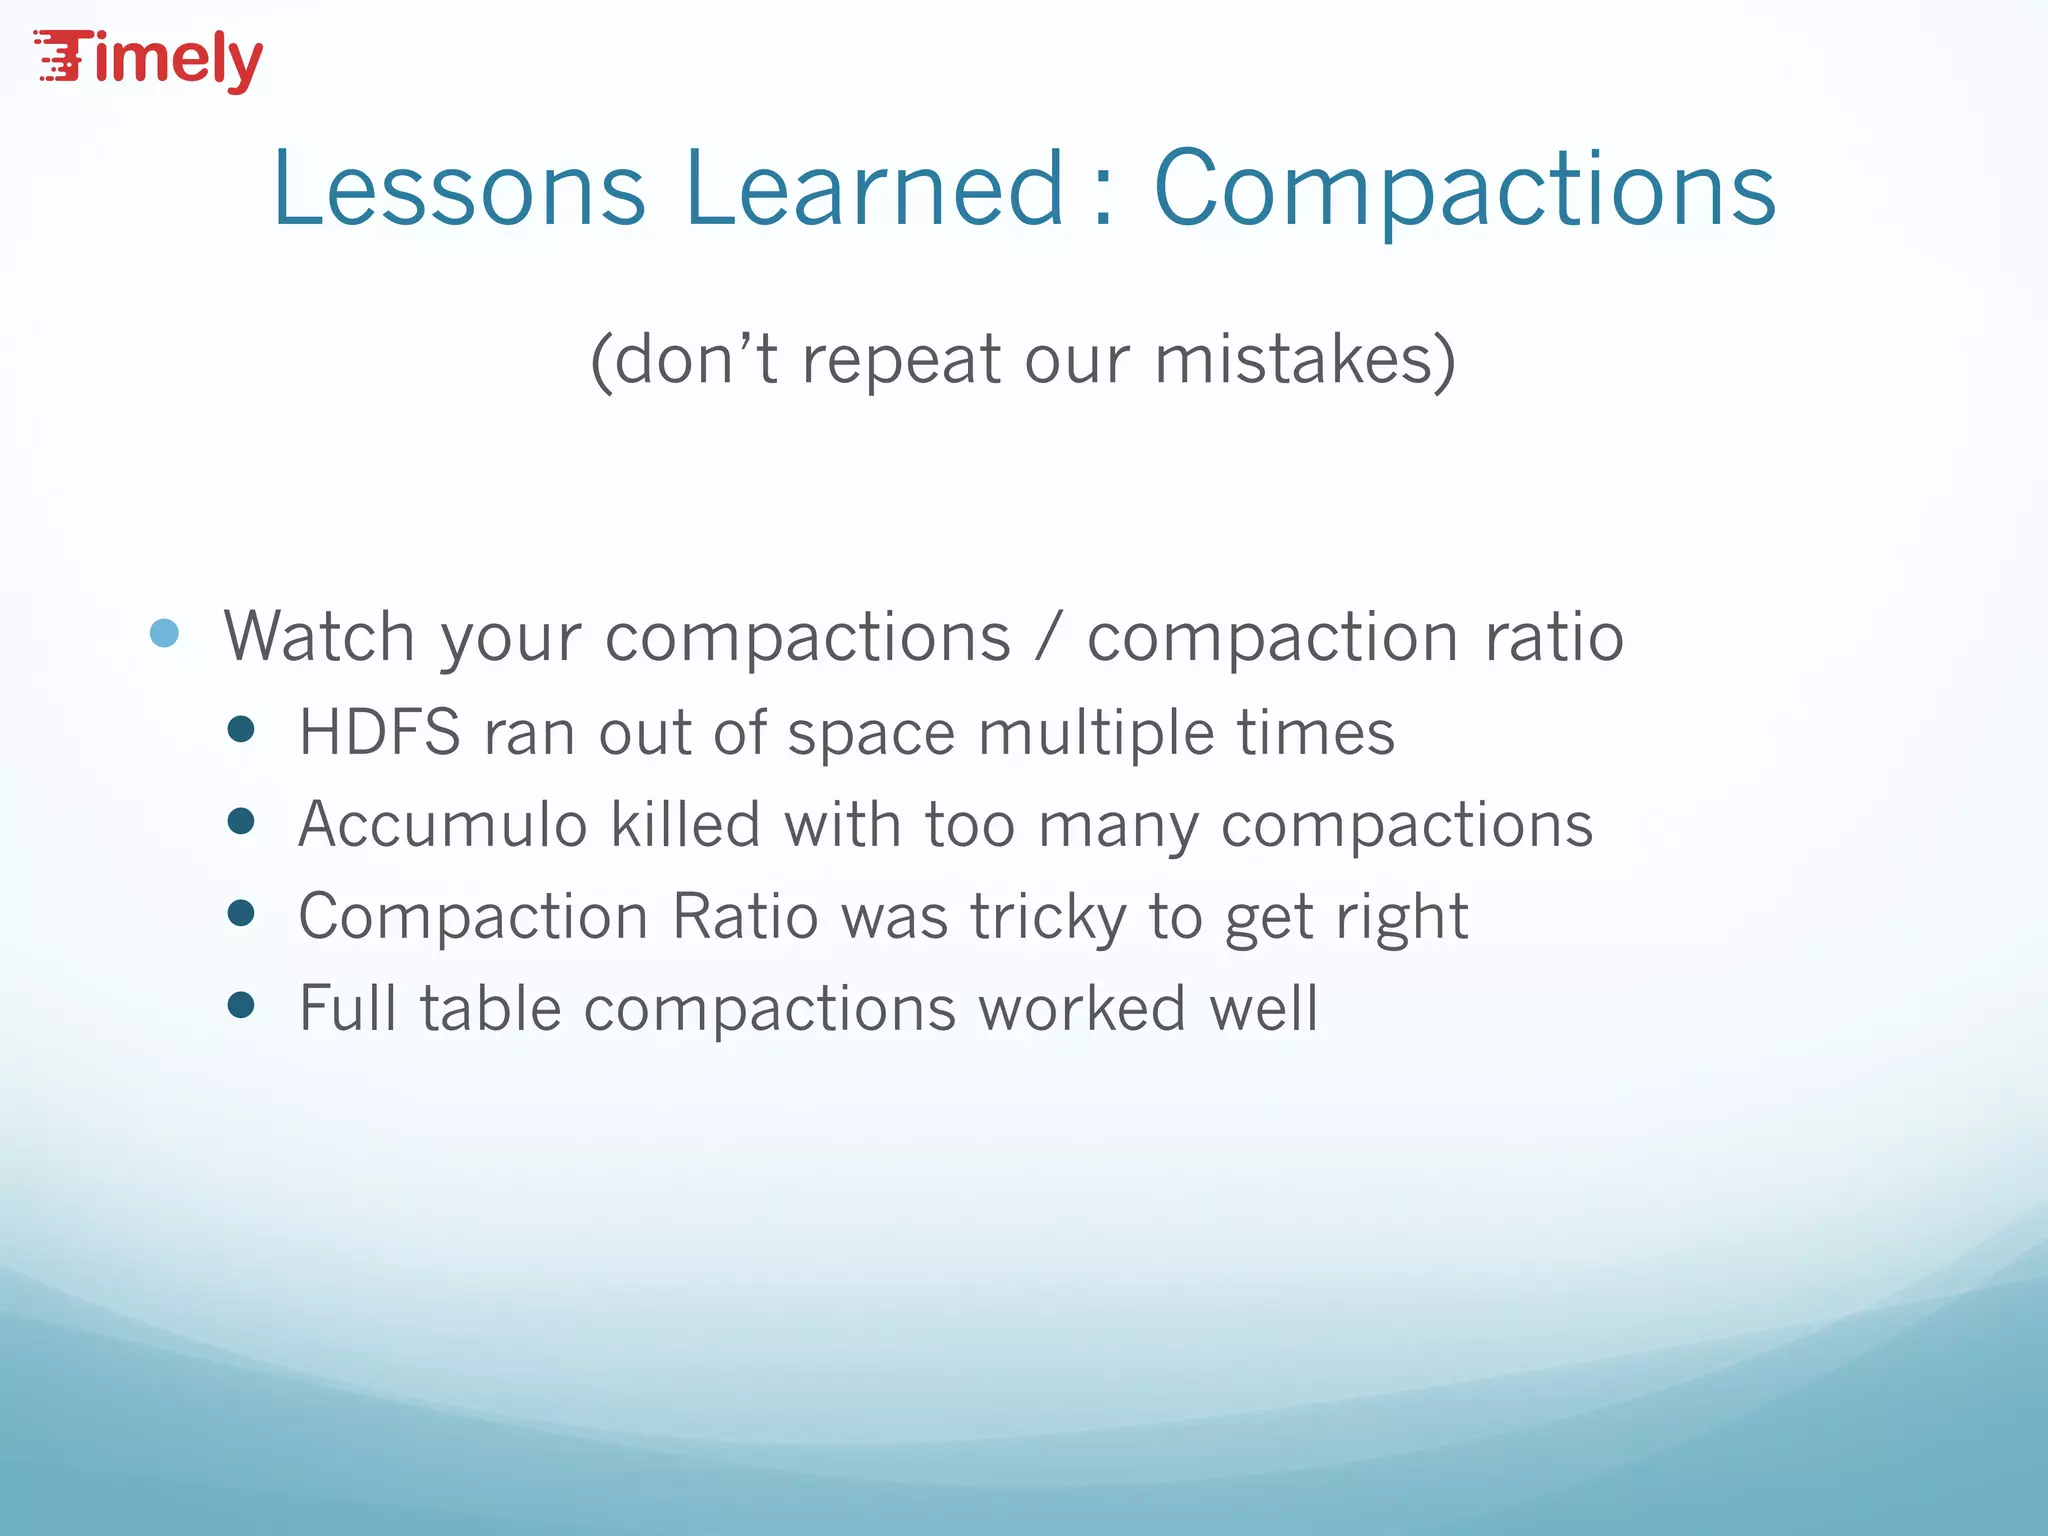
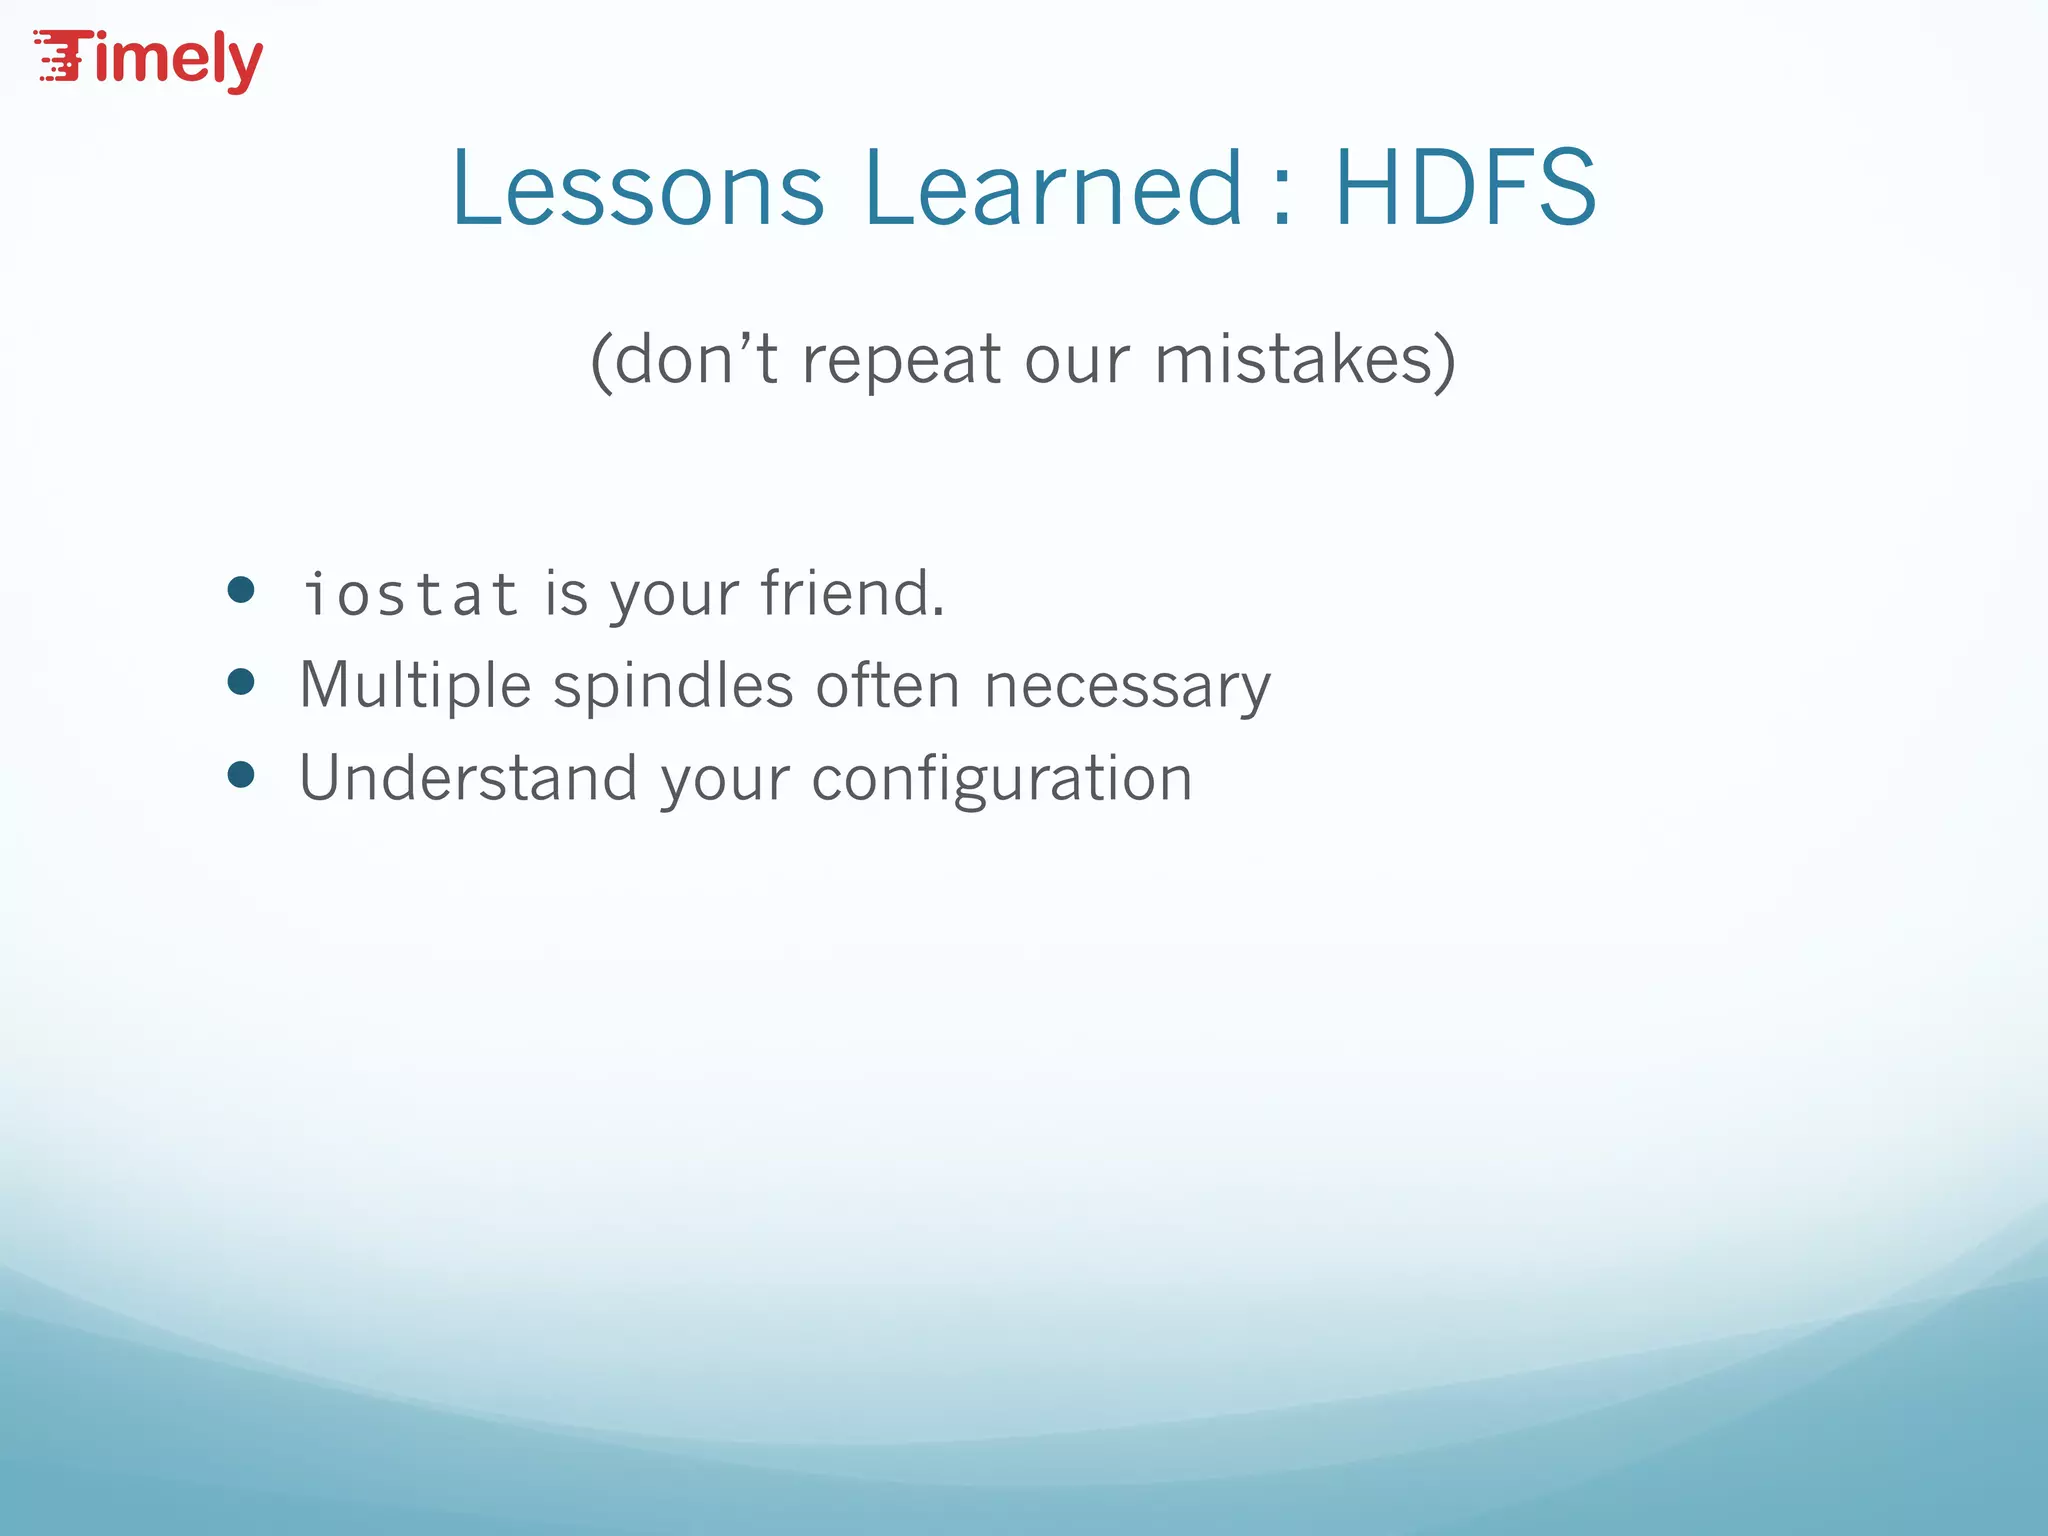
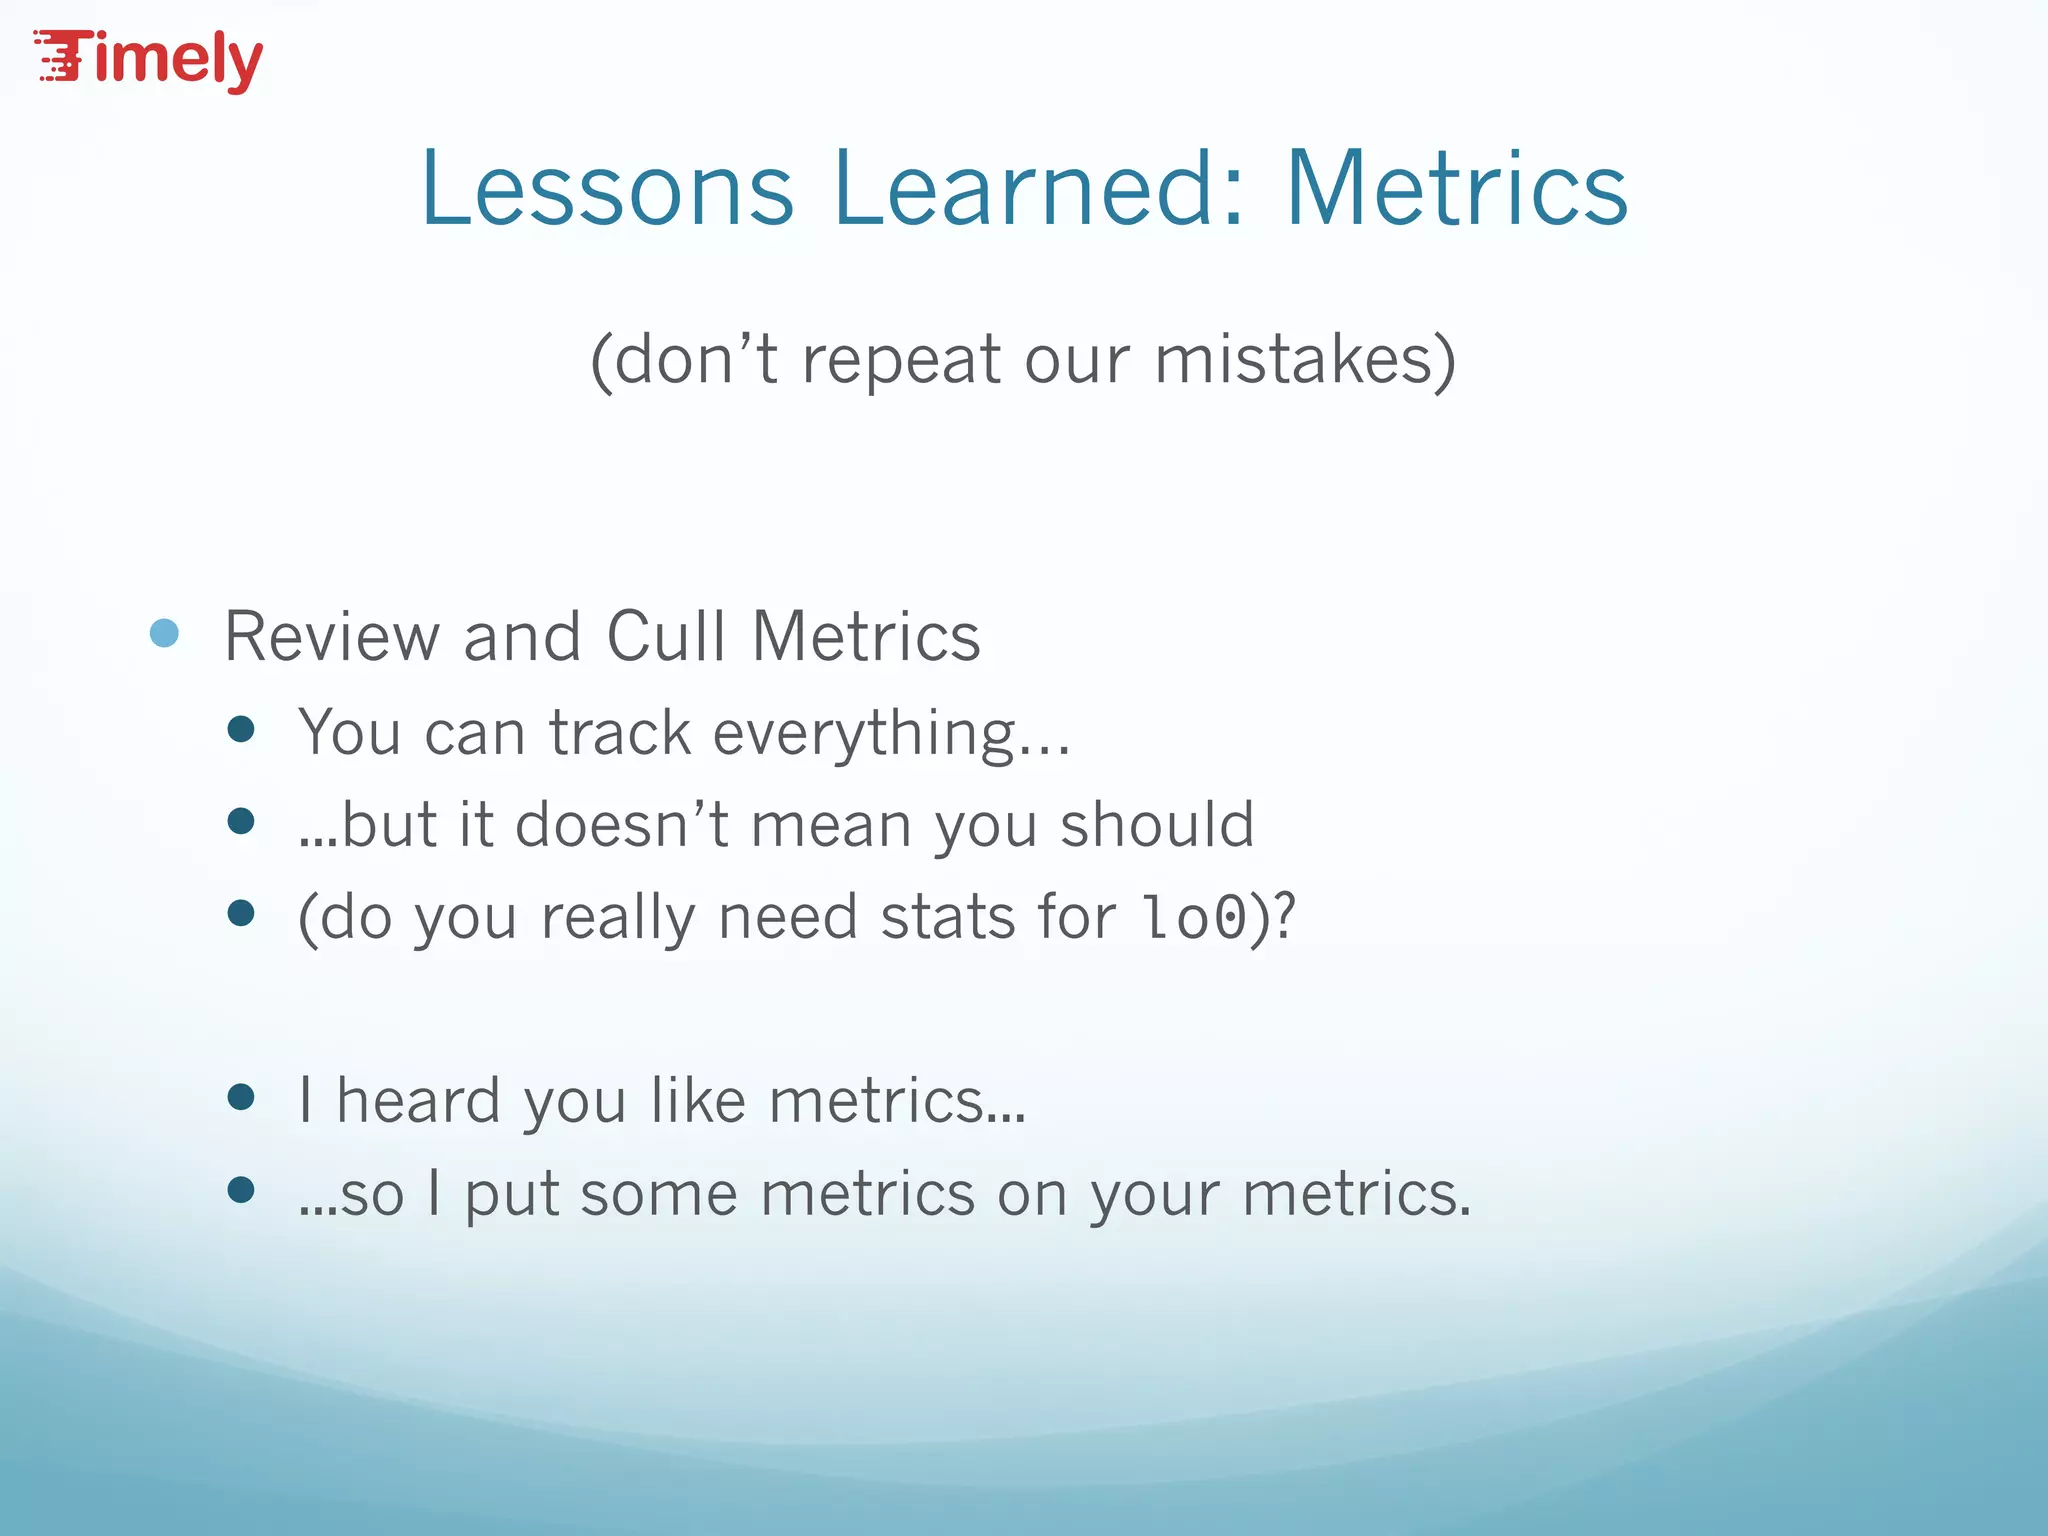


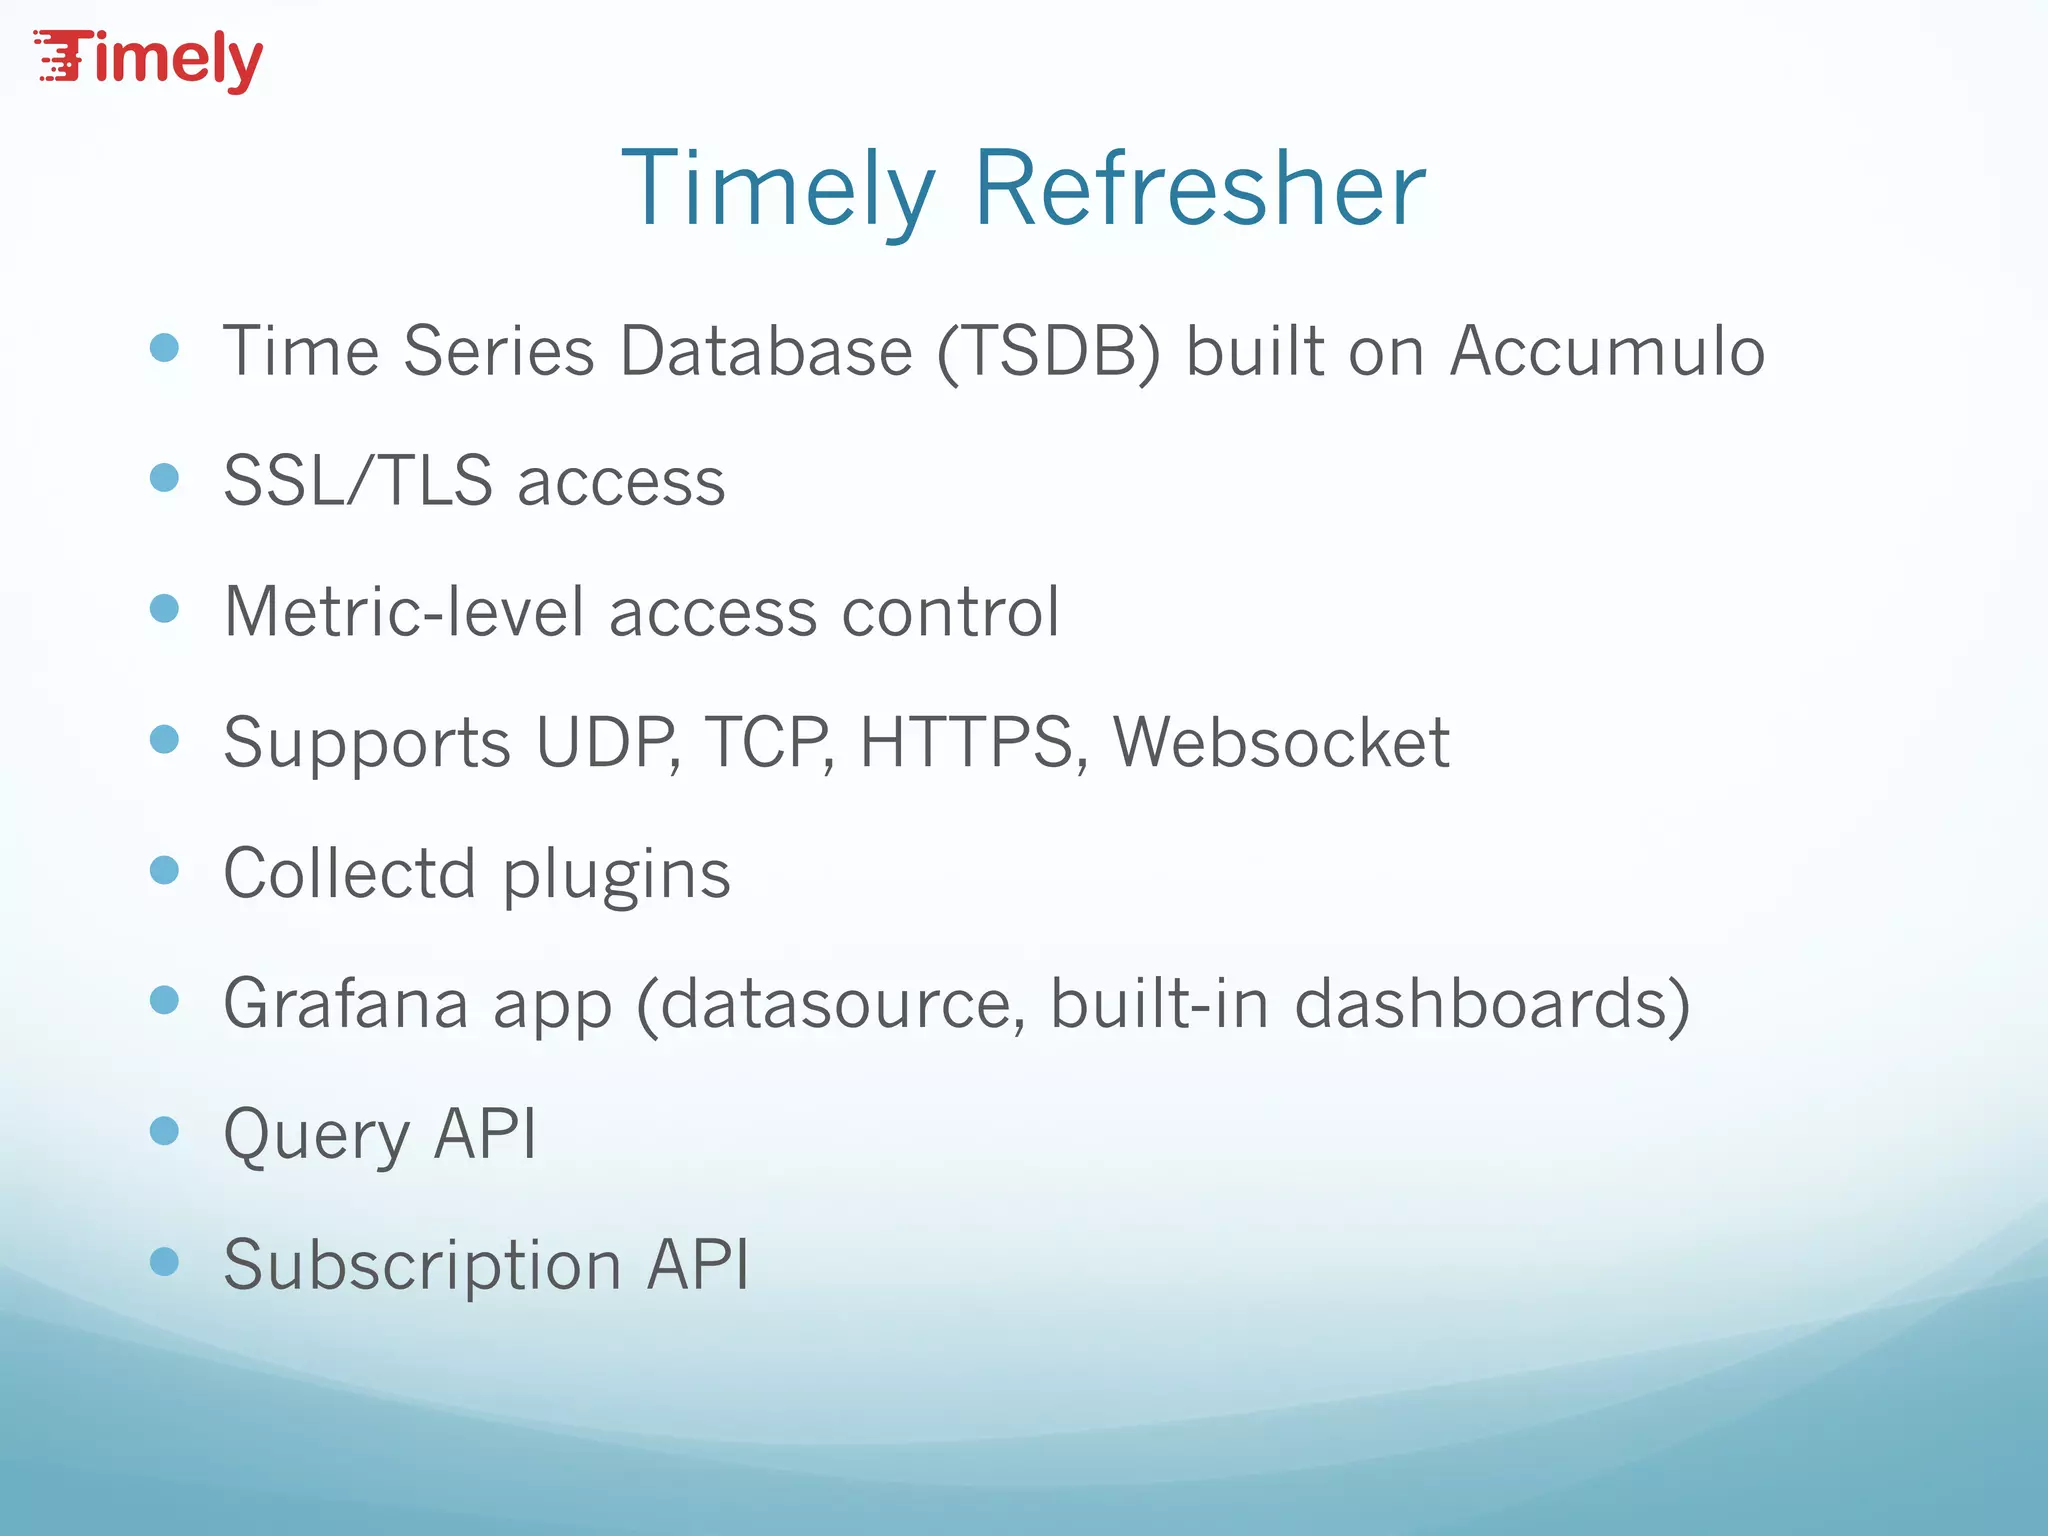
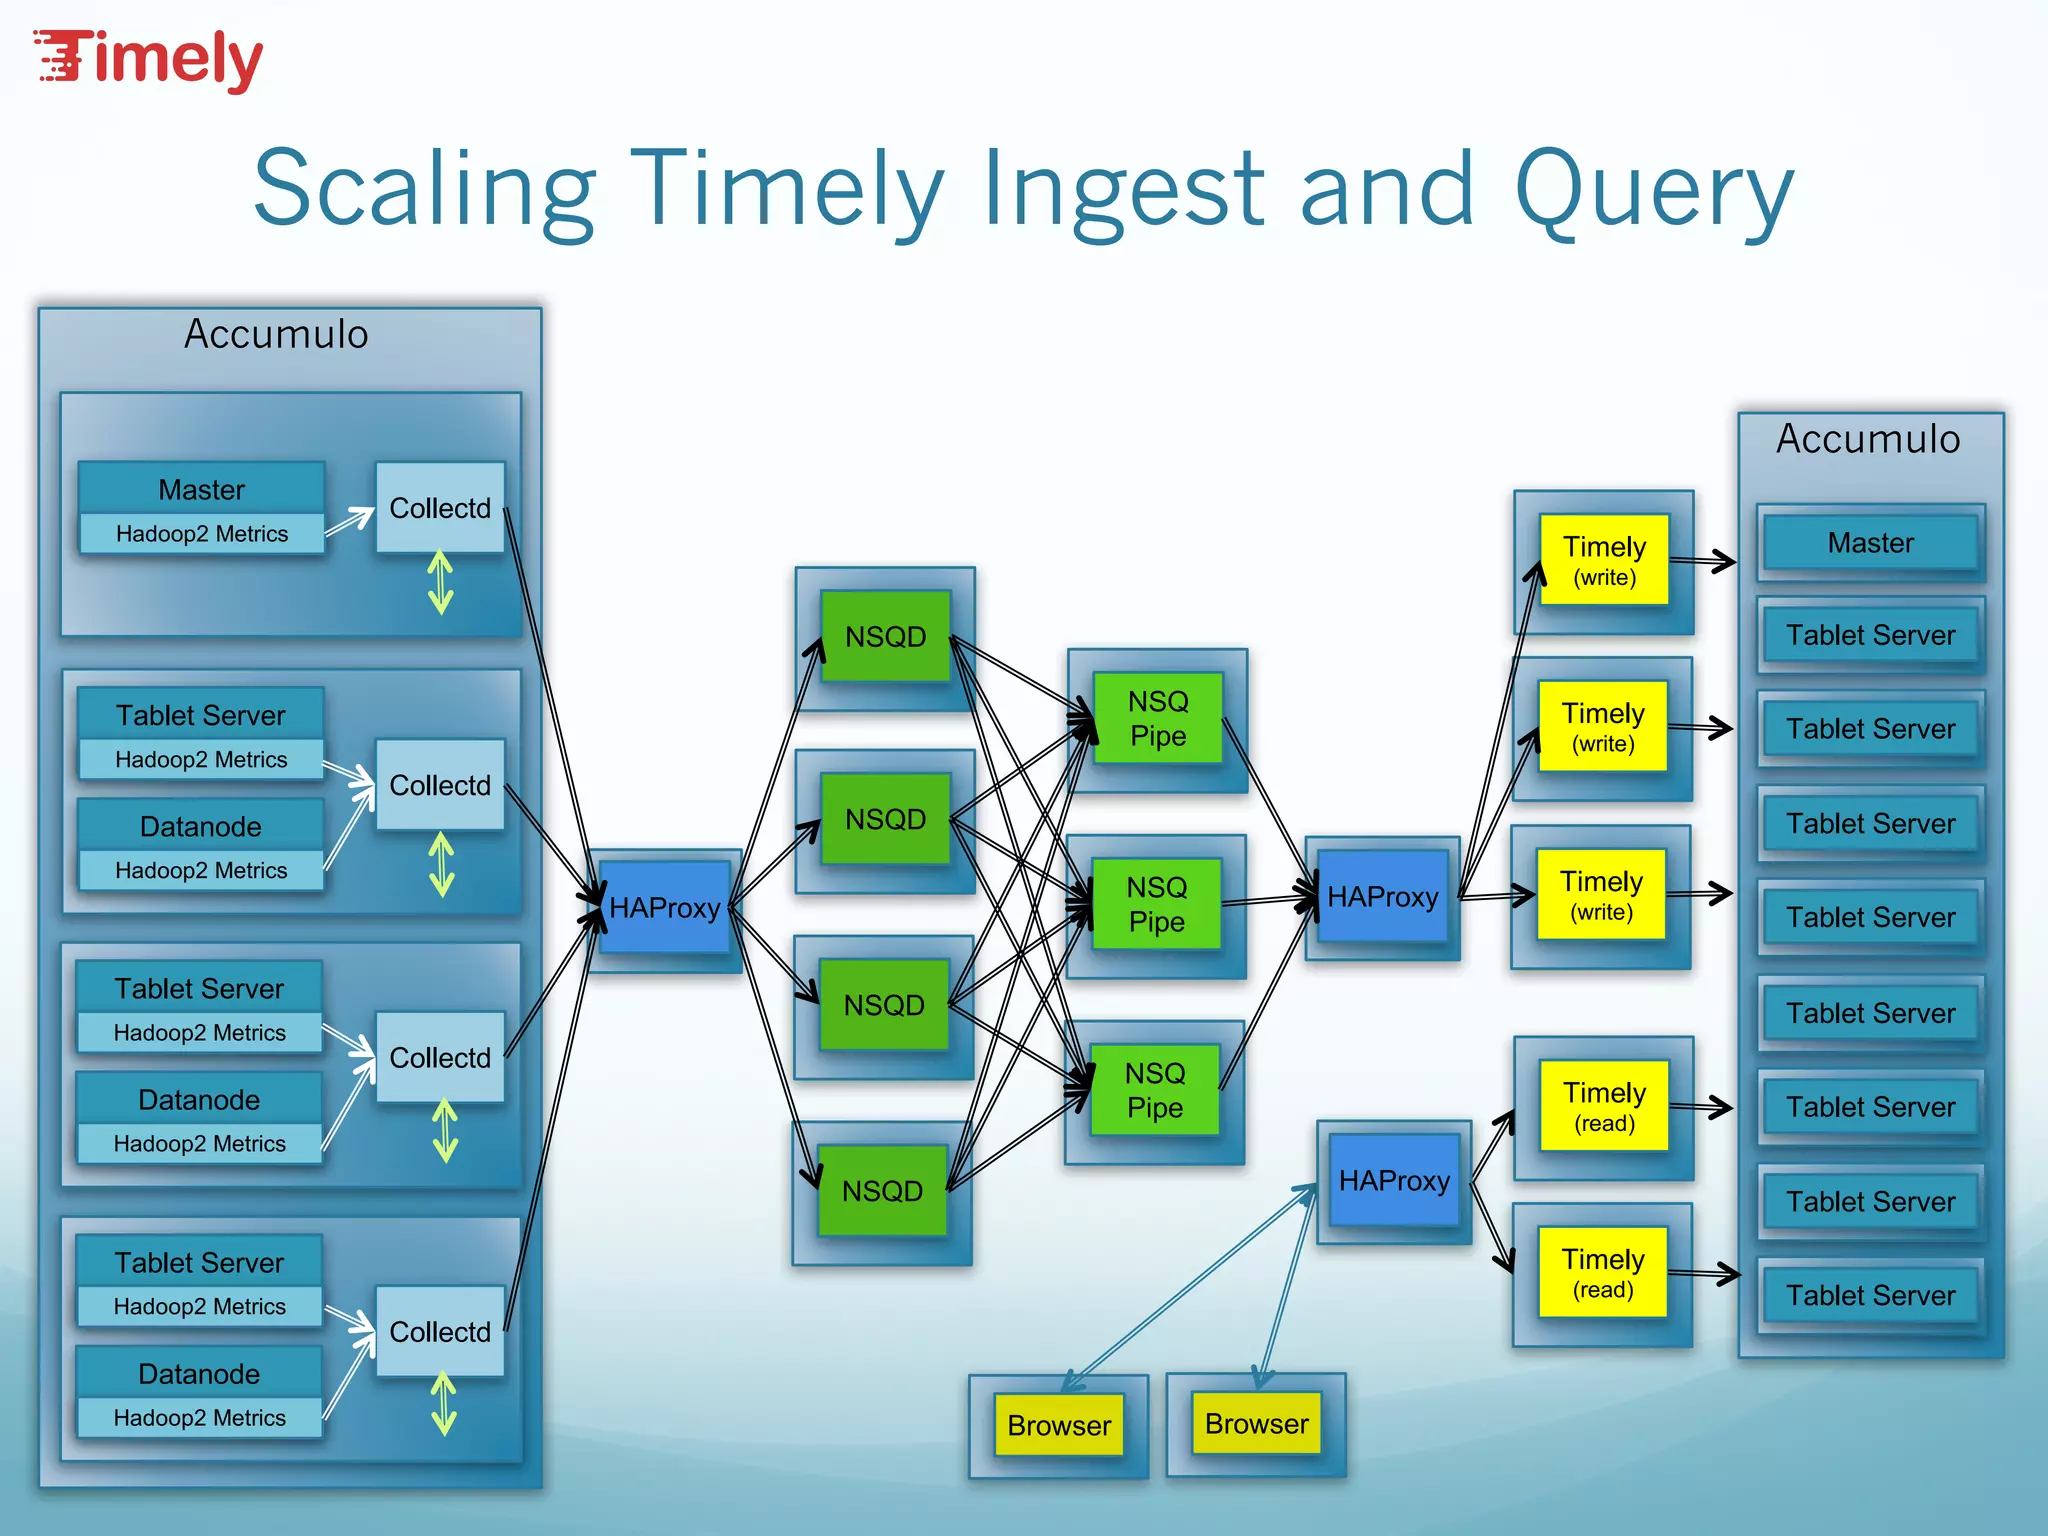
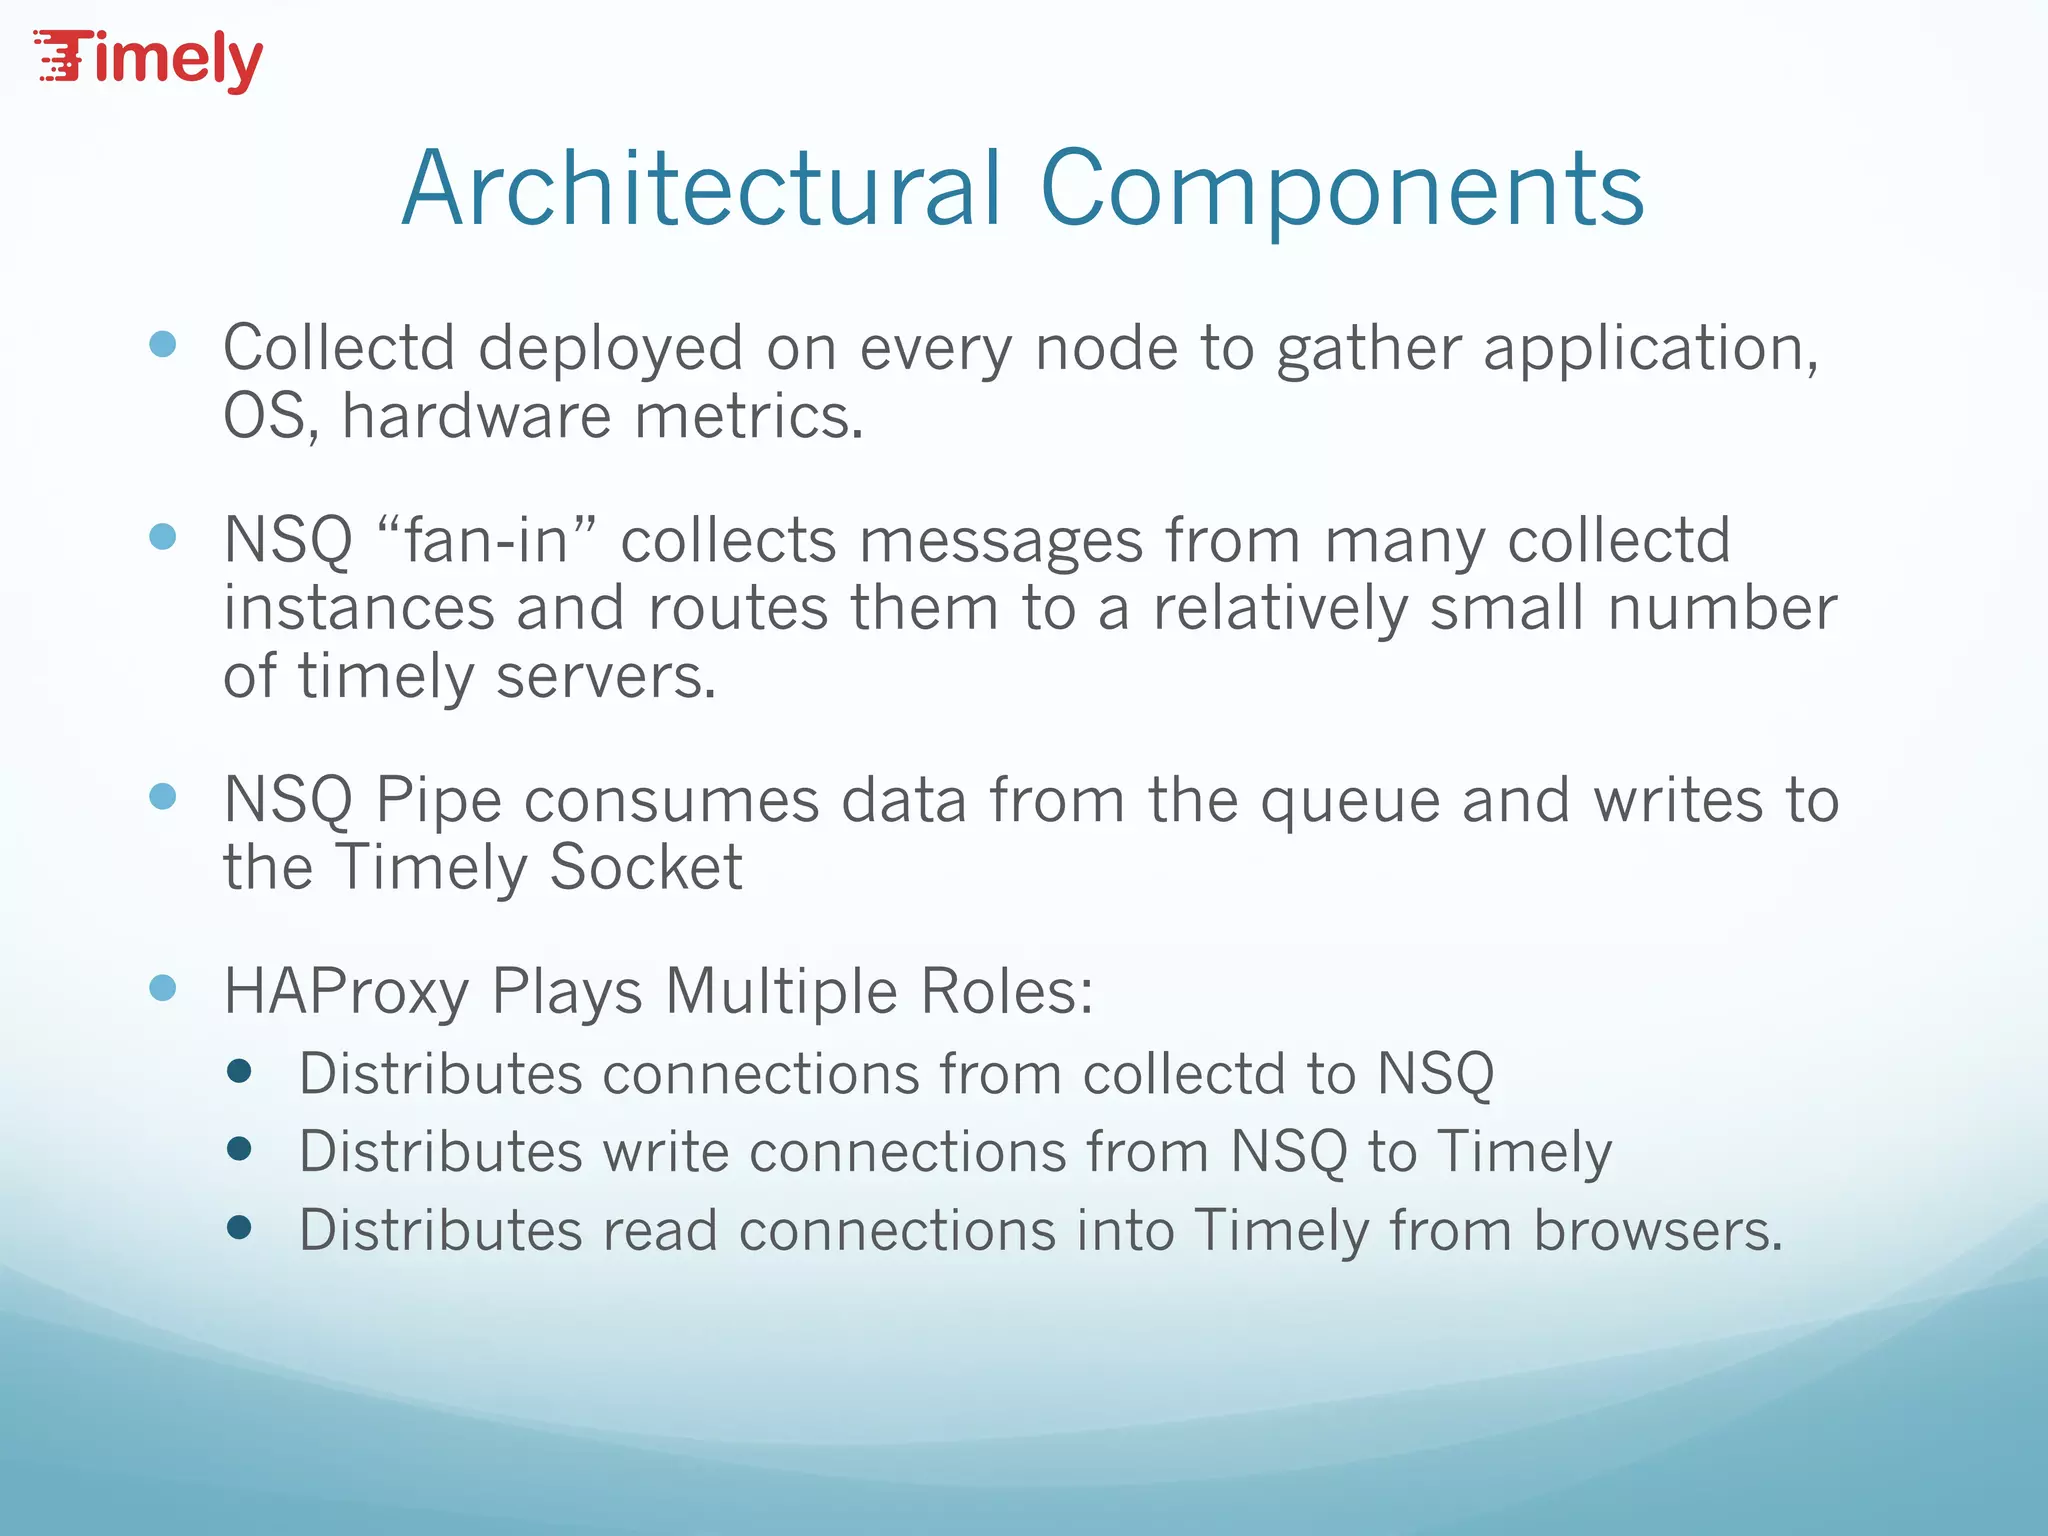
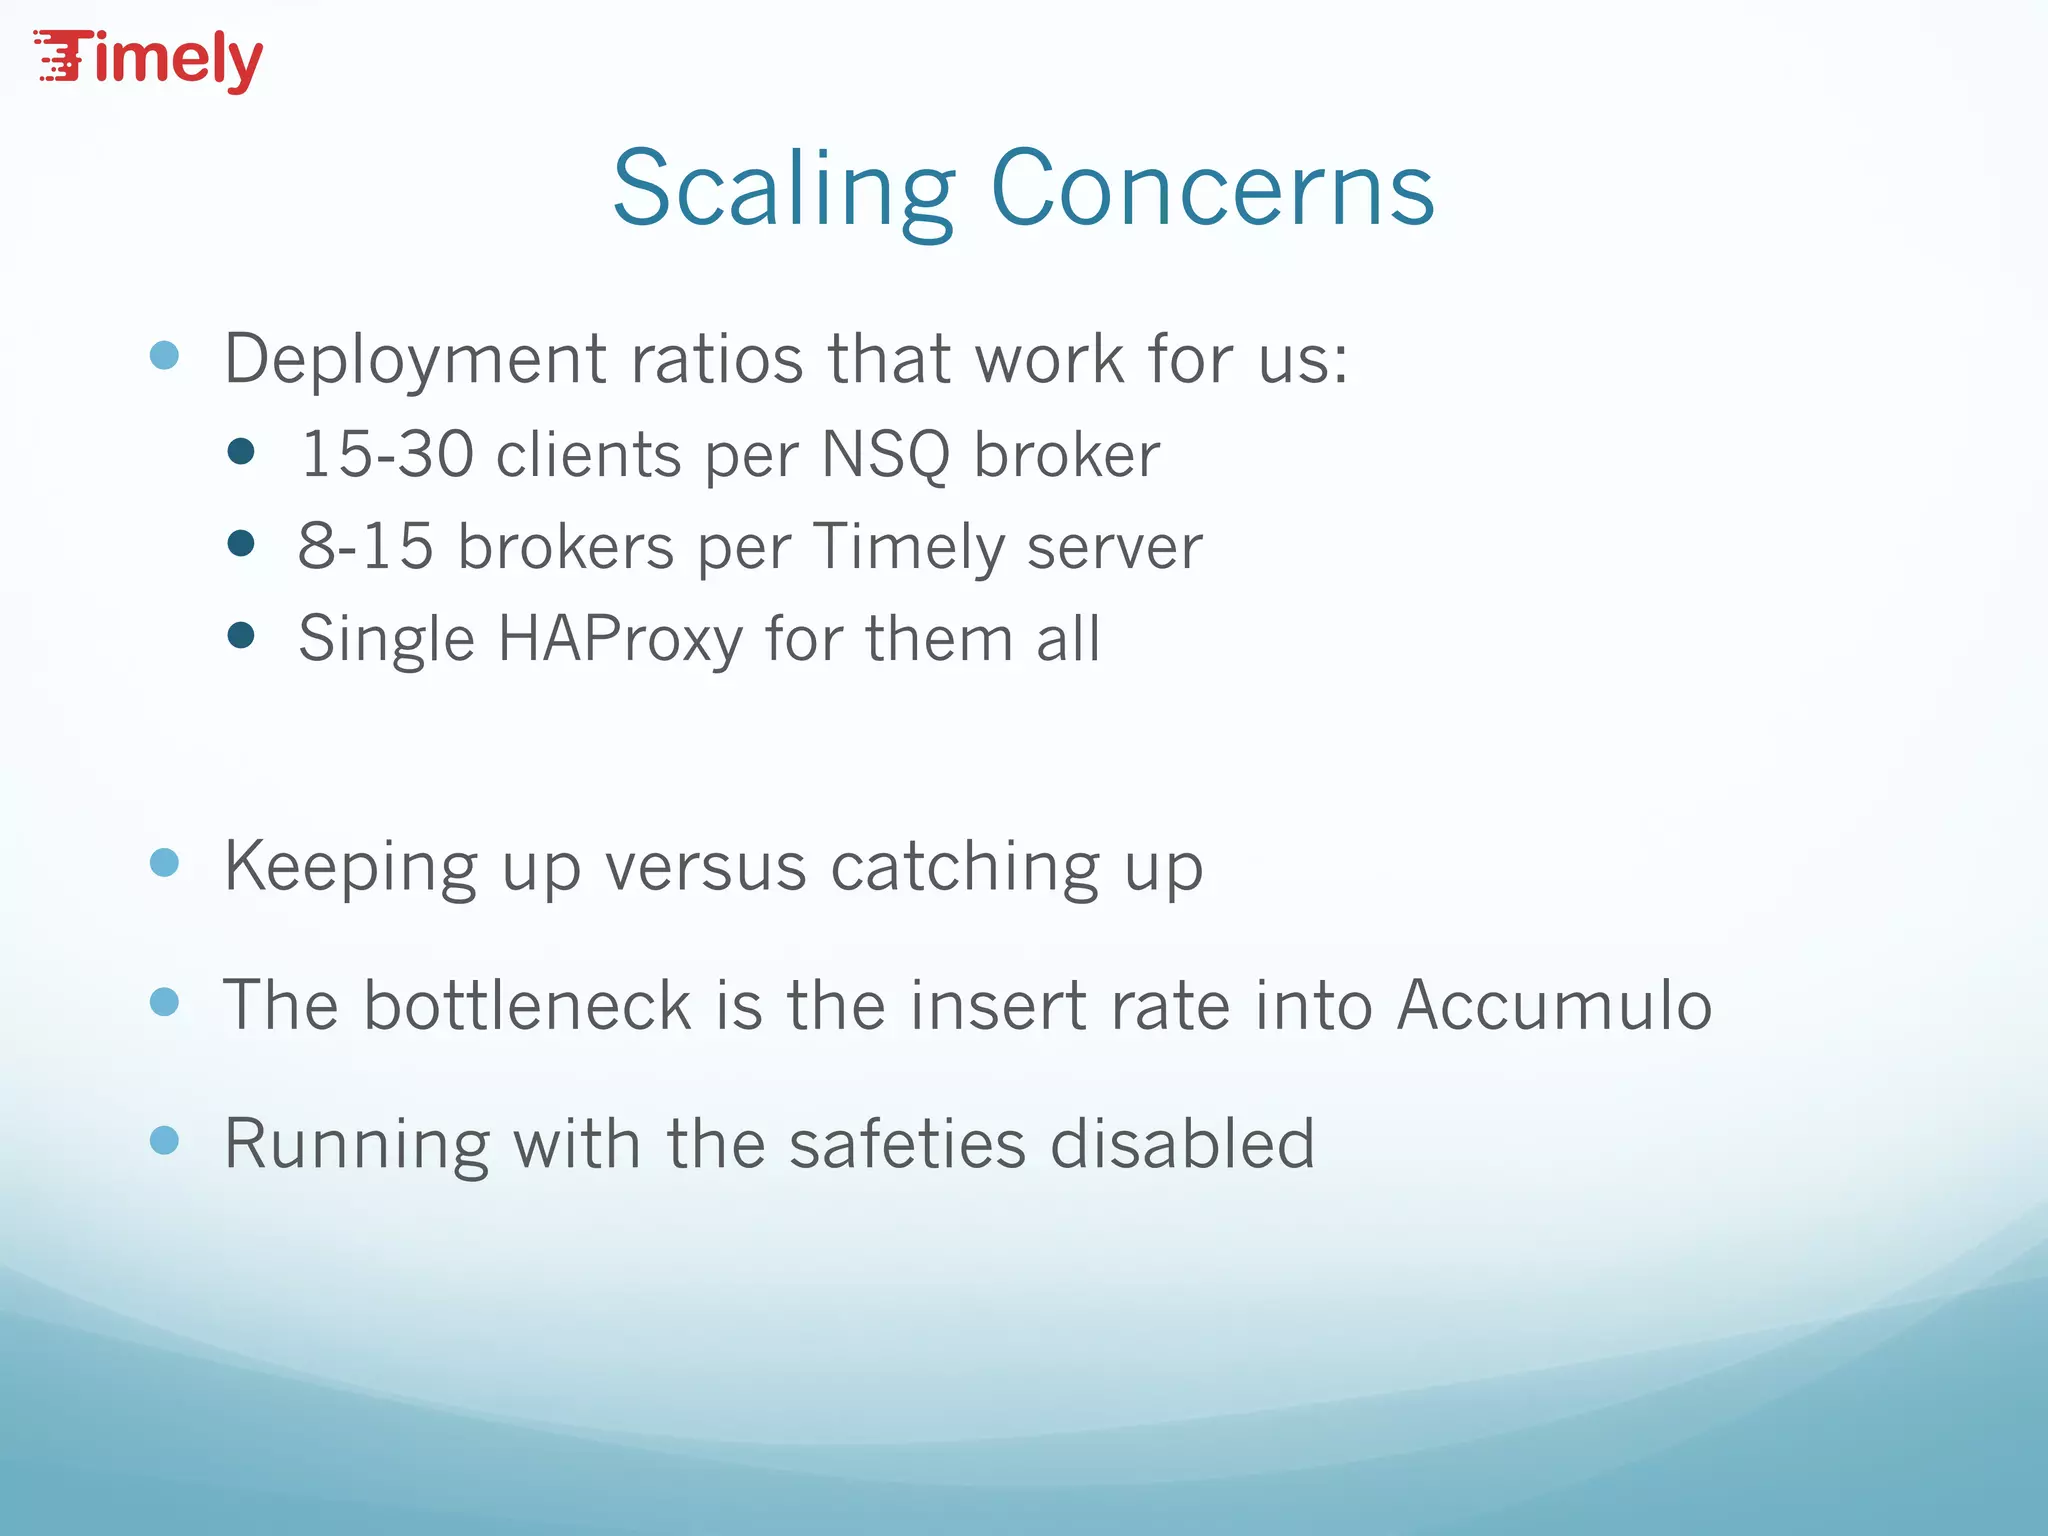
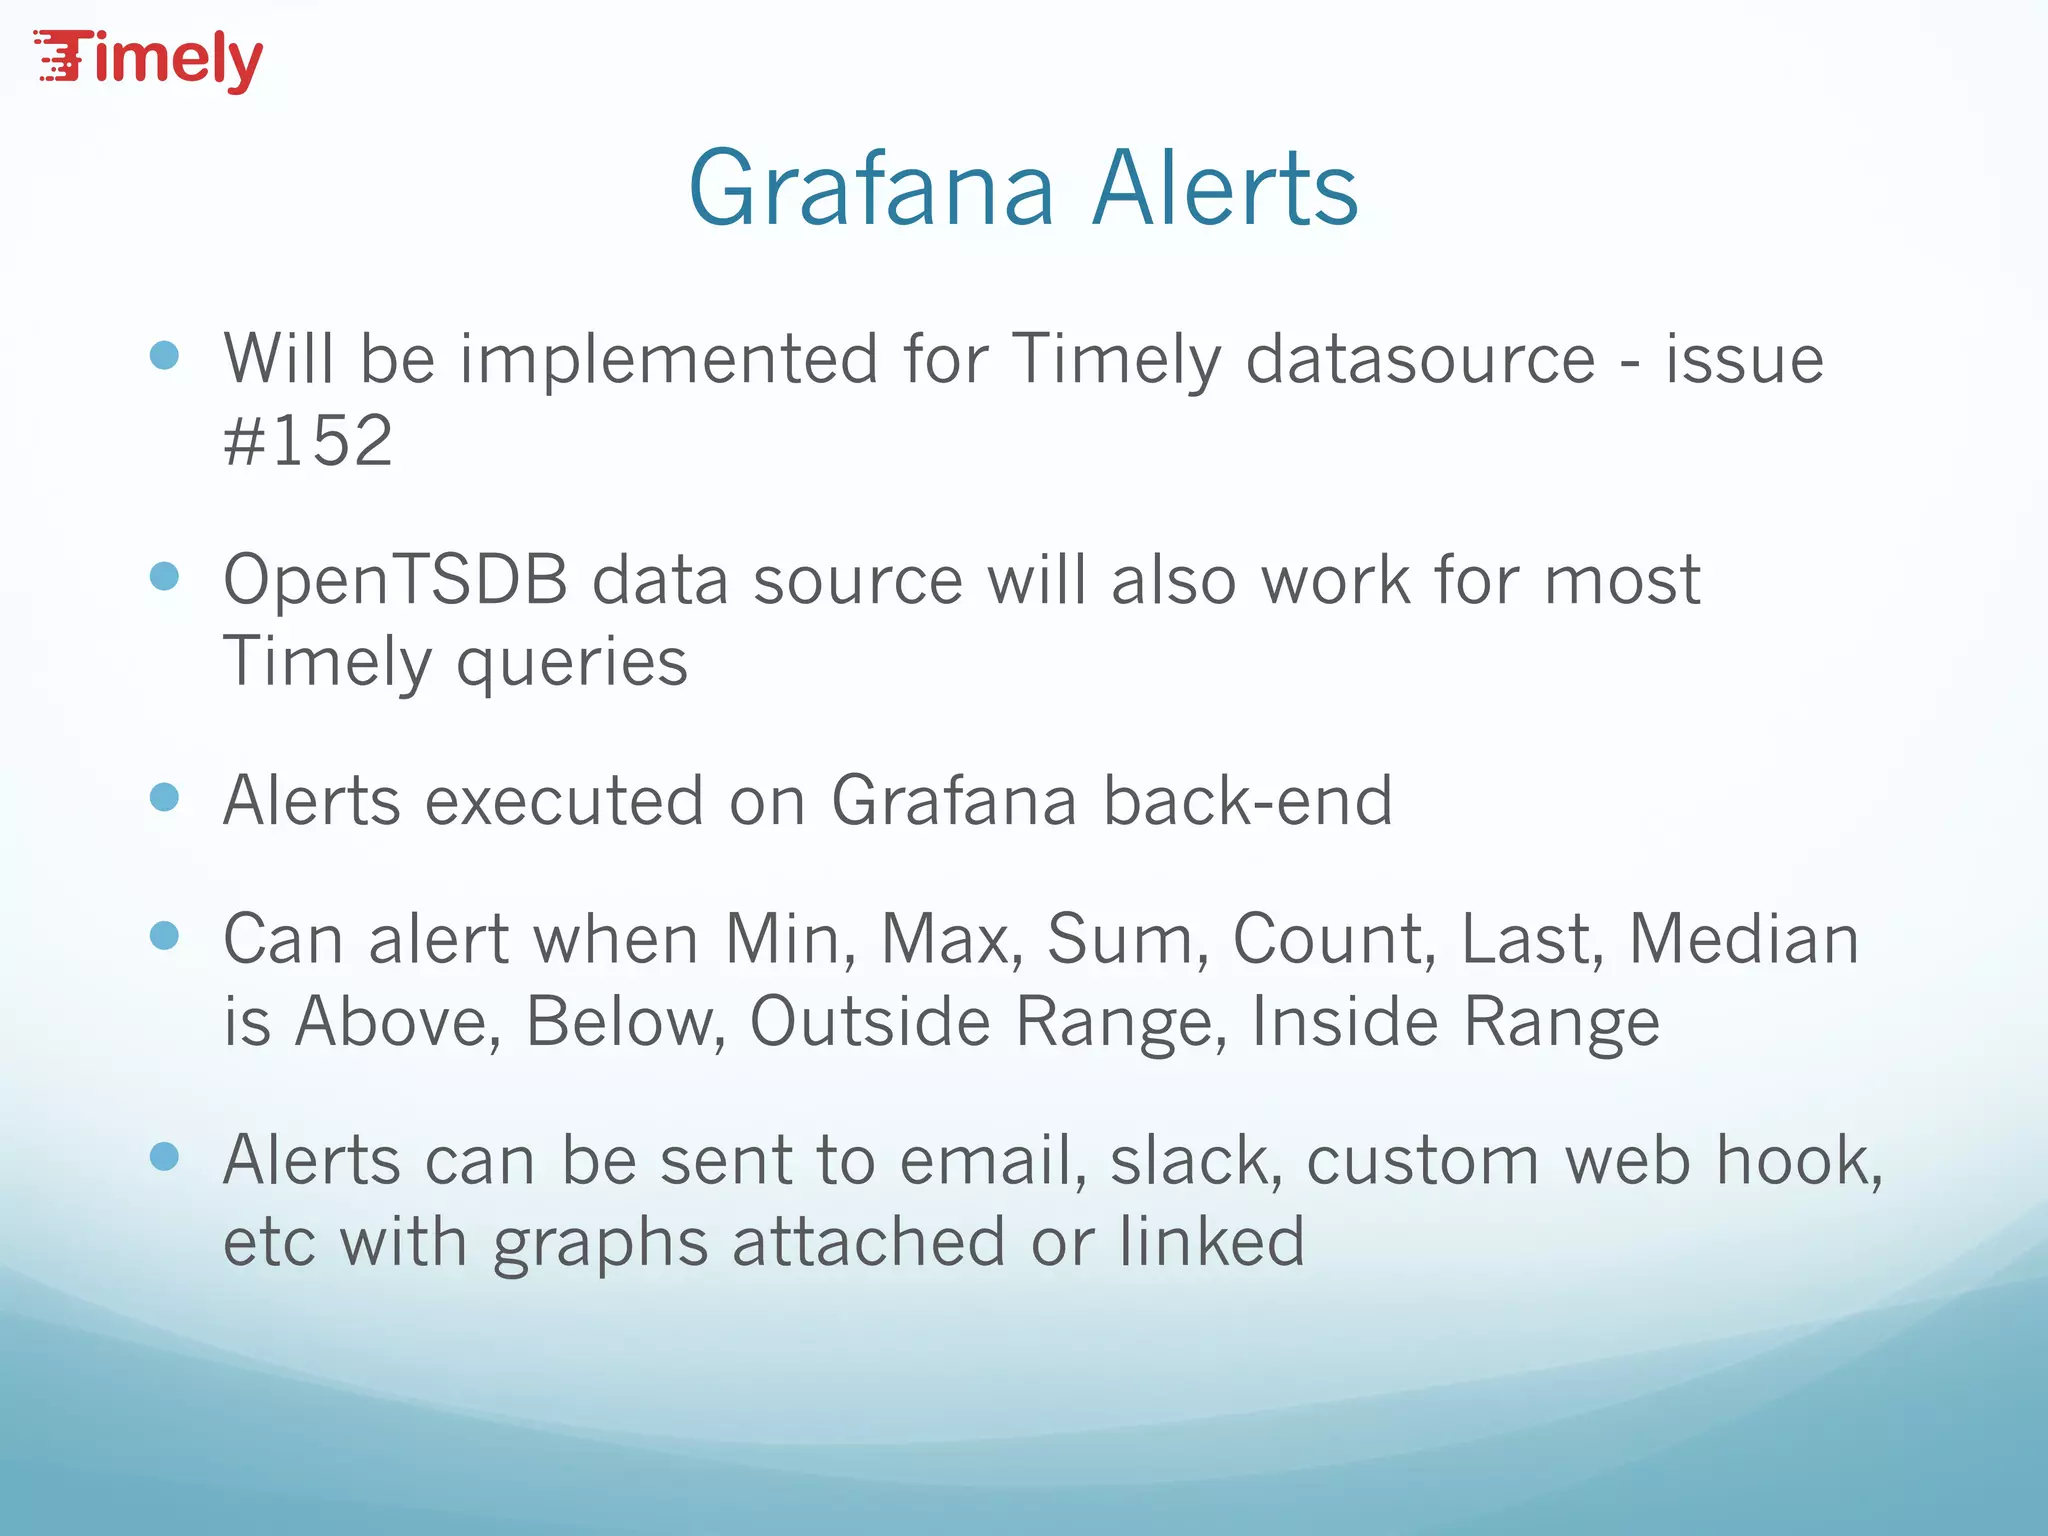
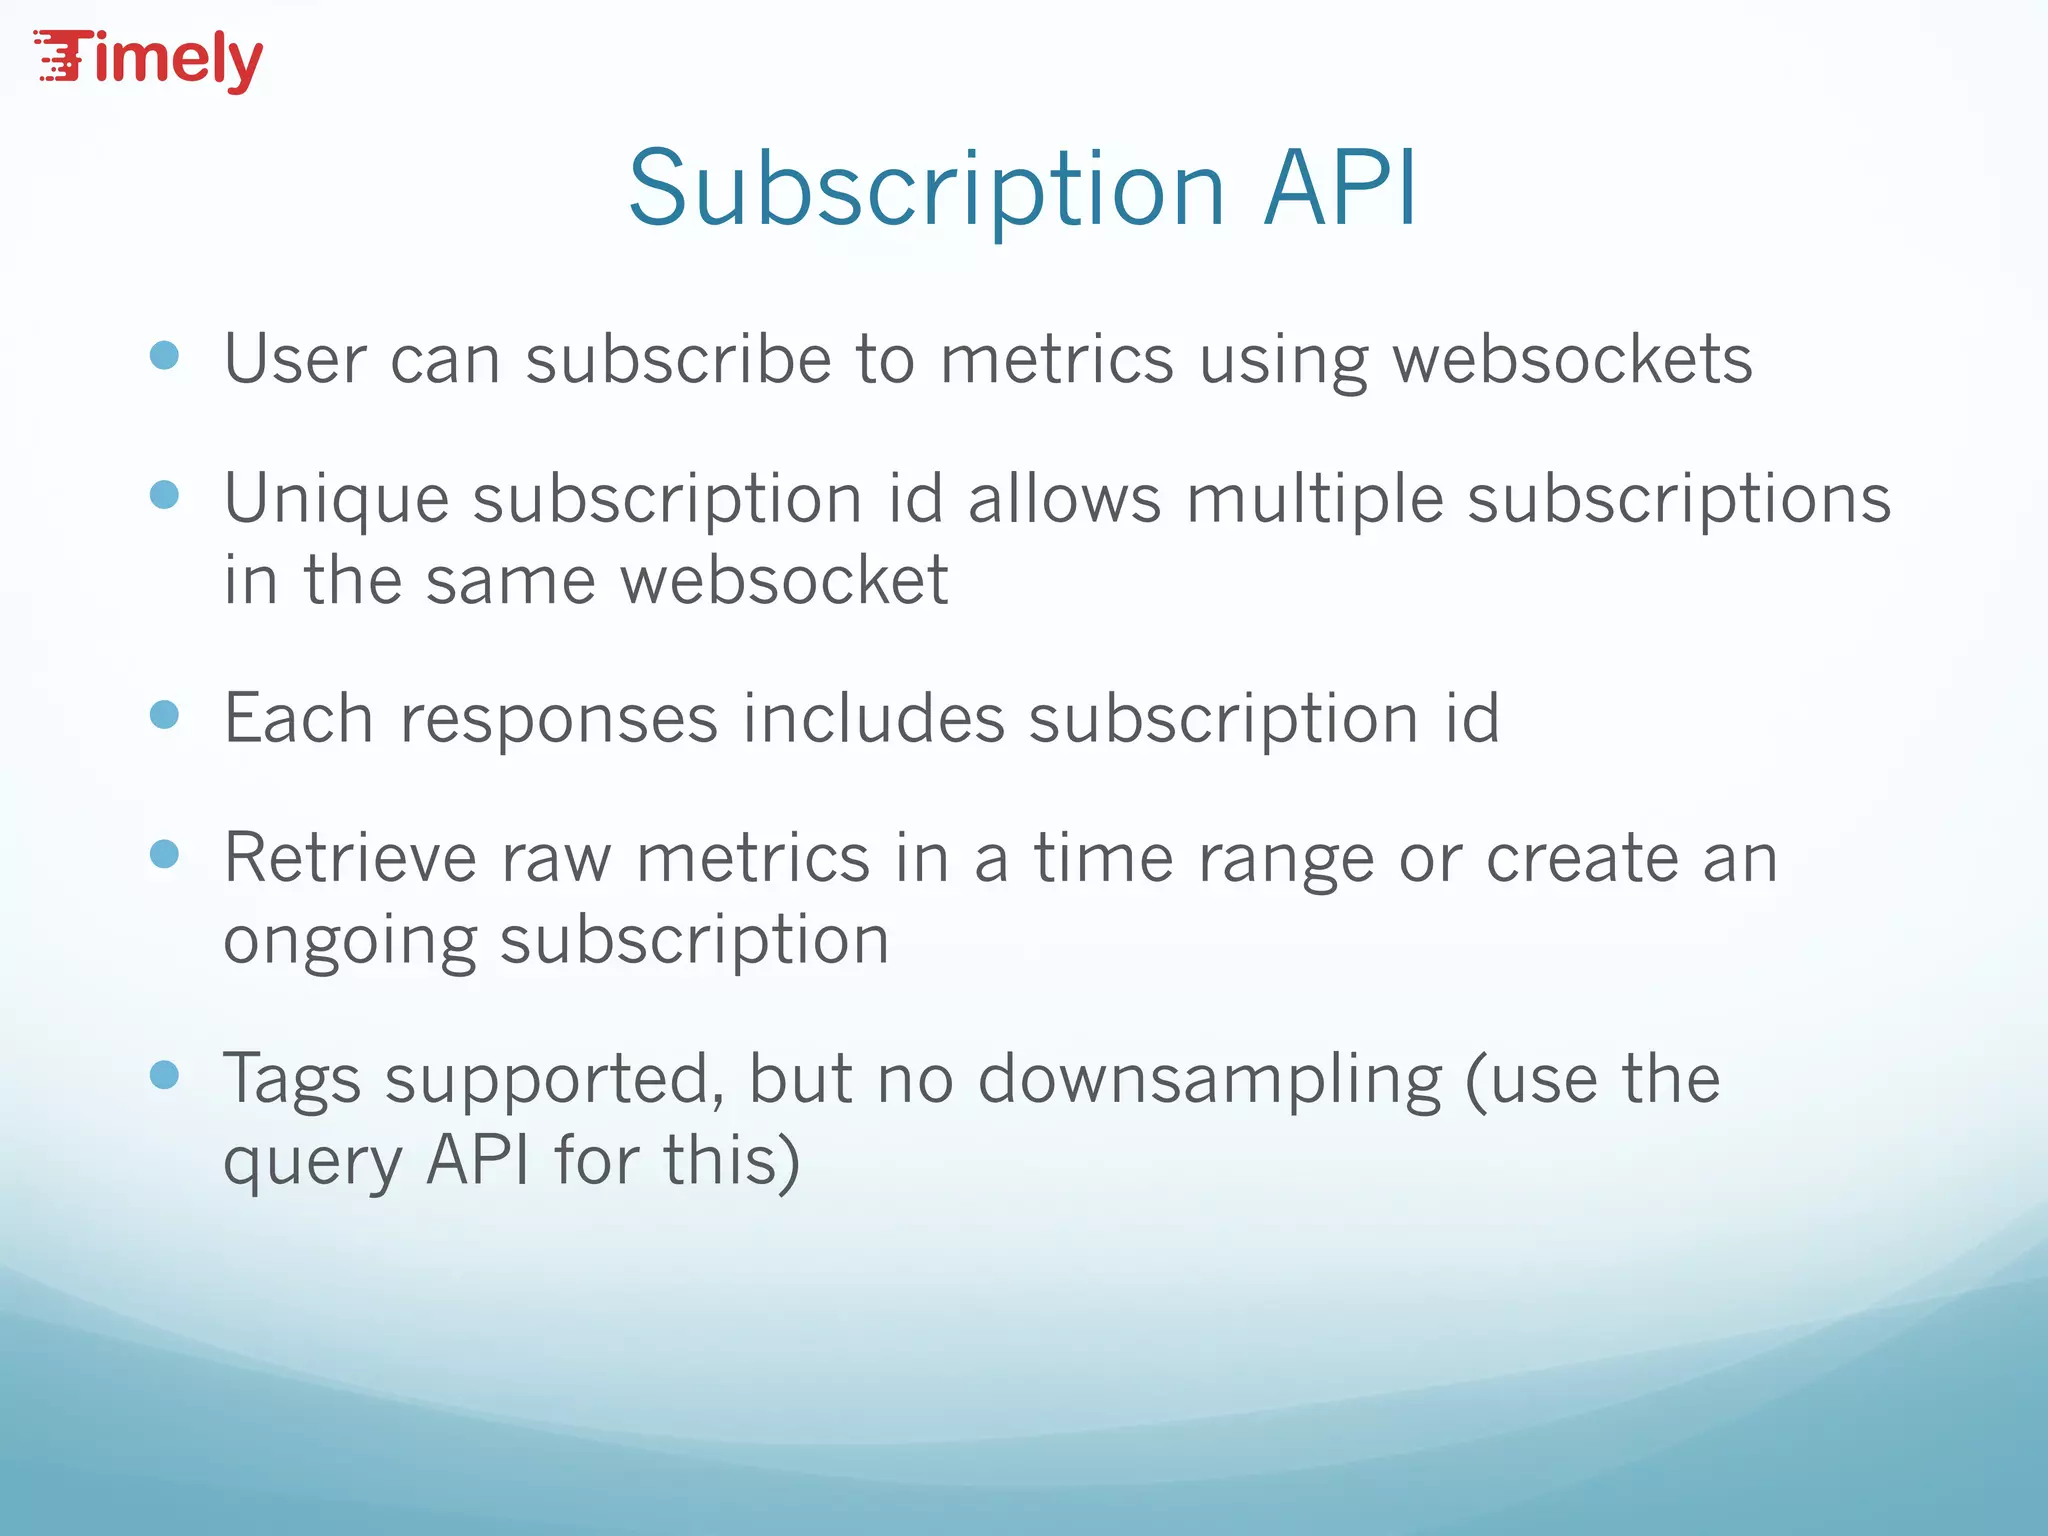
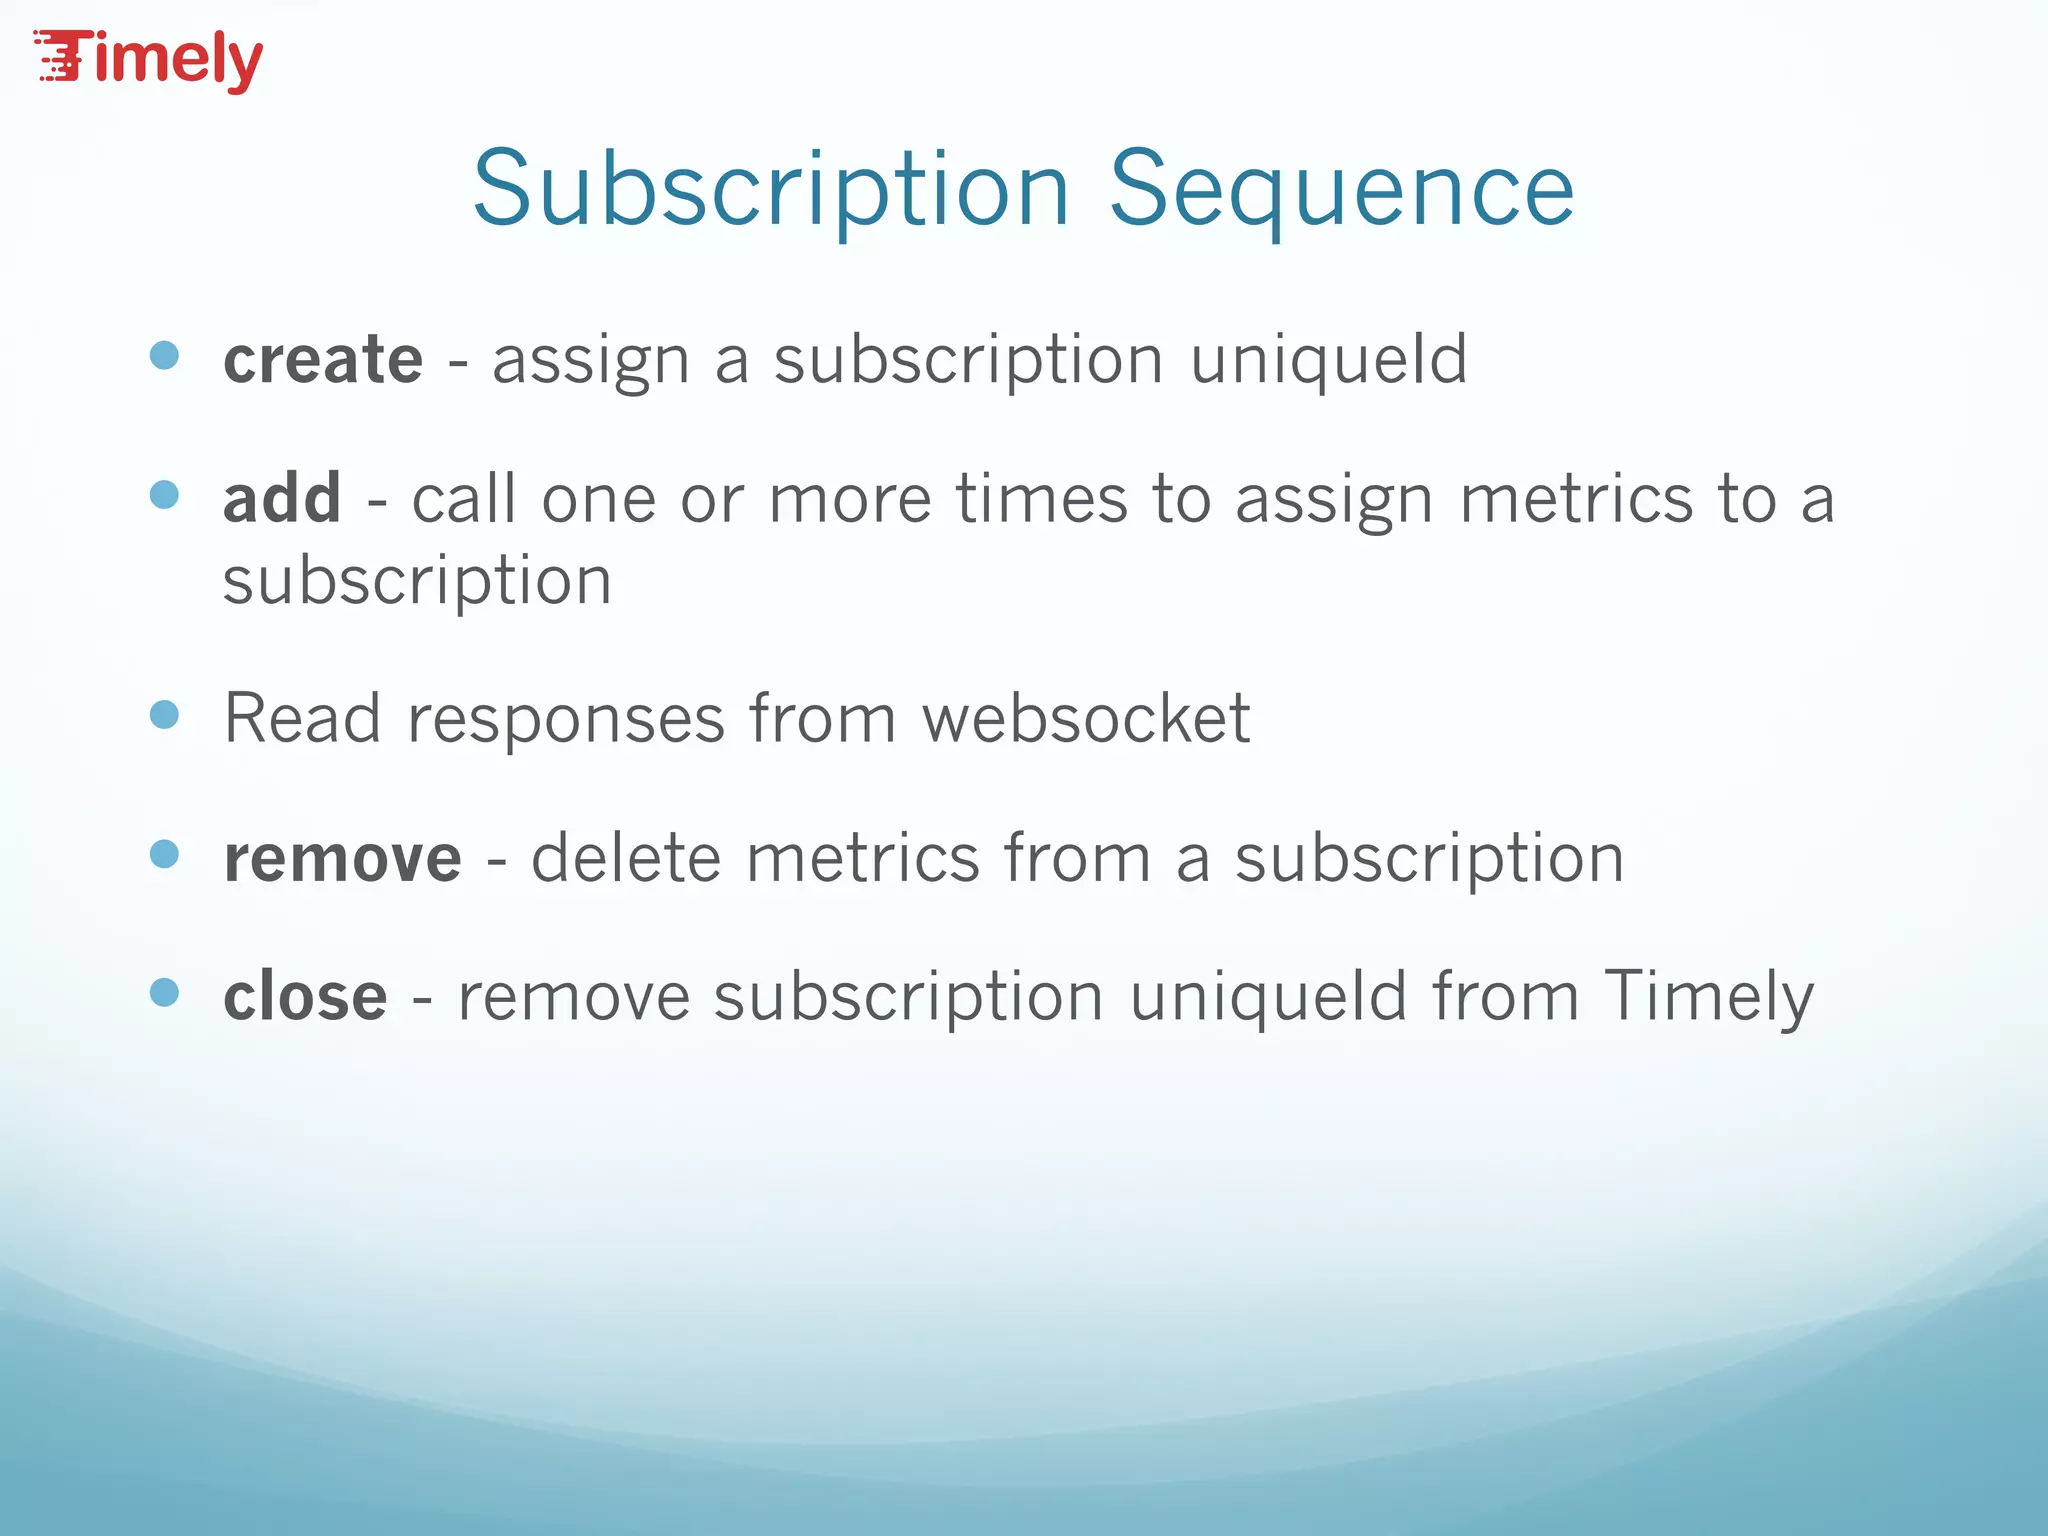
The document outlines the architecture and functioning of a scalable time series database (Timely) developed by Booz Allen Hamilton, which is built on Accumulo and designed for real-time metrics collection and analysis. It discusses key components such as collectd for metric gathering, NSQ for message routing, and Grafana for visualizations and alerts, while also addressing scaling strategies and challenges. Additionally, it shares lessons learned from deployment, monitoring, and data compaction issues encountered during implementation.


![Paul Dix [InfluxData] | InfluxDays Keynote: Future of InfluxDB | InfluxDays N...](https://cdn.slidesharecdn.com/ss_thumbnails/2021-10-26whytimeseries-influxdaysna-211026005527-thumbnail.jpg?width=640&height=640&fit=bounds)

![[DSC Europe 25] Behzad Hosseini - AI Agents in the Wild: Deploying Models tha...](https://cdn.slidesharecdn.com/ss_thumbnails/3qtejajvsjqrzwfept2c-10-251212103250-7f2b1068-thumbnail.jpg?width=640&height=640&fit=bounds)
![[DSC Europe 25] Ivan Peric - Intelligence Swarm Logic and Techno-Functional M...](https://cdn.slidesharecdn.com/ss_thumbnails/7my7c97fsduiccadgavw-2-251212103249-5a03f7c6-thumbnail.jpg?width=640&height=640&fit=bounds)


![[DSC Europe 25] Bassam Maharmeh - Artificial Intelligence: Opportunities and ...](https://cdn.slidesharecdn.com/ss_thumbnails/thhfmr2fqpawzj7hsjpg-5-251211083048-2c23204f-thumbnail.jpg?width=640&height=640&fit=bounds)
![[DSC Europe 25] Uros Pesic - The Reality of AI in Marketing.pdf](https://cdn.slidesharecdn.com/ss_thumbnails/rtkodnmtycovsllvzsyn-9-251215095918-b0c6bfe3-thumbnail.jpg?width=640&height=640&fit=bounds)

![[DSC Europe 25] Miodrag Pesovic & Vladislav Radonjic - Federated Data Archite...](https://cdn.slidesharecdn.com/ss_thumbnails/gsbe3y5it5uhndi4e08e-1-251212103249-f1008e0c-thumbnail.jpg?width=640&height=640&fit=bounds)


![[DSC Europe 25] Branko Urosevic -Rethinking Financial Talent: Integrating Cod...](https://cdn.slidesharecdn.com/ss_thumbnails/8jjrus8ttko6qj64f58f-3-251212103250-642c6374-thumbnail.jpg?width=640&height=640&fit=bounds)


![[DSC Europe 25] Danica Soc - The Science Behind Marketing: Experimentation me...](https://cdn.slidesharecdn.com/ss_thumbnails/c0nofsggs9gw5ucmallr-3-251216103155-56bd64d1-thumbnail.jpg?width=640&height=640&fit=bounds)


