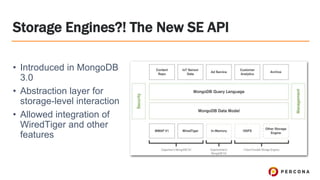
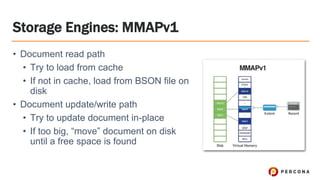
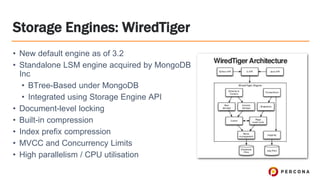
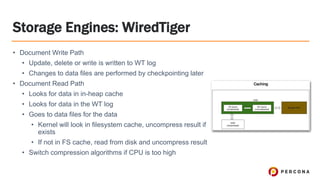
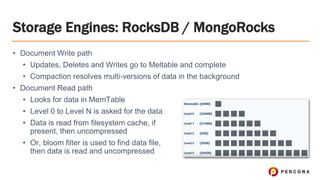
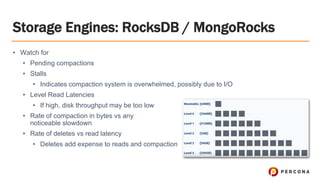
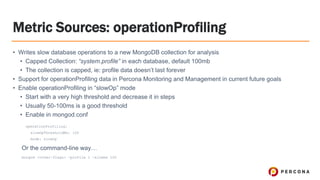
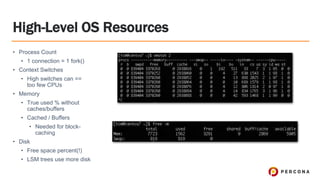
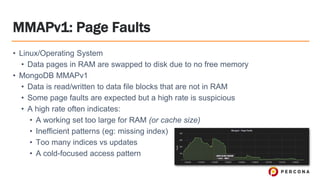
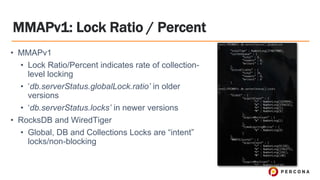
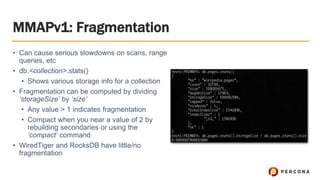
2. About Me
• Joined Percona in January 2016
• Sr Technical Operations Architect for MongoDB
• Previous:
• EA DICE (MySQL DBA)
• EA SPORTS (Sys/NoSQL DBA Ops)
• Amazon/AbeBooks Inc (Sys/MySQL+NoSQL DBA Ops)
• Main techs: MySQL, MongoDB, Cassandra, Solr, Redis, queues, etc
• 10+ years tuning Linux for database workloads (off and on)
• Monitoring techs
• Nagios
• MRTG
• Munin
• Zabbix
• Cacti
• Graphite
• Prometheus
3. Storage Engines
• MMAPv1
• Mostly done by Linux kernel
• WiredTiger
• Default as of 3.2
• Percona In-Memory
• Same metrics as WiredTiger
• RocksDB
• PerconaFT / TokuMX
• Deprecated
• Fractal-tree based storage engine
4. Storage Engines?! The New SE API
• Introduced in MongoDB
3.0
• Abstraction layer for
storage-level interaction
• Allowed integration of
WiredTiger and other
features
5. Storage Engines: MMAPv1
• Default storage engine < 3.2 (now WiredTiger)
• Collection-level locking (common performance bottleneck)
• Monitored via Lock Ratio/Percent metrics
• In-place datafile updating (when possible)
• OS-level operations
• Uses OS-level mmap() to map BSON files on disk <=> memory
• Uses OS-level filesystem cache as block cache
• Much low(er) monitoring visibility
• Database metrics must be gathered from OS-level
• OS-level metrics are more vague
6. Storage Engines: MMAPv1
• Document read path
• Try to load from cache
• If not in cache, load from BSON file on
disk
• Document update/write path
• Try to update document in-place
• If too big, “move” document on disk
until a free space is found
7. • New default engine as of 3.2
• Standalone LSM engine acquired by MongoDB
Inc
• BTree-Based under MongoDB
• Integrated using Storage Engine API
• Document-level locking
• Built-in compression
• Index prefix compression
• MVCC and Concurrency Limits
• High parallelism / CPU utilisation
Storage Engines: WiredTiger
8. Storage Engines: WiredTiger
• Document Write Path
• Update, delete or write is written to WT log
• Changes to data files are performed by checkpointing later
• Document Read Path
• Looks for data in in-heap cache
• Looks for data in the WT log
• Goes to data files for the data
• Kernel will look in filesystem cache, uncompress result if
exists
• If not in FS cache, read from disk and uncompress result
• Switch compression algorithms if CPU is too high
9. Storage Engines: RocksDB / MongoRocks
• MongoRocks developed by
• Tiered level compaction strategy
• First layer is called the MemTable
• N number of on-disk levels
• Compaction is triggered when any level is full
• In-heap Block Cache (default 30% RAM)
• Holds uncompressed data
• BlockCache reduces compression CPU hit
• Kernel-level Page Cache for compressed data
• Space amplification of LSM is about +10%
• Optional ‘counters’: storage.rocksdb.counters
10. Storage Engines: RocksDB / MongoRocks
• Document Write path
• Updates, Deletes and Writes go to Meltable and complete
• Compaction resolves multi-versions of data in the background
• Document Read path
• Looks for data in MemTable
• Level 0 to Level N is asked for the data
• Data is read from filesystem cache, if
present, then uncompressed
• Or, bloom filter is used to find data file,
then data is read and uncompressed
11. Storage Engines: RocksDB / MongoRocks
• Watch for
• Pending compactions
• Stalls
• Indicates compaction system is overwhelmed, possibly due to I/O
• Level Read Latencies
• If high, disk throughput may be too low
• Rate of compaction in bytes vs any
noticeable slowdown
• Rate of deletes vs read latency
• Deletes add expense to reads and compaction
12. Metric Sources: operationProfiling
• Writes slow database operations to a new MongoDB collection for analysis
• Capped Collection: “system.profile” in each database, default 100mb
• The collection is capped, ie: profile data doesn’t last forever
• Support for operationProfiling data in Percona Monitoring and Management in current future goals
• Enable operationProfiling in “slowOp” mode
• Start with a very high threshold and decrease it in steps
• Usually 50-100ms is a good threshold
• Enable in mongod.conf
operationProfiling:
slowOpThresholdMs: 100
mode: slowOp
Or the command-line way…
mongod <other-flags> —profile 1 —slowms 100
13. Metric Sources: operationProfiling
• op/ns/query: type, namespace and query of a profile
• keysExamined: # of index keys examined
• docsExamined: # of docs examined to achieve result
• writeConflicts: # of WCE encountered during update
• numYields: # of times operation yielded for others
• locks: detailed lock statistics
14. Metric Sources: operationProfiling
• nreturned: # of documents returned by the operation
• nmoved: # of documents moved on disk by the operation
• ndeleted/ninserted/nMatched/nModified: self
explanatory
• responseLength: the byte-length of the server response
• millis: execution time in milliseconds
• execStats: detailed statistics explaining the query’s
execution steps
• SHARDING_FILTER = mongos sharded query
• COLLSCAN = no index, 35k docs examined(!)
15. Metric Sources: db.serverStatus()
• A function that dumps status info about MongoDB’s current status
• Think “SHOW FULL STATUS” + “SHOW ENGINE INNODB STATUS”
• Sections
• Asserts
• backgroundFlushing
• connections
• dur (durability)
• extra_info
• globalLock + locks
• network
• opcounters
• opcountersRepl
• repl (replication)
• storageEngine
• mem (memory)
• metrics
• (Optional) wiredTiger
• (Optional) rocksdb
21. Metric Sources: rs.status()
• A function that dumps replication status
• Think “SHOW MASTER STATUS” or “SHOW
SLAVE STATUS”
• Contains
• Replication set name and term
• Member status
• State
• Optime state
• Election state
• Heartbeat state
24. Metric Sources: Log Files
• Interesting details are logged to the mongod/mongos log files
• Slow queries
• Storage engine details (sometimes)
• Index operations
• Chunk moves
• Connections
25. Monitoring: Percona PMM
• Open-source
monitoring from
Percona!
• Based on open-
source technology
• Simple deployment
• Examples in this
demo are from PMM
• 800+ metrics per
ping
26. Monitoring: Prometheus + Grafana
• Percona-Lab GitHub
• grafana_mongodb_dashboards for Grafana
• prometheus_mongodb_exporter for Prometheus
• Sources
• db.serverStatus()
• rs.status()
• sh.status()
• Config-server metadata
• Others and more soon..
• Supports MMAPv1, WT and RocksDB
• node_exporter for Prometheus
• OS-level (mostly Linux) exporter
29. MongoDB Resources and Consumers
• CPU
• System CPU
• FS cache
• Networking
• Disk I/O
• Threading
• User CPU (MongoDB)
• Compression (WiredTiger and RocksDB)
• Session Management
• BSON (de)serialisation
• Filtering / scanning / sorting
• Optimiser
• Disk
• Data file read/writes
• Journaling
• Error logging
• Network
• Query request/response
• Replication
30. High-Level OS Resources
• CPU
• CPU Load Averages
• thread-per-connection
• User vs System CPU
• System is kernel-level
• User is usually Mongo
• IOWAIT
• Can also include network
waits
• IO Time Spent
• “The canary in the gold
mine”
31. High-Level OS Resources
• Process Count
• 1 connection = 1 fork()
• Context Switches
• High switches can ==
too few CPUs
• Memory
• True used % without
caches/buffers
• Cached / Buffers
• Needed for block-
caching
• Disk
• Free space percent(!)
• LSM trees use more disk
32. MMAPv1: Page Faults
• Linux/Operating System
• Data pages in RAM are swapped to disk due to no free memory
• MongoDB MMAPv1
• Data is read/written to data file blocks that are not in RAM
• Some page faults are expected but a high rate is suspicious
• A high rate often indicates:
• A working set too large for RAM (or cache size)
• Inefficient patterns (eg: missing index)
• Too many indices vs updates
• A cold-focused access pattern
33. MMAPv1: Lock Ratio / Percent
• MMAPv1
• Lock Ratio/Percent indicates rate of collection-
level locking
• ‘db.serverStatus.globalLock.ratio’ in older
versions
• ‘db.serverStatus.locks’ in newer versions
• RocksDB and WiredTiger
• Global, DB and Collections Locks are “intent”
locks/non-blocking
34. MMAPv1: Fragmentation
• Can cause serious slowdowns on scans, range
queries, etc
• db.<collection>.stats()
• Shows various storage info for a collection
• Fragmentation can be computed by dividing
‘storageSize’ by ‘size’
• Any value > 1 indicates fragmentation
• Compact when you near a value of 2 by
rebuilding secondaries or using the
‘compact’ command
• WiredTiger and RocksDB have little/no
fragmentation
35. MMAPv1: Background Flushing
• Stats on the count/time taken to flush in the background
• If ‘average_ms’ grow continuously, writes will eventually go direct to disk based on:
• Linux sysctl ‘vm.dirty_ratio’
• Writes go to disk if dirty page ratio exceeds this number
• Linux sysctl ‘vm.dirty_background_ratio’
36. Rollbacks
• JSON file written to ‘rollback’ dir on-disk when PRIMARY crashes
when ahead of SECONDARYs
• Monitor for this file existing
37. WiredTiger + RocksDB: Checkpoints/Compactions
• Moves changes to real data files
• Causes a massive spike in disk I/O
• Monitor in combination with
• CPU IOWAIT %
• Disk IO Time Spent
38. Replication Lag and Oplog Time Range
• Replication in MongoDB is lightweight BUT it is
single threaded
• Shard for more replication throughput
• Replication Lag/Delay
• Subtract PRIMARY and SECONDARY ‘optime’
• Oplog Time Range
• Length of oplog from start -> finish
• Equal to the amount of time to rebuild a node
without needing a full re-sync!
• More oplog changes == shorter time range
39. Scanned and Moved
• Indicates random read or write I/O
• Scanned
• Number of documents/objects scanned
• A high rate indicates inefficient query
patterns, lack of indices, etc
• Moved
• Usually happens in MMAPv1 only
• Document is too big to be written in-
place and is moved elsewhere
40. Network
• Max connections
• Ensure max available connections is not exceed
• 1 connection = roughly 1MB of RAM!
• Consider connection pools if too many connections are needed
41. Low-level OS Resources
• Linux Virtual Memory
• vm.swappiness vs swapping rate
• vm.dirty_ratio vs op latency
• Consider lowering to match RAID controller
• Filesystem cached vs Block-device read-ahead
• Linux Network Stack
• Throughput vs total capacity
• SYN Backlogs for TCP
• TIME_WAIT connections
• Network errors/retransmit
• Disk
• Average wait time
• Percent utilisation
42. High-level Monitoring Tips
• Polling Frequency
• A lot can happen in 1-10 seconds!
• History
• Have another app/launch to compare with
• Annotate maintenances, launches, DDoS, important
events
• What to Monitor
• Fetch more than you graph, there’s no time machine
• (IMHO) monitor until it hurts, then just a bit less than
that