Downloaded 36 times


![How you’ll know
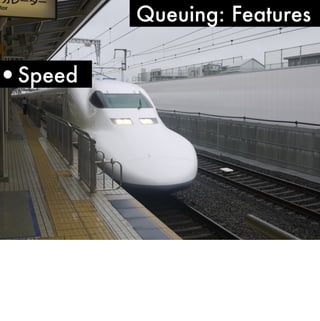
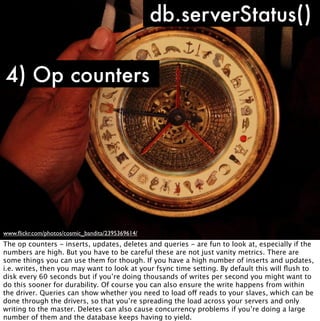
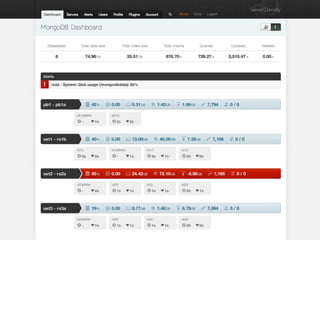
1) Slow queries
Thu Oct 14 17:01:11 [conn7410] update sd.apiLog
query: { c: "android/setDeviceToken", a: 1466, u:
"blah", ua: "Server Density Android" } 51926ms
www.flickr.com/photos/tonivc/2283676770/
Although not the only reason, a slow query does indicate insufficient memory. This might be
that you’ve not got the most optimal indexes for a query but if indexes are being used and
it’s still slow, it could be because of a disk i/o bottleneck because the data isn’t in RAM.
Doing an explain on the query will show you what indexes it is using.](https://image.slidesharecdn.com/mongotokyo11-monitoringqueueing-111115022246-phpapp01/85/MongoDB-Tokyo-Monitoring-and-Queueing-37-320.jpg)

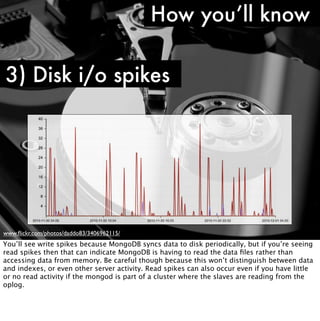


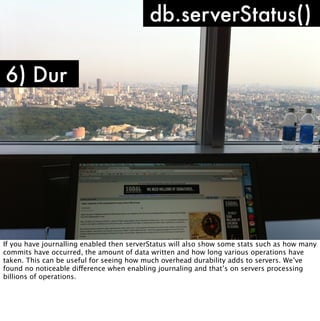
![Fri Nov 19 17:24:32 [mongosMain] Listener: accept() returns -1 errno:24 Too many open files
Fri Nov 19 17:24:32 [mongosMain] Listener: accept() returns -1 errno:24 Too many open files
Fri Nov 19 17:24:32 [mongosMain] Listener: accept() returns -1 errno:24 Too many open files
Fri Nov 19 17:24:32 [mongosMain] Listener: accept() returns -1 errno:24 Too many open files
Fri Nov 19 17:24:32 [mongosMain] Listener: accept() returns -1 errno:24 Too many open files
Fri Nov 19 17:24:32 [mongosMain] Listener: accept() returns -1 errno:24 Too many open files
Fri Nov 19 17:24:32 [mongosMain] Listener: accept() returns -1 errno:24 Too many open files
Fri Nov 19 17:24:32 [mongosMain] Listener: accept() returns -1 errno:24 Too many open files
Fri Nov 19 17:24:32 [mongosMain] Listener: accept() returns -1 errno:24 Too many open files
Fri Nov 19 17:24:32 [mongosMain] Listener: accept() returns -1 errno:24 Too many open files
Fri Nov 19 17:24:32 [mongosMain] Listener: accept() returns -1 errno:24 Too many open files
Fri Nov 19 17:24:32 [mongosMain] Listener: accept() returns -1 errno:24 Too many open files
Fri Nov 19 17:24:32 [mongosMain] Listener: accept() returns -1 errno:24 Too many open files
Fri Nov 19 17:24:32 [conn2335] getaddrinfo("rs1b") failed: No address associated with hostname
Fri Nov 19 17:24:32 [conn2335] getaddrinfo("rs1d") failed: No address associated with hostname
Fri Nov 19 17:24:32 [conn2335] getaddrinfo("rs1c") failed: No address associated with hostname
Fri Nov 19 17:24:32 [conn2335] getaddrinfo("rs2b") failed: No address associated with hostname
Fri Nov 19 17:24:32 [conn2335] getaddrinfo("rs2d") failed: No address associated with hostname
Fri Nov 19 17:24:32 [conn2335] getaddrinfo("rs2c") failed: No address associated with hostname
Fri Nov 19 17:24:32 [conn2335] getaddrinfo("rs2a") failed: No address associated with hostname
Fri Nov 19 17:24:32 [conn2268] checkmaster: rs2b:27018 { setName: "set2", ismaster: false, secondary: true, hosts: [ "rs2b:27018", "rs2d:27018", "rs2c:27018", "rs2a:27018" ], arbiters:
[ "rs2arbiter:27018" ], primary: "rs2a:27018", maxBsonObjectSize: 8388608, ok: 1.0 }
MessagingPort say send() errno:9 Bad file descriptor (NONE)
Fri Nov 19 17:24:32 [conn2268] checkmaster: caught exception rs2d:27018 socket exception
Fri Nov 19 17:24:32 [conn2268] MessagingPort say send() errno:9 Bad file descriptor (NONE)
Fri Nov 19 17:24:32 [conn2268] checkmaster: caught exception rs2c:27018 socket exception
Fri Nov 19 17:24:32 [conn2268] MessagingPort say send() errno:9 Bad file descriptor (NONE)
Fri Nov 19 17:24:32 [conn2268] checkmaster: caught exception rs2a:27018 socket exception
Fri Nov 19 17:24:33 [conn2330] getaddrinfo("rs1a") failed: No address associated with hostname
Fri Nov 19 17:24:33 [conn2330] getaddrinfo("rs1b") failed: No address associated with hostname
Fri Nov 19 17:24:33 [conn2330] getaddrinfo("rs1d") failed: No address associated with hostname
Fri Nov 19 17:24:33 [conn2330] getaddrinfo("rs1c") failed: No address associated with hostname
Fri Nov 19 17:24:33 [conn2327] getaddrinfo("rs2b") failed: No address associated with hostname
Fri Nov 19 17:24:33 [conn2327] getaddrinfo("rs2d") failed: No address associated with hostname
Fri Nov 19 17:24:33 [conn2327] getaddrinfo("rs2c") failed: No address associated with hostname
Fri Nov 19 17:24:33 [conn2327] getaddrinfo("rs2a") failed: No address associated with hostname
Fri Nov 19 17:24:33 [conn2126] getaddrinfo("rs2b") failed: No address associated with hostname
Fri Nov 19 17:24:33 [conn2126] getaddrinfo("rs2d") failed: No address associated with hostname
Fri Nov 19 17:24:33 [conn2126] getaddrinfo("rs2c") failed: No address associated with hostname
Fri Nov 19 17:24:33 [conn2126] getaddrinfo("rs2a") failed: No address associated with hostname
Fri Nov 19 17:24:33 [conn2343] getaddrinfo("rs1b") failed: No address associated with hostname
Fri Nov 19 17:24:33 [conn2343] getaddrinfo("rs1d") failed: No address associated with hostname
Fri Nov 19 17:24:33 [conn2343] getaddrinfo("rs1c") failed: No address associated with hostname
Fri Nov 19 17:24:34 [conn2332] getaddrinfo("rs1b") failed: No address associated with hostname
Fri Nov 19 17:24:34 [conn2332] getaddrinfo("rs1d") failed: No address associated with hostname
Fri Nov 19 17:24:34 [conn2332] getaddrinfo("rs1c") failed: No address associated with hostname
Fri Nov 19 17:24:34 [conn2332] getaddrinfo("rs2b") failed: No address associated with hostname
Fri Nov 19 17:24:34 [conn2332] getaddrinfo("rs2d") failed: No address associated with hostname
Fri Nov 19 17:24:34 [conn2332] getaddrinfo("rs2c") failed: No address associated with hostname
Fri Nov 19 17:24:34 [conn2332] getaddrinfo("rs2a") failed: No address associated with hostname
Fri Nov 19 17:24:34 [conn2343] getaddrinfo("rs2d") failed: No address associated with hostname
Fri Nov 19 17:24:34 [conn2343] getaddrinfo("rs2c") failed: No address associated with hostname
Fri Nov 19 17:24:34 [conn2343] getaddrinfo("rs2a") failed: No address associated with hostname
Fri Nov 19 17:24:34 [conn2343] trying reconnect to rs2d:27018
Fri Nov 19 17:24:34 [conn2343] getaddrinfo("rs2d") failed: No address associated with hostname
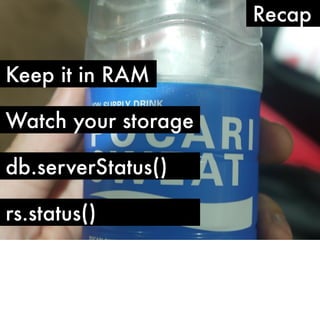
We’ve recently had this problem and it manifests itself by the logs filling up all available disk
Fri Nov 19 17:24:34 [conn2343] reconnect rs2d:27018 failed
space instantly, and in some cases completely crashing the server.
Fri Nov 19 17:24:34 [conn2343] MessagingPort say send() errno:9 Bad file descriptor (NONE)
Fri Nov 19 17:24:34 [conn2343] trying reconnect to rs2c:27018
Fri Nov 19 17:24:34 [conn2343] getaddrinfo("rs2c") failed: No address associated with hostname
Fri Nov 19 17:24:34 [conn2343] reconnect rs2c:27018 failed
Fri Nov 19 17:24:34 [conn2343] MessagingPort say send() errno:9 Bad file descriptor (NONE)
Fri Nov 19 17:24:34 [conn2343] trying reconnect to rs2a:27018
Fri Nov 19 17:24:34 [conn2343] getaddrinfo("rs2a") failed: No address associated with hostname
Fri Nov 19 17:24:34 [conn2343] reconnect rs2a:27018 failed
Fri Nov 19 17:24:34 [conn2343] MessagingPort say send() errno:9 Bad file descriptor (NONE)
Fri Nov 19 17:24:35 [conn2343] checkmaster: rs2b:27018 { setName: "set2", ismaster: false, secondary: true, hosts: [ "rs2b:27018", "rs2d:27018", "rs2c:27018", "rs2a:27018" ], arbiters:
[ "rs2arbiter:27018" ], primary: "rs2a:27018", maxBsonObjectSize: 8388608, ok: 1.0 }
MessagingPort say send() errno:9 Bad file descriptor (NONE)](https://image.slidesharecdn.com/mongotokyo11-monitoringqueueing-111115022246-phpapp01/85/MongoDB-Tokyo-Monitoring-and-Queueing-47-320.jpg)


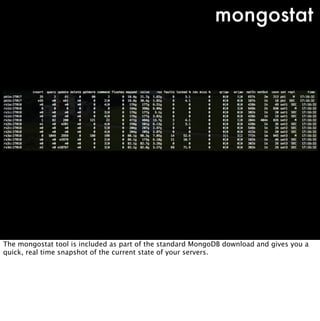


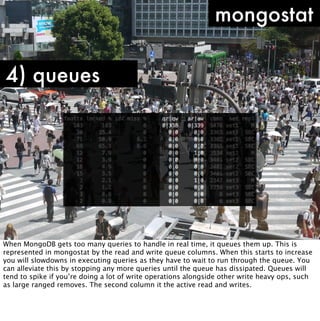


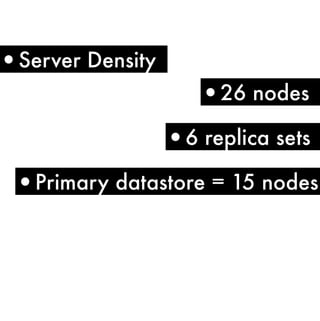
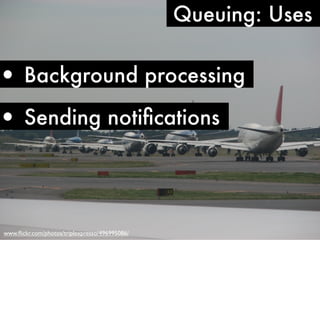
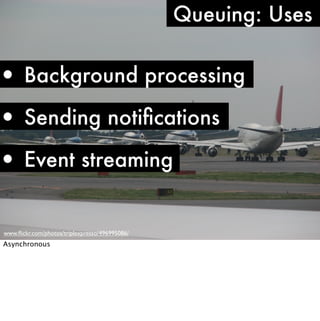
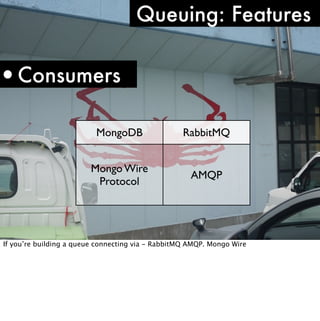
The document discusses using MongoDB as both a primary data store and queueing system for Server Density. It describes how Server Density implemented queuing functionality in MongoDB using the findAndModify command to atomically retrieve and update documents. It also provides an overview of monitoring considerations for MongoDB in production, including keeping indexes and frequently accessed data in memory, watching for disk I/O spikes or slow queries that may indicate insufficient memory, and using db.serverStatus() to monitor connection usage and check for limits.


![[2C1] 아파치 피그를 위한 테즈 연산 엔진 개발하기 최종](https://cdn.slidesharecdn.com/ss_thumbnails/2b1-140929191628-phpapp01-thumbnail.jpg?width=640&height=640&fit=bounds)