The document discusses 10 key performance indicators for MongoDB:
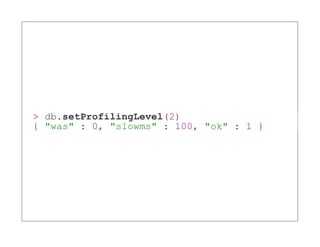
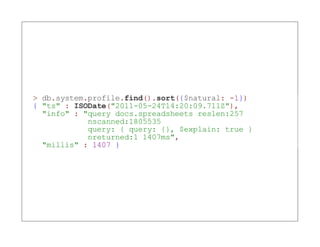
1) Slow operations using the profiler
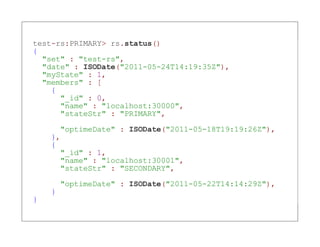
2) Replication lag by checking oplog timestamps
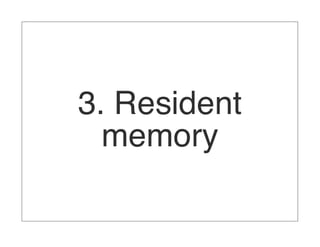
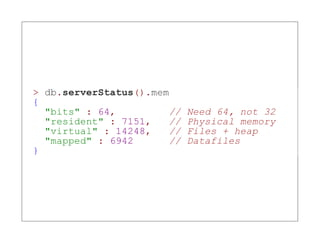
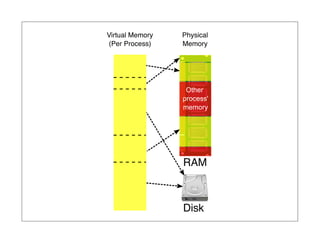
3) High resident memory usage indicating paging is occurring
4) High page faults
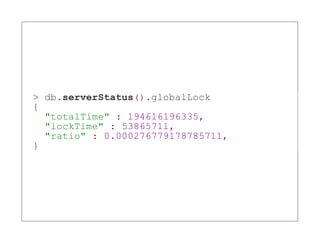
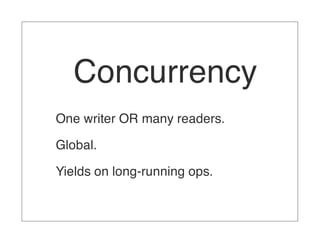
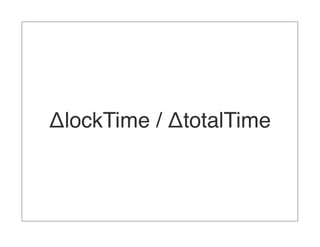
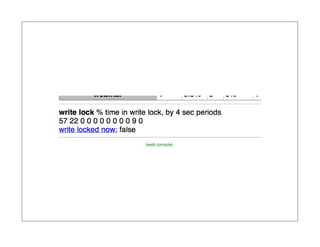
5) High write lock percentage indicating concurrency issues
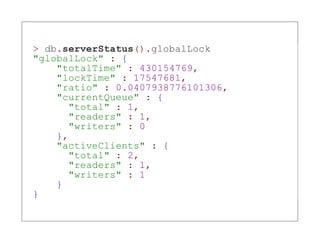
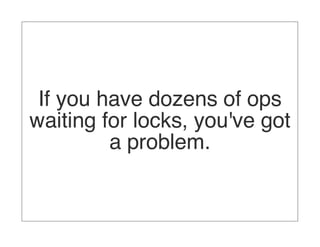
6) Large reader/writer queues indicating lock contention
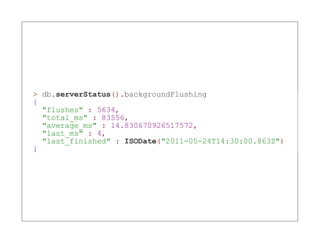
7) Frequent background flushing indicating I/O issues
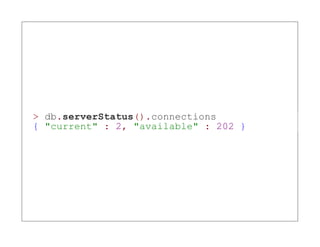
8) Too many connections
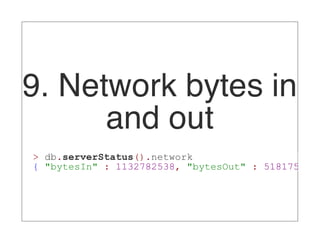
9) High network traffic
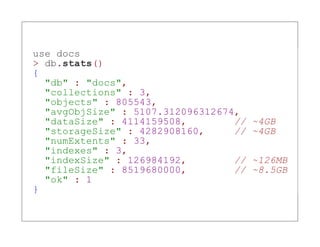
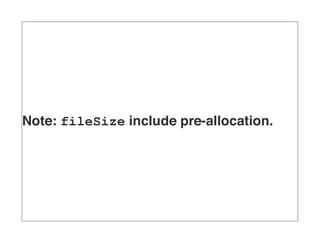
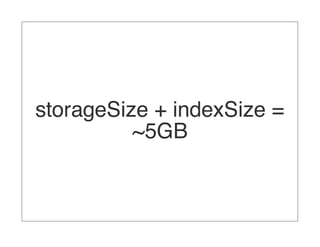
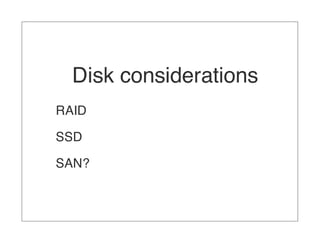
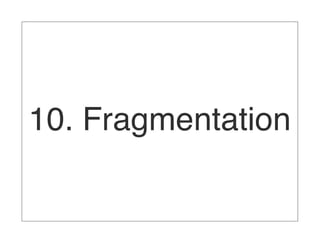
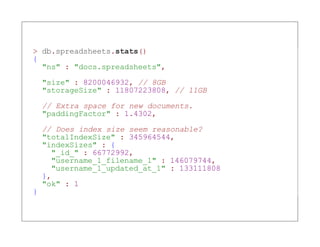
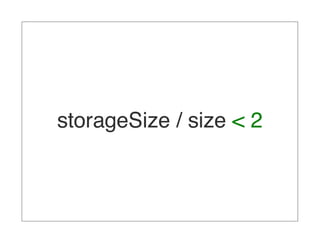
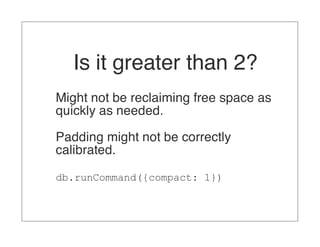
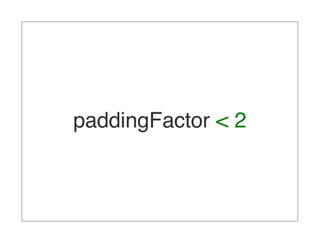
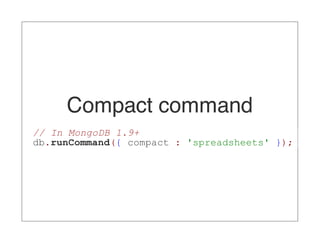
10) Collection fragmentation leading to increased storage size
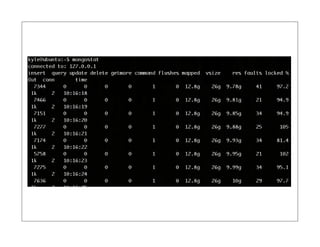
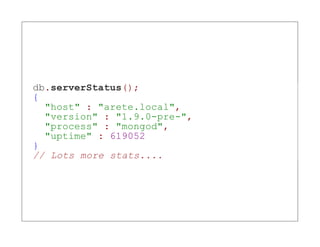
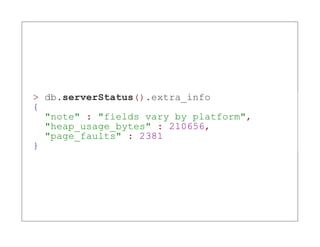
It provides examples of how to check for each indicator using the db.serverStatus() command.


![Here's how they appear in the log:
Sun May 22 19:01:47 [conn10]
query docs.spreadsheets ntoreturn:100 reslen:510436
nscanned:19976 { username: "Minner, Cori" }
nreturned:100 147ms](https://image.slidesharecdn.com/4ddd57d1575308709b000001-110526205347-phpapp02/85/10-Key-MongoDB-Performance-Indicators-19-320.jpg)
![> db.currentOp()
{
"inprog" : [
{
"opid" : 194285,
"active" : true,
"lockType" : "read",
"waitingForLock" : true,
"secs_running" : 0,
"op" : "query",
"ns" : "docs.spreadsheets",
"query" : {
"username" : "Auxier, Han"
},
"client" : "127.0.0.1:64918",
"desc" : "conn"
}
]
}](https://image.slidesharecdn.com/4ddd57d1575308709b000001-110526205347-phpapp02/85/10-Key-MongoDB-Performance-Indicators-39-320.jpg)


![[Devil's camp 2019] 혹시 Elixir 아십니까? 정.말.갓.언.어.입.니.다](https://cdn.slidesharecdn.com/ss_thumbnails/devilscamp2019-elixirintroduce-190630161657-thumbnail.jpg?width=640&height=640&fit=bounds)
![[오픈소스컨설팅]Java Performance Tuning](https://cdn.slidesharecdn.com/ss_thumbnails/javaperformanetuning-150408192031-conversion-gate01-thumbnail.jpg?width=640&height=640&fit=bounds)


![[译]No sql生态系统](https://cdn.slidesharecdn.com/ss_thumbnails/nosql-110624114358-phpapp02-thumbnail.jpg?width=640&height=640&fit=bounds)


