Download as PDF, PPTX


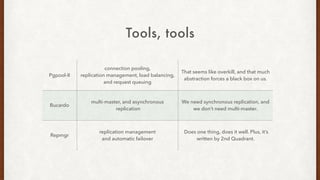
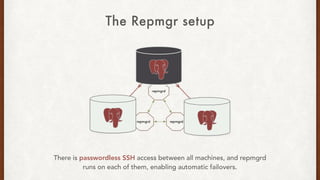
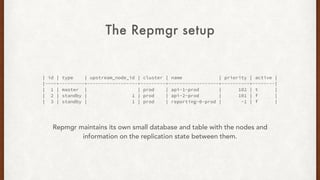
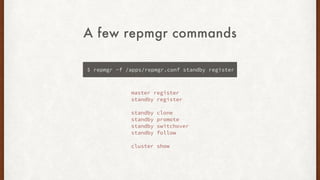
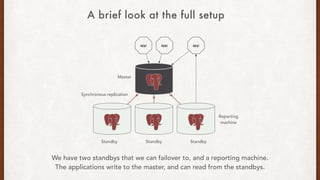

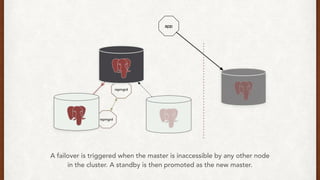
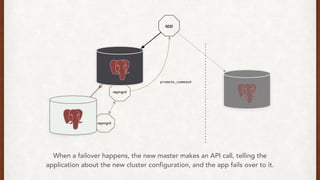
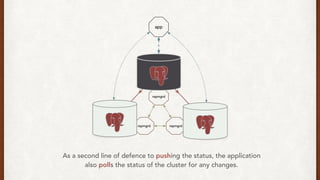
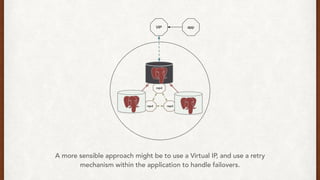
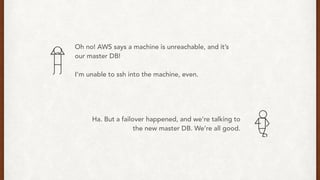
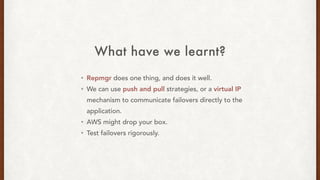
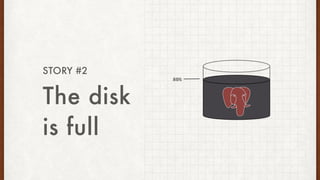
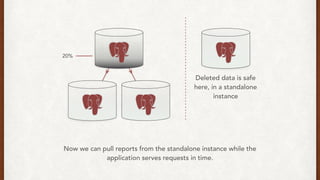
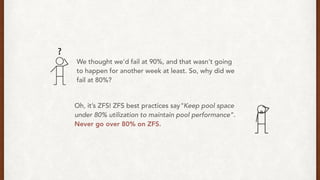
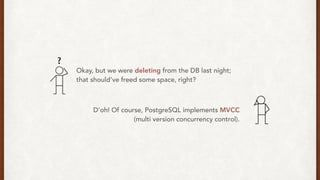
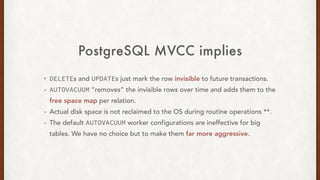
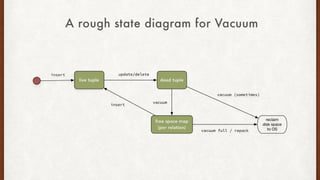

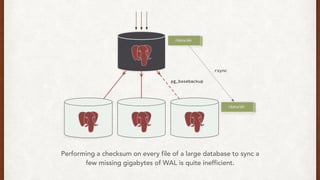
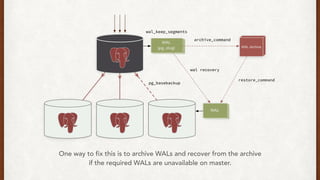
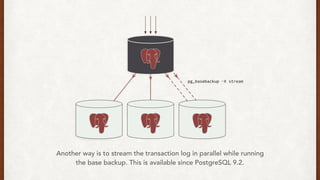
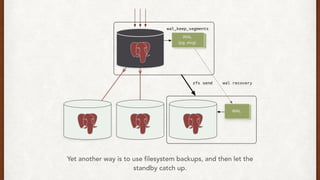
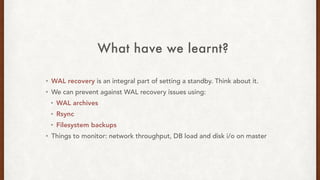
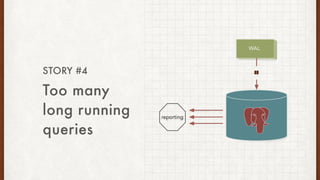
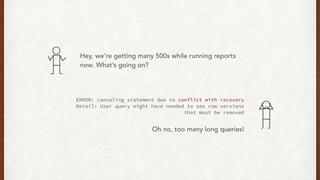
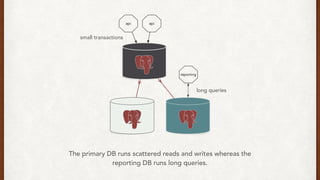
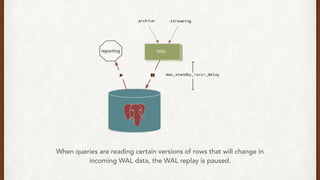
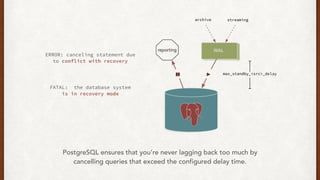

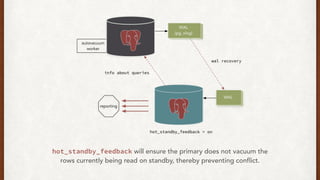

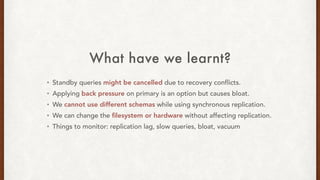
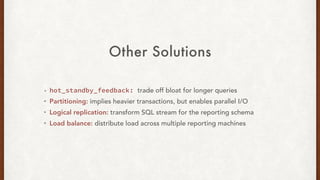

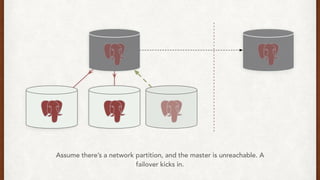
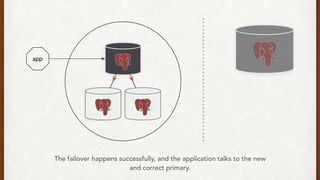
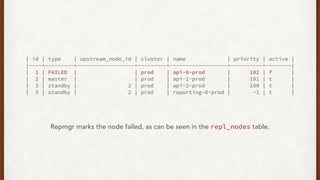
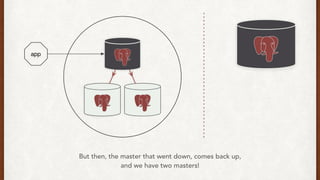
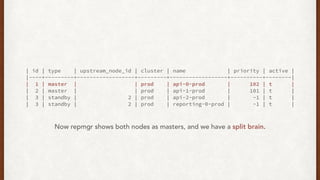

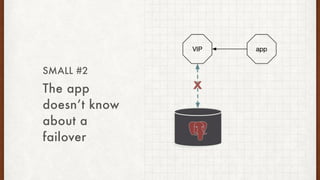
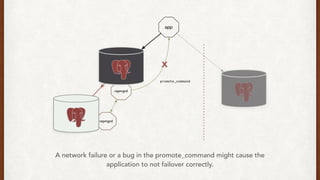
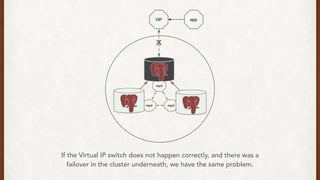
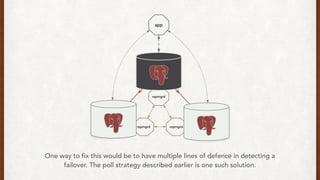
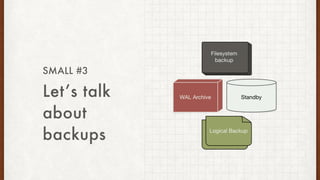
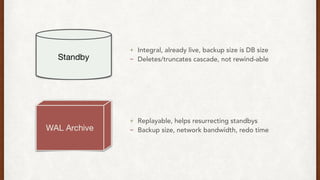
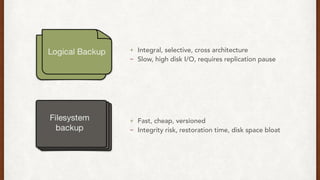


The document discusses lessons learned from setting up and maintaining a PostgreSQL cluster for a data analytics platform. It describes four stories where problems arose: 1) Implementing automatic failover using Repmgr when the master node failed, 2) The disk filling up faster than expected due to PostgreSQL's MVCC implementation, 3) Being unable to add a new standby node due to missing WAL segments, and 4) Long running queries on the standby node causing conflicts with replication. The key lessons are around using the right tools like Repmgr for replication management, tuning autovacuum, archiving WALs, and addressing hardware limitations for analytics workloads.