Download as PDF, PPTX

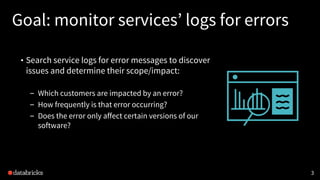
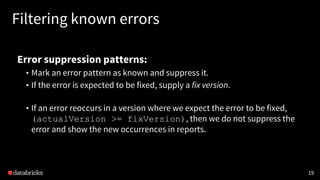
![Expensive normalization
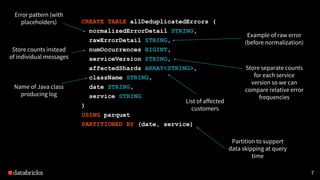
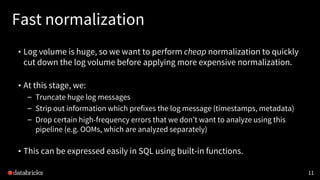
• Use a UDF (user-defined function) which applies a list of regexes, in
increasing order of generality, to replace variable data with placeholders.
12
val regexes = Seq(
"https://[^ ]+" -> "https://<URL>",
"http://[^ ]+" -> "http://<URL>",
"[((root|tenant|op|parent)=[^ ]+ ?){1,5}]" -> "<RPC-TRACING-INFO>",
[...]
"(?<![a-zA-Z])[0-9]+.[0-9]+" -> "<NUM>", // floating point numbers
"(?<![a-zA-Z])[0-9]+" -> "<NUM>"
)](https://image.slidesharecdn.com/2017-04-12databricksmonitoringmeetup-170413230815/85/Monitoring-Error-Logs-at-Databricks-12-320.jpg)
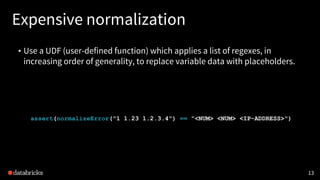
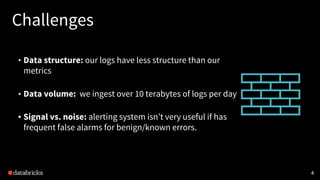
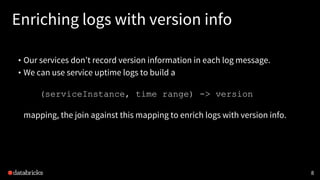
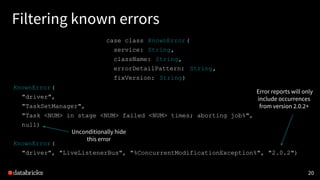
![Example: raw log
14
(workerEnvId=default-worker-env)[tenant=0 root=ElasticJobRun-68af12a6e31cd8e7
parent=InstanceManager-3db732f5476993f5 op=InstanceManager-3db732f5476993f6]:
Exception while trying to launch new instance (req =
NewInstanceRequest(r3.2xlarge,worker,branch-2.39-304-9912f549,shard-fooCorp,Pend
ingInstance{attributes=AwsInstanceAttributes(instance_type_id: "r3.2xlarge"
memory_mb: 62464
num_cores: 8
[...]
com.databricks.backend.aws.util.InstanceSetupTimeoutException: Timeout after
1200 seconds while setting up instance i-00cf6d76e44d64ed7: Instance is not
running.
at [..stacktrace..]](https://image.slidesharecdn.com/2017-04-12databricksmonitoringmeetup-170413230815/85/Monitoring-Error-Logs-at-Databricks-14-320.jpg)
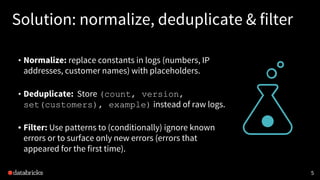
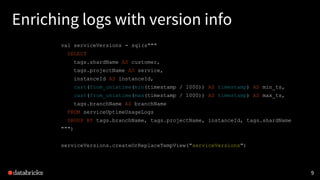
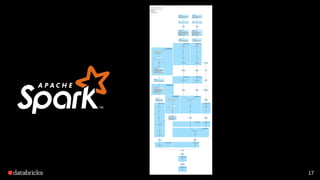
![Example: variables to normalize
15
(workerEnvId=default-worker-env) [tenant=0 root=ElasticJobRun-68af12a6e31cd8e7
parent=InstanceManager-3db732f5476993f5 op=InstanceManager-3db732f5476993f6] :
Exception while trying to launch new instance (req =
NewInstanceRequest( r3.2xlarge,worker,branch-2.39-304-9912f549 ,shard-fooCorp,Pend
ingInstance{attributes=AwsInstanceAttributes(instance_type_id: "r3.2xlarge"
memory_mb: 62464
num_cores: 8
[...]
com.databricks.backend.aws.util.InstanceSetupTimeoutException: Timeout after
1200 seconds while setting up instance i-00cf6d76e44d64ed7 : Instance is not
running.
at [..stacktrace..]](https://image.slidesharecdn.com/2017-04-12databricksmonitoringmeetup-170413230815/85/Monitoring-Error-Logs-at-Databricks-15-320.jpg)
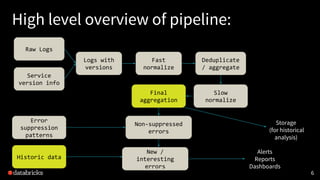
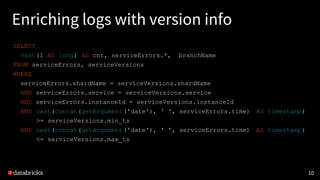
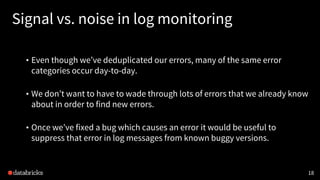
![Example: normalized log
16
(workerEnvId=default-worker-env) <RPC-TRACING-INFO> : Exception while trying to
launch new instance (req =
NewInstanceRequest( <INSTANCE-TYPE-ID> ,worker,<BRANCH-NAME>,<SHARD-NAME>,PendingIn
stance{attributes=AwsInstanceAttributes(instance_type_id: " <INSTANCE-TYPE-ID> "
memory_mb: <NUM>
num_cores: <NUM>
[...]
com.databricks.backend.aws.util.InstanceSetupTimeoutException: Timeout after
<NUM>
seconds while setting up instance <AWS-INSTANCE-ID> : Instance is not running.
at [..stacktrace..]](https://image.slidesharecdn.com/2017-04-12databricksmonitoringmeetup-170413230815/85/Monitoring-Error-Logs-at-Databricks-16-320.jpg)
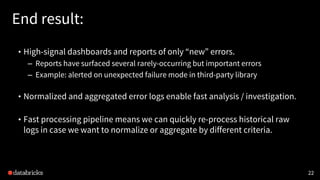
![21
Filtering known errors
SELECT
[...]
FROM allDeduplicatedErrors [...]
WHERE
NOT EXISTS (
SELECT *
FROM knownErrors
WHERE
knownErrors.service = allDeduplicatedErrors.service
AND knownErrors.className = allDeduplicatedErrors.className
AND allDeduplicatedErrors.normalizedErrorDetail LIKE knownErrors.errorDetailPattern
AND (fixVersion IS NULL OR
isHigherVersionThan(fixVersion, allDeduplicatedErrors.serviceVersion))
)
GROUP BY [...]](https://image.slidesharecdn.com/2017-04-12databricksmonitoringmeetup-170413230815/85/Monitoring-Error-Logs-at-Databricks-21-320.jpg)


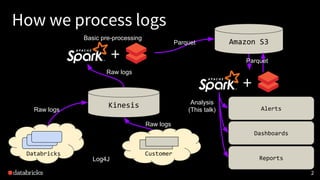
The document discusses a comprehensive approach to monitoring error logs at Databricks, detailing the processes of normalizing, deduplicating, and filtering logs to identify errors more effectively. It outlines challenges related to data structure, volume, and distinguishing between significant errors and noise, as well as solutions involving SQL and user-defined functions for log analysis. The ultimate goal is to create high-signal dashboards and reports focusing on newly surfaced errors rather than known issues, enhancing overall error management and analysis.