Downloaded 11 times
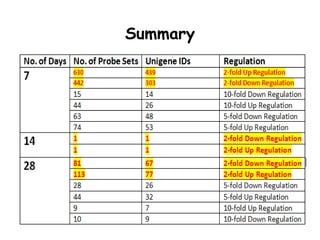
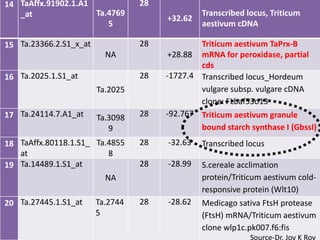
![6 Ta.6984.1.A1_at Ta.5710 7 -58.0 Predicted protein & also
0 similar with PHD zinc finger
protein-like [Oryza sativa
Japonica Group]
7 TaAffx.104444.1.S1 Ta.3578 7 -47.5 No significant similarity
_at 4
8 Ta.23013.3.S1_s_a NA 7 -31.5 B22EL8 [Hordeum vulgare]
t
9 Ta.14507.2.S1_at Ta.5418 7 -29.9 Predicted protein & also similar
6 with nucleotide-binding protein
1 [Zea mays]
10 Ta.4957.1.S1_at Ta.4957 7 -26.6
Triticum aestivum granule
bound starch synthase I (GbssI)
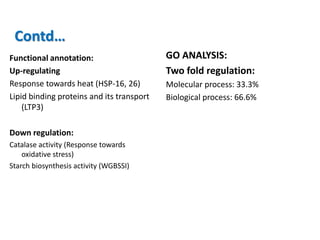
11 Ta.23366.2.S1_at 28 Triticum aestivum TaPrx-B
NA +59.96 mRNA for peroxidase, partial
cds
12 Ta.28744.1.S1_at Ta.2874 28 Transcribed locus, Triticum
+35.22
4 aestivum cDNA
13 Ta.14050.1.S1_at 28 Hordeum vulgare subsp.
Ta.1405 24
+37.26 vulgare mRNASource-Dr. Joy K Roy
for predicted](https://image.slidesharecdn.com/monika-120829113020-phpapp02/85/Towards-understanding-genetic-basis-of-chapatti-Indian-flat-bread-making-quality-24-320.jpg)
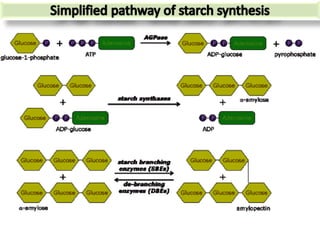
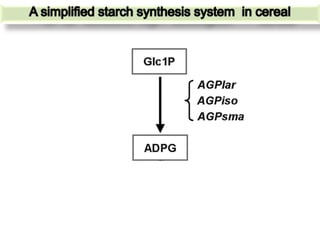
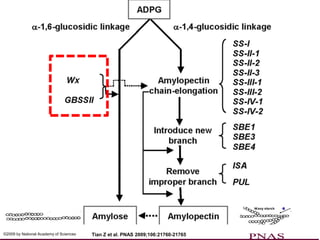
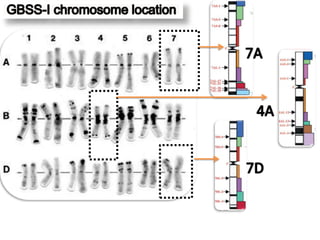
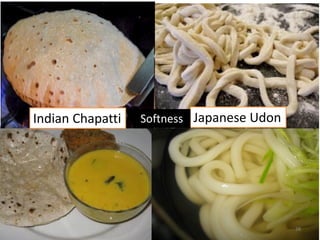
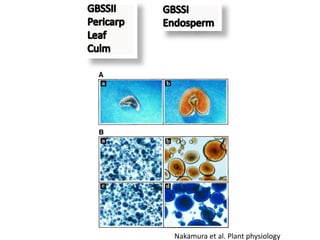
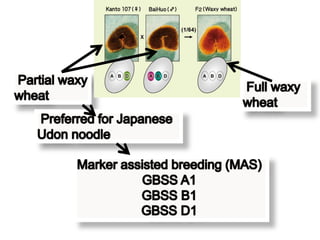
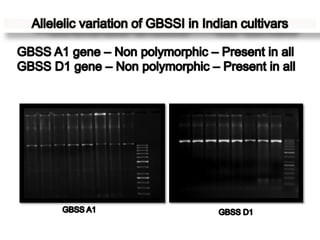
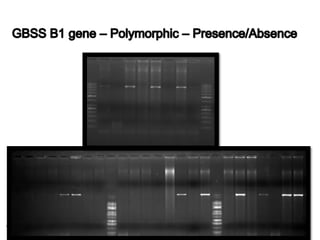

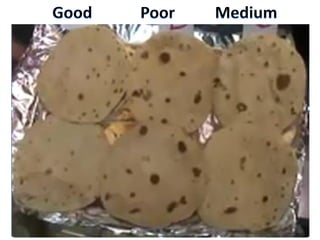
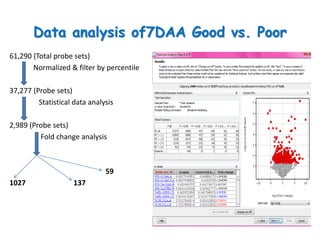
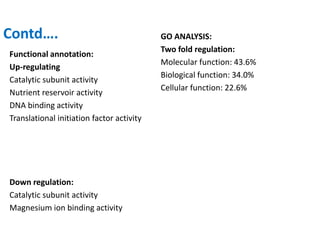
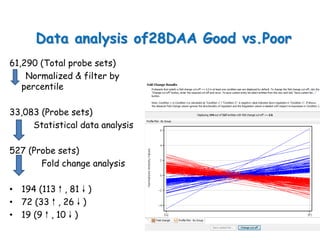
The document discusses a study on understanding the genetic basis of chapatti (Indian flat bread) making quality. Researchers analyzed samples from different wheat cultivars and identified genes associated with chapatti quality scores. Gene expression profiling identified differentially expressed genes between good and poor quality cultivars at different developmental stages. Upregulated genes in good quality cultivars were associated with storage proteins and nutrient reservoir activity, while downregulated genes were related to catalytic activity and starch biosynthesis.


