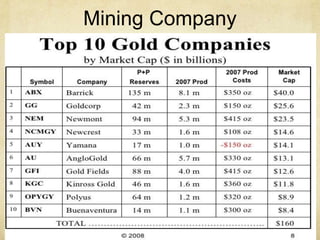
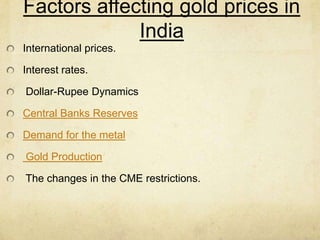
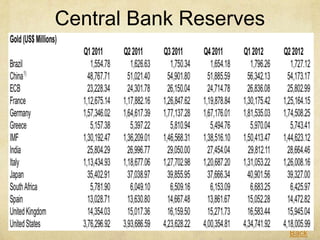
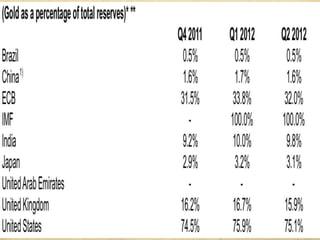
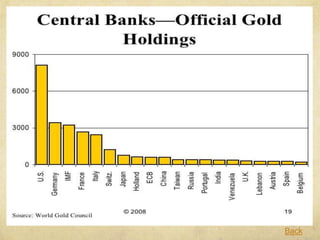
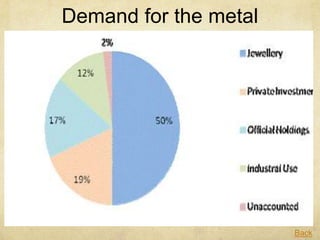
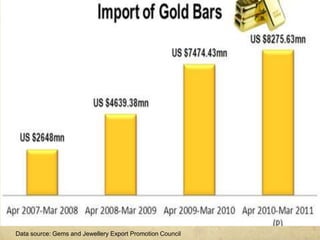
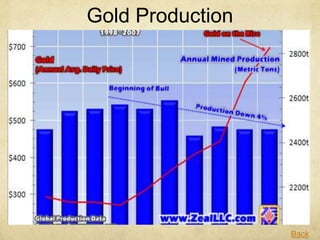
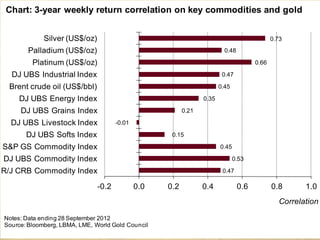
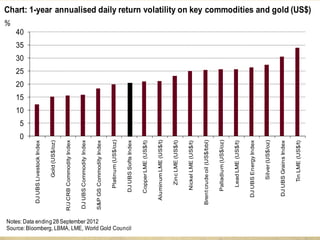
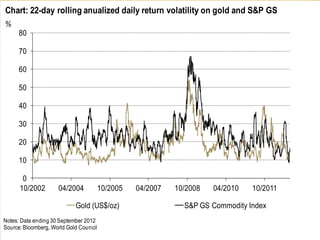
4. Gold bars & coins
most traditional way of investing in gold is by buying bullion
gold bars
these can easily be bought or sold at the major banks or
from bullion dealers
gold bars carry lower premium over spot price than gold
coins.
larger bars carry an increased risk of forgery.
The Krugerrand is the most widely-held gold bullion coin,
with 46,000,000 troy ounces (1,400 tonnes) in circulation.
5. Accounts
Gold bullion banks offer two types of gold accounts -
allocated and unallocated:
1. Allocated account
2. Unallocated account
Other opportunities for smaller investors include:
1. Gold pool accounts
2. Electronic currencies
6. Exchange Traded Products
include ETFs, ETNs, and CEFs which are traded like shares
on the major stock exchanges.
Gold ETPs represent an easy way to gain exposure to the
gold price, without the inconvenience of storing physical bars.
Typically a small commission is charged for trading in gold
ETPs and a small annual storage fee is charged.
The annual expenses of the fund such as storage,
insurance, and management fees are charged by selling a
small amount of gold represented by each certificate, so the
amount of gold in each certificate will gradually decline over
time.
7. Certificates
Gold certificates allow gold investors to avoid the risks and
costs associated with the transfer and storage of physical
bullion (such as theft, large bid-offer spread, and metallurgical
assay costs)
It entails taking on a different set of risks and costs associated
with the certificate itself (such as commissions, storage fees,
and various types of credit risk).
9. Factors affecting gold prices in
India
International prices.
Interest rates.
Dollar-Rupee Dynamics
Central Banks Reserves
Demand for the metal
Gold Production
The changes in the CME restrictions.
16. Evaluating performance of
Gold3-year weekly return correlation on key commodities and
gold
1-year annualised daily return volatility on key commodities
and gold
22-day rolling annualised daily return volatility on gold and
S&P GS
Performance of gold v/s other metals
Performance of gold v/s other commodities
Gold and S&P(% year charts)
Gold & Trade-weighted US dollar
Gold v/s Sensex
17. 0.47
0.53
0.45
0.15
-0.01
0.21
0.35
0.45
0.47
0.66
0.48
0.73
-0.2 0.0 0.2 0.4 0.6 0.8 1.0
R/J CRB Commodity Index
DJ UBS Commodity Index
S&P GS Commodity Index
DJ UBS Softs Index
DJ UBS Livestock Index
DJ UBS Grains Index
DJ UBS Energy Index
Brent crude oil (US$/bbl)
DJ UBS Industrial Index
Platinum (US$/oz)
Palladium (US$/oz)
Silver (US$/oz)
Correlation
Notes: Data ending 28 September 2012
Source: Bloomberg, LBMA, LME, World Gold Council
Chart: 3-year weekly return correlation on key commodities and gold
21. Colum
n1 Gold (US$/oz)
Brent crude oil
(US$/bbl)
DJ UBS
Energy Index
DJ UBS Grains
Index
DJ UBS
Livestock
Index
DJ UBS Softs
Index
S&P GS
Commodity
Index
DJ UBS
Commodity
Index
R/J CRB
Commodity
Index
1-
month 7.0% -0.1% 4.0% -4.9% -2.1% -0.3% -1.4% 1.7% -0.1%
3-
month 14.0% 23.9% 18.9% 13.5% -5.3% -0.3% 11.9% 9.5% 8.9%
6-
month 7.1% -8.3% 1.6% 25.5% -3.9% -13.8% -3.9% 3.3% -0.9%
1-year 10.1% 6.4% -4.8% 38.4% -11.4% -22.9% 13.8% 5.9% 4.4%
3-year 78.4% 67.4% -25.9% 75.7% 4.4% 22.7% 23.1% 19.9% 22.7%
5-year 139.0% 42.6% -61.4% 19.9% -45.9% 18.2% -23.3% -13.5% -3.2%
3y
CAGR 21.3% 18.7% -9.5% 20.7% 1.4% 7.1% 7.2% 6.2% 7.0%
5y
CAGR 19.0% 7.4% -17.3% 3.7% -11.6% 3.4% -5.2% -2.8% -0.6%
Performance of Gold & other
commodities
22. 0
100
200
300
400
500
600
700
10/2002 10/2004 10/2006 10/2008 10/2010
Index level
Gold (US$/oz) S&P 500
Notes: Data ending 30 September 2012
Source:Bloomberg, World Gold Council
Chart 5: Gold and S&P 500 in US$ (2 Sep 2002=100)
23. 0
100
200
300
400
500
600
700
10/2002 10/2004 10/2006 10/2008 10/2010
Index level
Gold (US$/oz) Trade-weighted US$
Notes: Data ending 30 September 2012
Source:Bloomberg, World Gold Council
Chart 6: Gold (US$/oz) and the trade-weighted US dollar
24. 0
10
20
30
40
50
60
70
80
90
100
10/2002 04/2004 10/2005 04/2007 10/2008 04/2010 10/2011
%
Gold (US$/oz) S&P 500
Chart 4: 22-day rolling anualized daily return volatility on gold and S&P 500 (US$)
Notes: Data ending 30 September 2012
Source:Bloomberg, World Gold Council
Instead of buying gold itself, investors can buy the companies that produce the gold as shares in gold mining companies. If the gold price rises, the profits of the gold mining company could be expected to rise and the worth of the company will rise and presumably the share price will also rise.
1: From 1970 to 1980 there has been a decline and then a stagnation in the world gold production resulting in a higher gold price (positive divergence). The price was too low for several decades, forcing some gold mines to close as production costs were above the selling price.Then from 1980 to 2001, for 20 years, the gold world production has increased resulting this time in a decrease of the gold price (negative divergence). Gold mines were producing more in order to compensate for the price decline from $850 to less than 250 dollars an ounce ...2: From 2001 to 2008, we had a decline in gold production and higher prices from 2008 to 2010 (positive divergence). Gold production decreased by 340 tonnes while the gold price has tripled. The prices were too low to encourage the opening of new gold mines as well as exploration.CME-during September 2011 the CME decided to raise margins on gold and silver contracts; the market’s reaction was very quick and bullion rates tumbled down. This is a type of market intervention. If the CME will raise margins due to another heat up in precious metals market, then prices are likely to tumble down;
Central banks keep ignot reserves as a hedge against inflation.