SlideShare a Scribd company logo
1 of 16
TECHNICAL INDICATORS

INTRODUCTION ........................................................................................................................................ 2
MOVING AVERAGES ................................................................................................................................ 2
STOCHASTICS (%K, %D FAST, %D SLOW)........................................................................................ 4
RELATIVE STRENGTH INDEX (RSI) .................................................................................................... 5
MOVING AVERAGE CONVERGENCE DIVERGENCE (MACD) ...................................................... 7
BOLLINGER BANDS ................................................................................................................................ 10
COMMODITY CHANNEL INDEX (CCI) .............................................................................................. 13
DIRECTIONAL INDICATORS (ADX, +DI/-DI, DMI).......................................................................... 15
TRIPLE EXPONENTIAL AVERAGE (TRIX) ....................................................................................... 16


                       Any unauthorized reproduction for commercial usage is strictly prohibited.
                                         © Prashant Ram, All rights reserved
__________________________________Technical Analysis____________________________________


Introduction
Technical Analysis is the practice of analyzing stock charts to uncover patterns in
stock prices and predict the future behavior of the stock. This document introduces
and describes in detail the calculation of some major Technical Indicators. The
Technical Indicators (TAs) module form a part of most of the major trading packages
available in the market today including Realtick, esignal, Bloomberg etc.


MOVING AVERAGES
Calculation:

SIMPLE MOVING AVERAGE (SMA)

SMA = Σ Prices / N
Where, N is the time period over which the SMA is calculated

Example:
Following is SMA calculation over 5-day period


                                                                SMA 1-Nov to 5-Nov


EXPONENTIAL MOVING AVERAGE (EMA)

EMAt = EMAt-1 + A(Pt - EMAt-1)
With EMA1 = P1
      A = 2 / (period -1)


Note: EMA at time T is the EMA at time T-1, plus Alpha times the difference
between the current price and EMA T-1. Thus based on the value of Alpha, EMA
“reacts” more or lesser on the new price.


Copyright © 2006 Prashant Ram, All rights reserved_______________________________________   2
__________________________________Technical Analysis____________________________________


Calculation:

           Closing                                      EMA = 22.33 – 0.5 * (22.54 – 22.33)
 Dates     Prices         SMA        EMA
   1-Nov          22.33                                 Note: A = 2/ (period – 1) = 2 / (5-1) = 0.5

   2-Nov          22.54                22.44
   3-Nov          23.56                23.00
   4-Nov          23.50                23.25
                                                        EMA = 22.44 – 0.5 * (23.56 – 22.44)
   5-Nov          24.59      23.30     23.92
   8-Nov          27.00      24.24     25.46
   9-Nov          26.98      25.13     26.22
  10-Nov          26.55      25.72     26.38
  11-Nov          26.54      26.33     26.46
  12-Nov          25.30      26.47     25.88
  15-Nov          25.00      26.07     25.44
  16-Nov          25.98      25.87     25.71


Usage and Description:

One of the most basic and widely used indicators in a technical analyst's tool box,
moving averages help traders verify existing trends, identify emerging trends, and
view overextended trends about to reverse. Moving averages are lines overlaid on a
chart indicating long term price trends with short term fluctuations smoothed out.

There are three basic types of moving averages:

   •   Simple
   •   Weighted
   •   Exponential

A simple moving average gives equal weight to each price point over the
specified period. The user defines whether the high, low, or close is used and these
price points are added together and averaged. This average price point is then
added to the existing string and a line is formed. With the addition of each new
price point the sample set drops off the oldest point. The simple moving average is
probably the most widely used moving average.

A weighted moving average gives more emphasis to the latest data. A weighted
moving average multiplies each data point by a weighting factor which differs from
day to day. These figures are added and divided by the sum of the weighting
factors. A weighted moving average allows the user to successfully smooth out a
curve while having the average more responsive to current price changes.

An exponential moving average is another way of "weighting" the more recent
data. An exponential moving average multiplies a percentage of the most recent
price by the previous period's average price. Defining the optimum moving average
for a particular currency pair involves "curve fitting". Curve fitting is the process of
selecting the right number of periods with the correct type of moving average to
produce the results the user is trying to achieve. By trial and error, technicians
work with the time periods to fit the price data.


Copyright © 2006 Prashant Ram, All rights reserved_______________________________________             3
__________________________________Technical Analysis____________________________________


After determining the optimum moving average for a currency, this average price
line can be used as a line of support in maintaining a long position or resistance in
maintaining a short position. Breaches of this line can also be used as a signal that a
currency is in the process of reversing course, in which case a trader will want to
pare back an existing position or come up with entry levels for a new position

Reference:
1.    http://www.forex.com/forex_technical_indicators.html


STOCHASTICS (%K, %D Fast, %D Slow)
Description and Usage:

Stochastic studies, or oscillators, are another useful tool for monitoring the expected
sustainability of a trend. They provide a trader with information about the closing
price in the current trading period relative to the prior performance of the instrument
being analyzed.

Stochastics are measured and represented by two different lines, %K and %D and
are plotted on a scale ranging from 0 to 100. Indications above 80 represent strong
upward movement while level indications below 20 represent strong downward
movements.

Fast stochastics (%K) can be very choppy. One can reduce choppiness by either
increasing the number of periods or by using the further smoothed form, %D Slow.
 %D Slow is a moving average of %D. To create %D Slow you must select the
number of intervals to include in the average as well as the parameters used to
create %K and %D.

Calculation:

%K = [ (Close – Low) / (High – Low) ] * 100

Where,
         Close = Closing price for that period
         Low = Lowest price for that period
         High = Highest price for that period

From above equation you will notice that
   1. Since, (Close – Low) will always be <= (High – Low), %K will always be
      between 0 and 100.
      i.e. When Closing Price = Low , %K = 0
          When Closing price = High, %K = 100

   2. Note: Since (Close – Low) is a fraction of (High – Low) , %K will increase if
      the security closes at a higher price i.e. closer to the highest price. Closing


Copyright © 2006 Prashant Ram, All rights reserved_______________________________________   4
__________________________________Technical Analysis____________________________________


       levels that are consistently near the top of the range indicate accumulation
       (buying pressure) and those near the bottom of the range indicate
       distribution (selling pressure).

%D (fast) = SMA (%K)
%D (slow)k = (9/10) * %D(slow)k-1 + (1/10) *%Dk


Reference:
1. http://www.stockcharts.com/education/IndicatorAnalysis/indic_stochasticOscillat
   or.html


RELATIVE STRENGTH INDEX (RSI)
Description and Usage:

A high RSI (upwards of 80) indicates that the security is overbought and suggests
that a downward trend in the price is expected. Consequently a low RSI (lower than
20) is indicative that the security is oversold and the prices of the security are
expected to rise (RSI values range between 0 and 100).

Other ways RSI can be used is as follows,
Center line Cross over
The centerline for RSI is 50. Reading above 50 indicates that average gains are
higher than average losses and a reading below 50 indicates that losses are winning
the battle.

Divergence
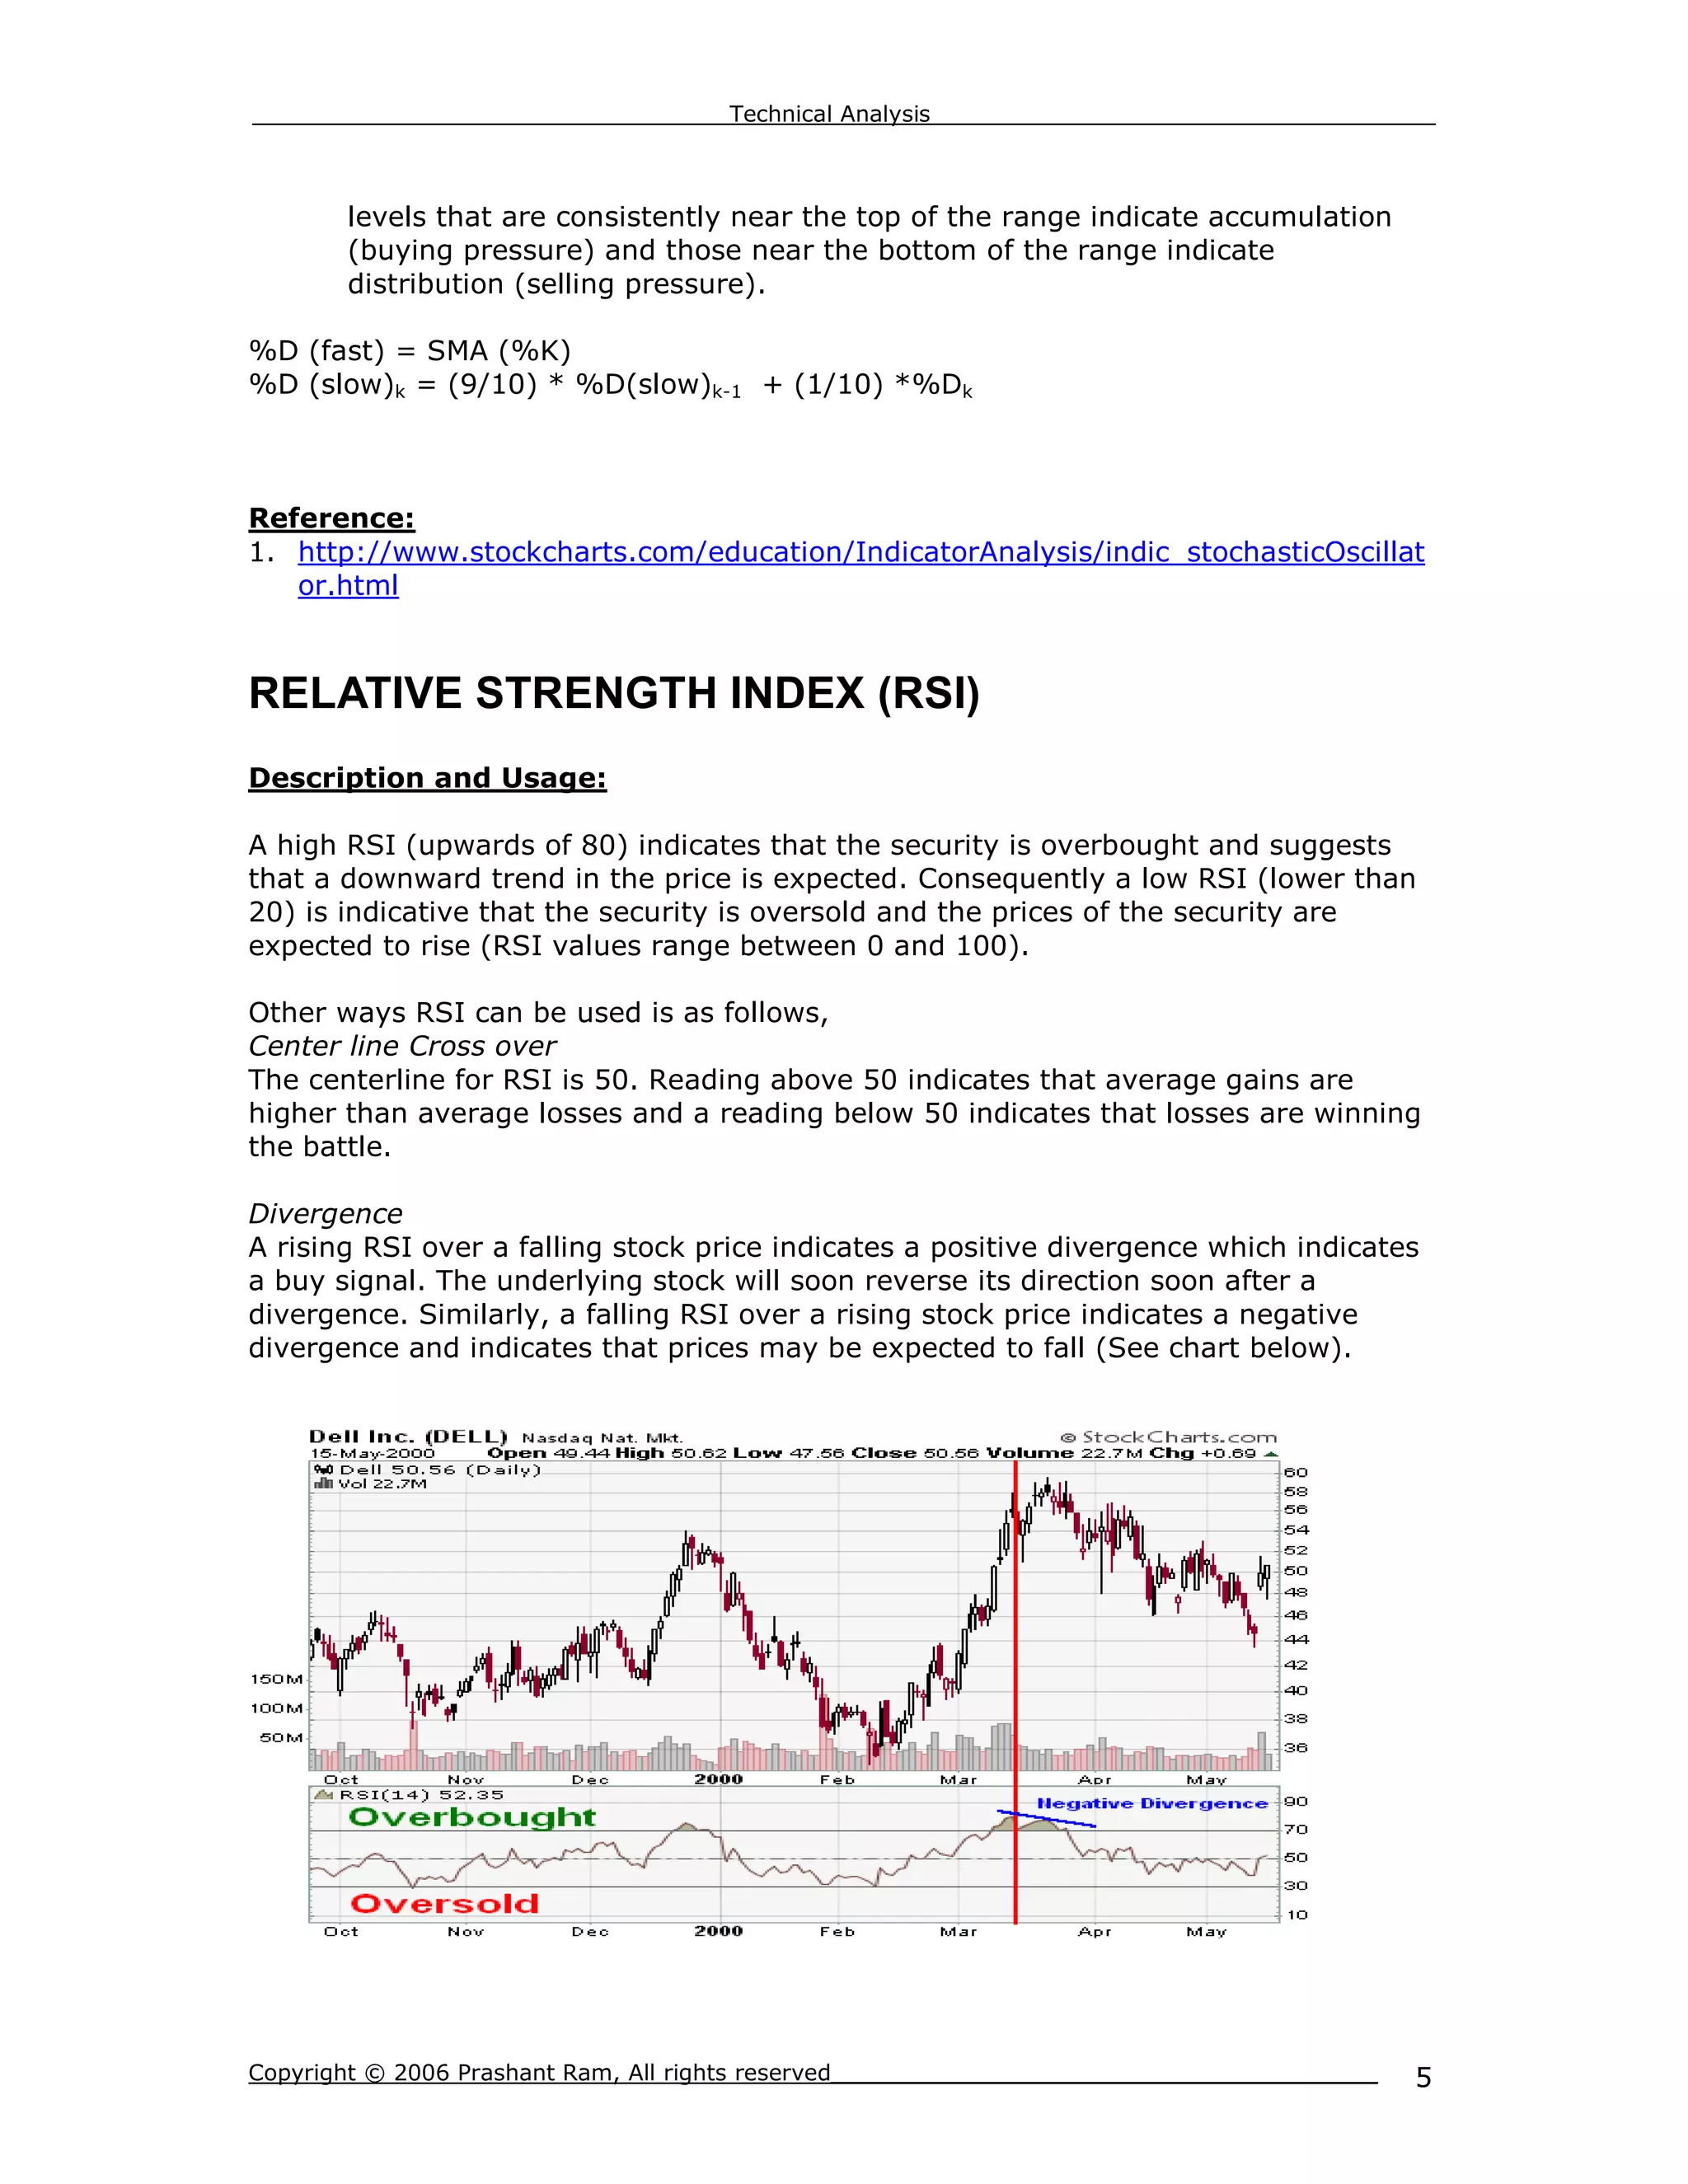
A rising RSI over a falling stock price indicates a positive divergence which indicates
a buy signal. The underlying stock will soon reverse its direction soon after a
divergence. Similarly, a falling RSI over a rising stock price indicates a negative
divergence and indicates that prices may be expected to fall (See chart below).


Copyright © 2006 Prashant Ram, All rights reserved_______________________________________   5
__________________________________Technical Analysis____________________________________


Calculation:
RSI = 100 - [ 100 / (1 + RS) ]
RS = (Avg of N period UP Close) / (Avg of N Period DOWN Close)
N is typically, 14 period

Example:
Following example calculates RSI over a 14 day period,
1.
       Date              Close UP      DOWN           22.61 – 22.44
                                                      Up close since
                1-Nov 22.44                           prices are closing
                2-Nov 22.61 0.17                      up
                3-Nov 22.67 0.06
                4-Nov 22.88 0.21
                5-Nov 23.36 0.48
                8-Nov 23.23              -0.13
                9-Nov 23.05              -0.18        23.23 – 23.36
               10-Nov 22.86              -0.19        Down close since
                                                      prices are closing
               11-Nov 23.17 0.31
                                                      down
               12-Nov 23.69 0.52
               15-Nov 23.77 0.08
               16-Nov 23.84 0.07
               17-Nov 24.32 0.48
               18-Nov 24.80 0.48
       14 Days Total             2.86      0.5
2.
       Avg of 14 period UP Close          = 2.86 / 14 = 0.204
       Avg of 14 period DOWN Close        = 0.5 / 14     = 0.036

3.
       RS = 0.204 / 0.036 = 5.72
       1 + RS = 6.72

4.
       RSI (on 19 Nov) = 100 – [ 100 / 6.72 ]         =       85.12

RSI for 19th Nov is 85.12 which is indicative that the stock is possibly overbought
and the stock prices are expected to fall. Note how the large series of up days and
the very small number of down days led to this up extreme reading.

References:
1. http://www.streetauthority.com/terms/r/rsi.asp
2. http://www.stockcharts.com/education/IndicatorAnalysis/indic_RSI.html


Copyright © 2006 Prashant Ram, All rights reserved_______________________________________   6
__________________________________Technical Analysis____________________________________


MOVING AVERAGE CONVERGENCE DIVERGENCE
(MACD)
Calculation:
MACD (12,26,9)

1. MACD = EMA (12 period) – EMA (26 period)
2. Trigger Line = EMA (9 period) of MACD

Note:
The MACD is calculated and then compared with the trigger line (which is a EMA(9
period of MACD). Whenever the MACD crosses the trigger line it is indicative of
change in trend. For example if the MACD line crosses up the trigger line it indicates
that the prices are rising. Consequently a crossing down is indicative of falling prices.

Histogram = MACD – signal,

The purpose of the histogram is to help show when a crossing occurs, since when it
crosses through zero the MACD crosses the signal line. The histogram can also help
visualizing when the two lines are coming together. Both may still be rising, but
coming together, so a falling histogram suggests a crossover may be approaching.

Description and Usage

Three   types of trading signals are generated,
   1.    MACD line crossing the signal line
   2.    MACD line crossing zero line
   3.    Divergence between price and MACD levels

1. As indicated earlier, the MACD line crossing the EMA(9) signal line is indicative of
change in trend, a crossing up suggests rising prices a crossing down suggests falling
prices.

2. The zero line is the horizontal line when MACD = 0, A MACD line crossing the
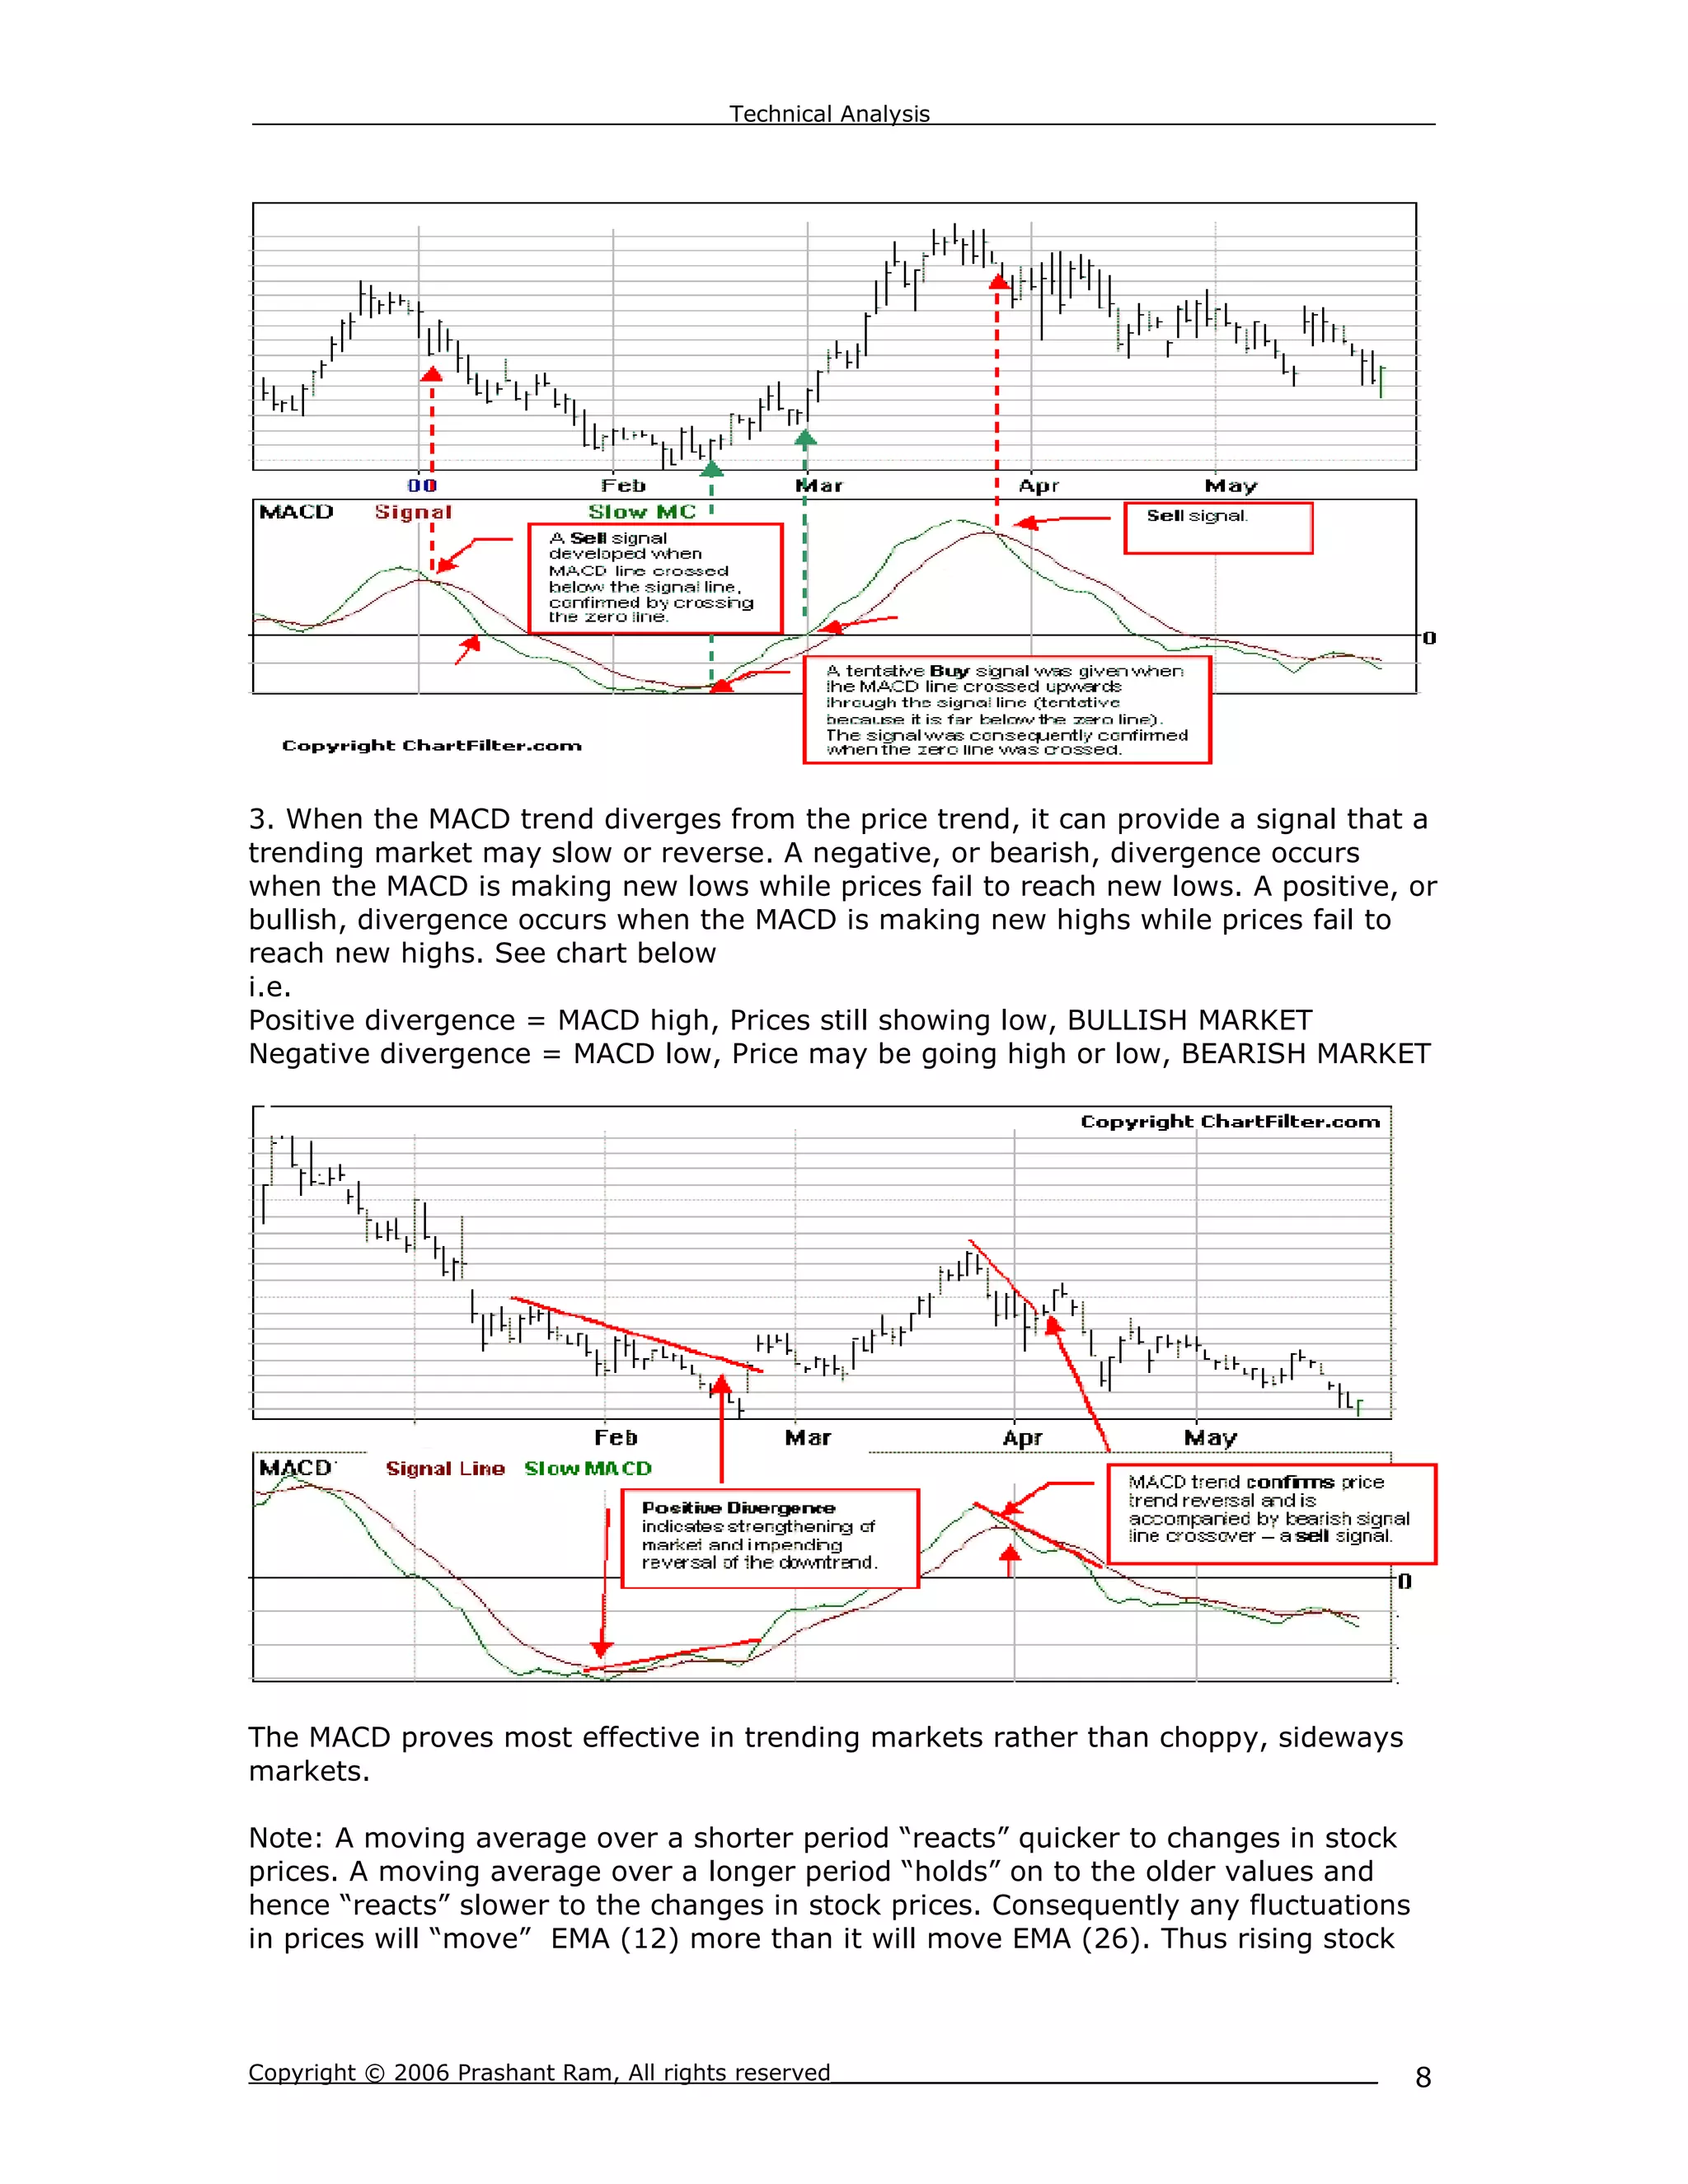
EMA(9) signal line and then also crossing the MACD=0 line confirms the trend. See
the chart below


Copyright © 2006 Prashant Ram, All rights reserved_______________________________________   7
__________________________________Technical Analysis____________________________________


3. When the MACD trend diverges from the price trend, it can provide a signal that a
trending market may slow or reverse. A negative, or bearish, divergence occurs
when the MACD is making new lows while prices fail to reach new lows. A positive, or
bullish, divergence occurs when the MACD is making new highs while prices fail to
reach new highs. See chart below
i.e.
Positive divergence = MACD high, Prices still showing low, BULLISH MARKET
Negative divergence = MACD low, Price may be going high or low, BEARISH MARKET


The MACD proves most effective in trending markets rather than choppy, sideways
markets.

Note: A moving average over a shorter period “reacts” quicker to changes in stock
prices. A moving average over a longer period “holds” on to the older values and
hence “reacts” slower to the changes in stock prices. Consequently any fluctuations
in prices will “move” EMA (12) more than it will move EMA (26). Thus rising stock


Copyright © 2006 Prashant Ram, All rights reserved_______________________________________   8
__________________________________Technical Analysis____________________________________


prices will increase the value of the MACD. Since EMA (12) will rise faster than EMA
(26).


References:
      1.    http://en.wikipedia.org/wiki/MACD
      2.    http://www.chartfilter.com/reports/c22.htm


Copyright © 2006 Prashant Ram, All rights reserved_______________________________________   9
__________________________________Technical Analysis____________________________________


BOLLINGER BANDS
Calculation:

Bollinger Bands = SMA +- A. (SD)
Where,
       A is an integer typically set to 3 or 2
       SD is standard deviation of the prices over the given SMA period
       Typical time period is 20-day SMA.

Unlike stochastics, which are bounded by 0 and 100, %b can assume negative values
and values above 100 when prices are outside of the bands. At 100 we are at the
upper band, at 0 we are at the lower band. Above 100 we are above the upper bands
and below 0 we are below the lower band.

       %b = (Close – Lower Band) / (High Band – Low Band)
       Bandwidth = (Upper Bandwidth – Lower Band) / Middle Band

Bollinger bands differ from MAs in that they adapt (i.e. expand or contract) based on
the price movements, Since BA = MA +- 3. (SD).

Example:


Copyright © 2006 Prashant Ram, All rights reserved_______________________________________   10
__________________________________Technical Analysis____________________________________


Usage:
Bollinger Bands can be combined with price action and other indicators to generate
signals and foreshadow significant moves. A double bottom buy signal is given when
prices penetrate the lower band and remain above the lower band after a subsequent
low forms. In the chart below the stock penetrated the lower band in late September
(red arrow) and then held above on the subsequent test in October. The October
breakout above the middle band (green circle) provided the bullish confirmation.


Copyright © 2006 Prashant Ram, All rights reserved_______________________________________   11
__________________________________Technical Analysis____________________________________


References:
1.    http://www.bollingerbands.com/services/bb/?page=7
2.    http://www.stockcharts.com/education/IndicatorAnalysis/indic_Bbands.html


Copyright © 2006 Prashant Ram, All rights reserved_______________________________________   12
__________________________________Technical Analysis____________________________________


Commodity Channel Index (CCI)
Description and Usage:
The CCI determines if the security is overbought or oversold securities. CCI typically
oscillates above and below a zero line, within the range of +100 and -100. Values
above +100 imply an overbought condition and indicate that the price of the stock
will fall. Values below -100 imply an oversold condition and indicate possible future
rise in stock prices.

The assumption behind the indicator is that commodities (or stocks or bonds) move
in cycles, with highs and lows coming at periodic intervals. Lambert recommended
using 1/3 of a complete cycle (low to low or high to high) as a time frame for the
CCI. If the cycle runs 60 days (a low about every 60 days), then a 20-day CCI would
be recommended.

Calculation:
For the purpose of this example, a 20-day CCI is used.
There are four steps in the calculation of CCI.

       1. Calculation of typical price, TP = (H+L+C) / 3
       Where, H- high price, L- low price , C- closing price

       NOTE: in some cases we may simply use the closing price
       Eg. CCI (20, Close), TP = Closing price

       2. Calculate the 20-period SMA of the TP

       3. Calculate the Mean Deviation. First, calculate the absolute value of the
       difference between the last period's SMATP and the typical price for each of
       the past 20 periods. Add all of these absolute values together and divide by
       20 to find the Mean Deviation

       4. CCI = (TP – SMATP) / ( (0.015) * Mean Deviation )

Example:
The following example uses a 5-day period to calculate CCI


Copyright © 2006 Prashant Ram, All rights reserved_______________________________________   13
__________________________________Technical Analysis____________________________________


References:
1.    http://en.wikipedia.org/wiki/Commodity_Channel_Index
2.    http://www.stockcharts.com/education/IndicatorAnalysis/indic_CCI.html


Copyright © 2006 Prashant Ram, All rights reserved_______________________________________   14
__________________________________Technical Analysis____________________________________


Directional Indicators (ADX, +DI/-DI, DMI)
Description and Usage:
The ADX indicator ranges from 0 to 100, although values above 60 are rare.
Typically values crossing over 40 and below 20 indicate a corresponding strong trend
and weak trend respectively. Note that the ADX DOES NOT indicate bullish or bearish
signal but merely reinforces the strength of the current trend. So if the stock is in a
downward trend, an ADX value is above 40, it indicates that the downward trend is
strong and expected to continue. ON the other hand an ADX of 15 on a downward
trend indicates that the trend is weakening and a turn in trend may be expected.
Similarly on an upward trend an ADX of 40 indicates that the trend is strong.


In the most basic form +DI/-DI can be used to generate buy/sell signals as follows.
When +DI crosses –DI upwards it indicates a buy signal, when +DI crosses – DI
downward it indicates a sell signal.


References:
1.    http://www.stockcharts.com/education/IndicatorAnalysis/indic_ADX.html


Copyright © 2006 Prashant Ram, All rights reserved_______________________________________   15
__________________________________Technical Analysis____________________________________


Triple Exponential Average (TRIX)
Description and Usage:
The TRIX is a leading indicator which can be used in conjunction with a signal line to
indicate a buy/sell signal or can be used based on the price divergence. When it is
used in conjunction with a signal line, when the TRIX crosses up the signal line it is
indicative of a buy signal, conversely when it crosses down the signal line it is
indicative of a sell signal. Typically TRIX(15,9) is taken where 9-EMA is the signal
line.

Calculation:
For a 15 day period
    1. Calculate the    15-day EMA of the closing price
    2. Calculate the    15-day EMA of the prices in step 1
    3. Calculate the    15-day EMA of the prices in step 2
    4. Calculate the    1-day percentage change of the prices in step 3


NOTE:
        EMAt = EMAt-1 + A (Pt – EMAt-1)
        Where,
                EMA0 = P0
                A = 2 / (period -1) = 1 / (15 – 1) = 0.14

References:
1.    http://www.stockcharts.com/education/IndicatorAnalysis/indic_trix.htm


Copyright © 2006 Prashant Ram, All rights reserved_______________________________________   16

More Related Content

Viewers also liked

Introduction to Technical analysis
Introduction to Technical analysisIntroduction to Technical analysis
Introduction to Technical analysisahmed_mahmoud
 
Technical analysis
Technical analysisTechnical analysis
Technical analysisBFSICM
 
Introduction to technical analysis
Introduction to technical analysisIntroduction to technical analysis
Introduction to technical analysisJuzaillan Mohamed
 
technical analysis
technical analysistechnical analysis
technical analysisAshish Singh
 
Technical Analysis Presentation
Technical Analysis PresentationTechnical Analysis Presentation
Technical Analysis Presentationdpark1
 
TMX presentation, May 16, 2013
TMX presentation, May 16, 2013TMX presentation, May 16, 2013
TMX presentation, May 16, 2013ONEIA
 
Introduction to ECN
Introduction to ECNIntroduction to ECN
Introduction to ECNPrashant Ram
 
Introduction to technical anlaysis
Introduction to technical anlaysisIntroduction to technical anlaysis
Introduction to technical anlaysisshivgan
 
Understanding Level II Quotes Screen
Understanding Level II Quotes ScreenUnderstanding Level II Quotes Screen
Understanding Level II Quotes ScreenPrashant Ram
 
Technical analysis
Technical analysisTechnical analysis
Technical analysisapunrohit
 
Dynamics CRM: which 3rd Party solutions do I need
Dynamics CRM: which 3rd Party solutions do I needDynamics CRM: which 3rd Party solutions do I need
Dynamics CRM: which 3rd Party solutions do I needQuantiQ Technology
 
Technical Analysis By Pantej
Technical Analysis By PantejTechnical Analysis By Pantej
Technical Analysis By Pantejashish_pandya38
 
Reading The Tape 101 - Learn How To Read The Tape For Day Trading
Reading The Tape 101 - Learn How To Read The Tape For Day TradingReading The Tape 101 - Learn How To Read The Tape For Day Trading
Reading The Tape 101 - Learn How To Read The Tape For Day TradingJose Casanova
 
Trading Psychology: 5 Critical Lessons From Pro Traders That You Should Know.
Trading Psychology: 5 Critical Lessons From Pro Traders That You Should Know.Trading Psychology: 5 Critical Lessons From Pro Traders That You Should Know.
Trading Psychology: 5 Critical Lessons From Pro Traders That You Should Know.Reach Markets
 
RSI( Relative Strength Index) trading strategy -Forex Buffalo Forum
RSI( Relative Strength Index) trading strategy -Forex Buffalo ForumRSI( Relative Strength Index) trading strategy -Forex Buffalo Forum
RSI( Relative Strength Index) trading strategy -Forex Buffalo Forumforexbuffalo
 
sharechart Technical Analysis from Student shishir pokheral Presentation on N...
sharechart Technical Analysis from Student shishir pokheral Presentation on N...sharechart Technical Analysis from Student shishir pokheral Presentation on N...
sharechart Technical Analysis from Student shishir pokheral Presentation on N...Sharechart Shrestha
 
“Technical analysis” a study on selected stocks
“Technical analysis”   a study on selected stocks“Technical analysis”   a study on selected stocks
“Technical analysis” a study on selected stocksBozo All
 

Viewers also liked (20)

Introduction to Technical analysis
Introduction to Technical analysisIntroduction to Technical analysis
Introduction to Technical analysis
 
Technical analysis
Technical analysisTechnical analysis
Technical analysis
 
Introduction to technical analysis
Introduction to technical analysisIntroduction to technical analysis
Introduction to technical analysis
 
technical analysis
technical analysistechnical analysis
technical analysis
 
Technical Analysis Presentation
Technical Analysis PresentationTechnical Analysis Presentation
Technical Analysis Presentation
 
TMX presentation, May 16, 2013
TMX presentation, May 16, 2013TMX presentation, May 16, 2013
TMX presentation, May 16, 2013
 
Introduction to ECN
Introduction to ECNIntroduction to ECN
Introduction to ECN
 
Introduction to technical anlaysis
Introduction to technical anlaysisIntroduction to technical anlaysis
Introduction to technical anlaysis
 
Understanding Level II Quotes Screen
Understanding Level II Quotes ScreenUnderstanding Level II Quotes Screen
Understanding Level II Quotes Screen
 
Technical analysis
Technical analysisTechnical analysis
Technical analysis
 
Dynamics CRM: which 3rd Party solutions do I need
Dynamics CRM: which 3rd Party solutions do I needDynamics CRM: which 3rd Party solutions do I need
Dynamics CRM: which 3rd Party solutions do I need
 
Technical Analysis By Pantej
Technical Analysis By PantejTechnical Analysis By Pantej
Technical Analysis By Pantej
 
Reading The Tape 101 - Learn How To Read The Tape For Day Trading
Reading The Tape 101 - Learn How To Read The Tape For Day TradingReading The Tape 101 - Learn How To Read The Tape For Day Trading
Reading The Tape 101 - Learn How To Read The Tape For Day Trading
 
Trading Psychology: 5 Critical Lessons From Pro Traders That You Should Know.
Trading Psychology: 5 Critical Lessons From Pro Traders That You Should Know.Trading Psychology: 5 Critical Lessons From Pro Traders That You Should Know.
Trading Psychology: 5 Critical Lessons From Pro Traders That You Should Know.
 
Technical analysis A to Z
Technical analysis A to ZTechnical analysis A to Z
Technical analysis A to Z
 
Basic Technical Analysis
Basic Technical AnalysisBasic Technical Analysis
Basic Technical Analysis
 
RSI( Relative Strength Index) trading strategy -Forex Buffalo Forum
RSI( Relative Strength Index) trading strategy -Forex Buffalo ForumRSI( Relative Strength Index) trading strategy -Forex Buffalo Forum
RSI( Relative Strength Index) trading strategy -Forex Buffalo Forum
 
sharechart Technical Analysis from Student shishir pokheral Presentation on N...
sharechart Technical Analysis from Student shishir pokheral Presentation on N...sharechart Technical Analysis from Student shishir pokheral Presentation on N...
sharechart Technical Analysis from Student shishir pokheral Presentation on N...
 
“Technical analysis” a study on selected stocks
“Technical analysis”   a study on selected stocks“Technical analysis”   a study on selected stocks
“Technical analysis” a study on selected stocks
 
Technical analysis
Technical analysisTechnical analysis
Technical analysis
 

Similar to Introduction to Technical Analysis in Investment Trading

2. Module II (1) FRM.pdf
2. Module II (1) FRM.pdf2. Module II (1) FRM.pdf
2. Module II (1) FRM.pdfItzGA
 
Express measurement of market volatility using ergodicity concept
Express measurement of market volatility using ergodicity conceptExpress measurement of market volatility using ergodicity concept
Express measurement of market volatility using ergodicity conceptJack Sarkissian
 
QNBFS Daily Technical Trader Qatar - December 29, 2021 التحليل الفني اليومي ل...
QNBFS Daily Technical Trader Qatar - December 29, 2021 التحليل الفني اليومي ل...QNBFS Daily Technical Trader Qatar - December 29, 2021 التحليل الفني اليومي ل...
QNBFS Daily Technical Trader Qatar - December 29, 2021 التحليل الفني اليومي ل...QNB Group
 
QNBFS Daily Technical Trader Qatar - December 21, 2021 التحليل الفني اليومي ل...
QNBFS Daily Technical Trader Qatar - December 21, 2021 التحليل الفني اليومي ل...QNBFS Daily Technical Trader Qatar - December 21, 2021 التحليل الفني اليومي ل...
QNBFS Daily Technical Trader Qatar - December 21, 2021 التحليل الفني اليومي ل...QNB Group
 
LFM Pedersen Calibration - Cappelli
LFM Pedersen Calibration - CappelliLFM Pedersen Calibration - Cappelli
LFM Pedersen Calibration - CappelliJoel Cappelli
 
QNBFS Daily Technical Trader Qatar - October 25, 2022 التحليل الفني اليومي لب...
QNBFS Daily Technical Trader Qatar - October 25, 2022 التحليل الفني اليومي لب...QNBFS Daily Technical Trader Qatar - October 25, 2022 التحليل الفني اليومي لب...
QNBFS Daily Technical Trader Qatar - October 25, 2022 التحليل الفني اليومي لب...QNB Group
 
Industrial engineering notes for gate
Industrial engineering notes for gateIndustrial engineering notes for gate
Industrial engineering notes for gateSoumith V
 
QNBFS Daily Technical Trader Qatar - March 19, 2023 التحليل الفني اليومي لبور...
QNBFS Daily Technical Trader Qatar - March 19, 2023 التحليل الفني اليومي لبور...QNBFS Daily Technical Trader Qatar - March 19, 2023 التحليل الفني اليومي لبور...
QNBFS Daily Technical Trader Qatar - March 19, 2023 التحليل الفني اليومي لبور...QNB Group
 
QNBFS Daily Technical Trader Qatar - July 27, 2022 التحليل الفني اليومي لبورص...
QNBFS Daily Technical Trader Qatar - July 27, 2022 التحليل الفني اليومي لبورص...QNBFS Daily Technical Trader Qatar - July 27, 2022 التحليل الفني اليومي لبورص...
QNBFS Daily Technical Trader Qatar - July 27, 2022 التحليل الفني اليومي لبورص...QNB Group
 
QNBFS Daily Technical Trader Qatar - December 30, 2021 التحليل الفني اليومي ل...
QNBFS Daily Technical Trader Qatar - December 30, 2021 التحليل الفني اليومي ل...QNBFS Daily Technical Trader Qatar - December 30, 2021 التحليل الفني اليومي ل...
QNBFS Daily Technical Trader Qatar - December 30, 2021 التحليل الفني اليومي ل...QNB Group
 
QNBFS Daily Technical Trader Qatar - August 02, 2023 التحليل الفني اليومي لبو...
QNBFS Daily Technical Trader Qatar - August 02, 2023 التحليل الفني اليومي لبو...QNBFS Daily Technical Trader Qatar - August 02, 2023 التحليل الفني اليومي لبو...
QNBFS Daily Technical Trader Qatar - August 02, 2023 التحليل الفني اليومي لبو...QNB Group
 
26 February Daily technical trader
26 February Daily technical trader 26 February Daily technical trader
26 February Daily technical trader QNB Group
 
QNBFS Daily Technical Trader - Qatar for October 29, 2017
QNBFS Daily Technical Trader - Qatar for October 29, 2017QNBFS Daily Technical Trader - Qatar for October 29, 2017
QNBFS Daily Technical Trader - Qatar for October 29, 2017QNB Group
 
QNBFS Daily Technical Trader Qatar - December 28, 2021 التحليل الفني اليومي ل...
QNBFS Daily Technical Trader Qatar - December 28, 2021 التحليل الفني اليومي ل...QNBFS Daily Technical Trader Qatar - December 28, 2021 التحليل الفني اليومي ل...
QNBFS Daily Technical Trader Qatar - December 28, 2021 التحليل الفني اليومي ل...QNB Group
 
QNBFS Daily Technical Trader Qatar - November 02, 2021 التحليل الفني اليومي ل...
QNBFS Daily Technical Trader Qatar - November 02, 2021 التحليل الفني اليومي ل...QNBFS Daily Technical Trader Qatar - November 02, 2021 التحليل الفني اليومي ل...
QNBFS Daily Technical Trader Qatar - November 02, 2021 التحليل الفني اليومي ل...QNB Group
 
QNBFS Daily Technical Trader Qatar - February 27, 2022 التحليل الفني اليومي ل...
QNBFS Daily Technical Trader Qatar - February 27, 2022 التحليل الفني اليومي ل...QNBFS Daily Technical Trader Qatar - February 27, 2022 التحليل الفني اليومي ل...
QNBFS Daily Technical Trader Qatar - February 27, 2022 التحليل الفني اليومي ل...QNB Group
 
QNBFS Daily Technical Trader Qatar - October 27, 2021 التحليل الفني اليومي لب...
QNBFS Daily Technical Trader Qatar - October 27, 2021 التحليل الفني اليومي لب...QNBFS Daily Technical Trader Qatar - October 27, 2021 التحليل الفني اليومي لب...
QNBFS Daily Technical Trader Qatar - October 27, 2021 التحليل الفني اليومي لب...QNB Group
 
QNBFS Daily Technical Trader Qatar - November 03, 2021 التحليل الفني اليومي ل...
QNBFS Daily Technical Trader Qatar - November 03, 2021 التحليل الفني اليومي ل...QNBFS Daily Technical Trader Qatar - November 03, 2021 التحليل الفني اليومي ل...
QNBFS Daily Technical Trader Qatar - November 03, 2021 التحليل الفني اليومي ل...QNB Group
 
QNBFS Daily Technical Trader Qatar - April 01, 2023 التحليل الفني اليومي لبور...
QNBFS Daily Technical Trader Qatar - April 01, 2023 التحليل الفني اليومي لبور...QNBFS Daily Technical Trader Qatar - April 01, 2023 التحليل الفني اليومي لبور...
QNBFS Daily Technical Trader Qatar - April 01, 2023 التحليل الفني اليومي لبور...QNB Group
 
QNBFS Daily Technical Trader Qatar - December 21, 2021 التحليل الفني اليومي ل...
QNBFS Daily Technical Trader Qatar - December 21, 2021 التحليل الفني اليومي ل...QNBFS Daily Technical Trader Qatar - December 21, 2021 التحليل الفني اليومي ل...
QNBFS Daily Technical Trader Qatar - December 21, 2021 التحليل الفني اليومي ل...QNB Group
 

Similar to Introduction to Technical Analysis in Investment Trading (20)

2. Module II (1) FRM.pdf
2. Module II (1) FRM.pdf2. Module II (1) FRM.pdf
2. Module II (1) FRM.pdf
 
Express measurement of market volatility using ergodicity concept
Express measurement of market volatility using ergodicity conceptExpress measurement of market volatility using ergodicity concept
Express measurement of market volatility using ergodicity concept
 
QNBFS Daily Technical Trader Qatar - December 29, 2021 التحليل الفني اليومي ل...
QNBFS Daily Technical Trader Qatar - December 29, 2021 التحليل الفني اليومي ل...QNBFS Daily Technical Trader Qatar - December 29, 2021 التحليل الفني اليومي ل...
QNBFS Daily Technical Trader Qatar - December 29, 2021 التحليل الفني اليومي ل...
 
QNBFS Daily Technical Trader Qatar - December 21, 2021 التحليل الفني اليومي ل...
QNBFS Daily Technical Trader Qatar - December 21, 2021 التحليل الفني اليومي ل...QNBFS Daily Technical Trader Qatar - December 21, 2021 التحليل الفني اليومي ل...
QNBFS Daily Technical Trader Qatar - December 21, 2021 التحليل الفني اليومي ل...
 
LFM Pedersen Calibration - Cappelli
LFM Pedersen Calibration - CappelliLFM Pedersen Calibration - Cappelli
LFM Pedersen Calibration - Cappelli
 
QNBFS Daily Technical Trader Qatar - October 25, 2022 التحليل الفني اليومي لب...
QNBFS Daily Technical Trader Qatar - October 25, 2022 التحليل الفني اليومي لب...QNBFS Daily Technical Trader Qatar - October 25, 2022 التحليل الفني اليومي لب...
QNBFS Daily Technical Trader Qatar - October 25, 2022 التحليل الفني اليومي لب...
 
Industrial engineering notes for gate
Industrial engineering notes for gateIndustrial engineering notes for gate
Industrial engineering notes for gate
 
QNBFS Daily Technical Trader Qatar - March 19, 2023 التحليل الفني اليومي لبور...
QNBFS Daily Technical Trader Qatar - March 19, 2023 التحليل الفني اليومي لبور...QNBFS Daily Technical Trader Qatar - March 19, 2023 التحليل الفني اليومي لبور...
QNBFS Daily Technical Trader Qatar - March 19, 2023 التحليل الفني اليومي لبور...
 
QNBFS Daily Technical Trader Qatar - July 27, 2022 التحليل الفني اليومي لبورص...
QNBFS Daily Technical Trader Qatar - July 27, 2022 التحليل الفني اليومي لبورص...QNBFS Daily Technical Trader Qatar - July 27, 2022 التحليل الفني اليومي لبورص...
QNBFS Daily Technical Trader Qatar - July 27, 2022 التحليل الفني اليومي لبورص...
 
QNBFS Daily Technical Trader Qatar - December 30, 2021 التحليل الفني اليومي ل...
QNBFS Daily Technical Trader Qatar - December 30, 2021 التحليل الفني اليومي ل...QNBFS Daily Technical Trader Qatar - December 30, 2021 التحليل الفني اليومي ل...
QNBFS Daily Technical Trader Qatar - December 30, 2021 التحليل الفني اليومي ل...
 
QNBFS Daily Technical Trader Qatar - August 02, 2023 التحليل الفني اليومي لبو...
QNBFS Daily Technical Trader Qatar - August 02, 2023 التحليل الفني اليومي لبو...QNBFS Daily Technical Trader Qatar - August 02, 2023 التحليل الفني اليومي لبو...
QNBFS Daily Technical Trader Qatar - August 02, 2023 التحليل الفني اليومي لبو...
 
26 February Daily technical trader
26 February Daily technical trader 26 February Daily technical trader
26 February Daily technical trader
 
QNBFS Daily Technical Trader - Qatar for October 29, 2017
QNBFS Daily Technical Trader - Qatar for October 29, 2017QNBFS Daily Technical Trader - Qatar for October 29, 2017
QNBFS Daily Technical Trader - Qatar for October 29, 2017
 
QNBFS Daily Technical Trader Qatar - December 28, 2021 التحليل الفني اليومي ل...
QNBFS Daily Technical Trader Qatar - December 28, 2021 التحليل الفني اليومي ل...QNBFS Daily Technical Trader Qatar - December 28, 2021 التحليل الفني اليومي ل...
QNBFS Daily Technical Trader Qatar - December 28, 2021 التحليل الفني اليومي ل...
 
QNBFS Daily Technical Trader Qatar - November 02, 2021 التحليل الفني اليومي ل...
QNBFS Daily Technical Trader Qatar - November 02, 2021 التحليل الفني اليومي ل...QNBFS Daily Technical Trader Qatar - November 02, 2021 التحليل الفني اليومي ل...
QNBFS Daily Technical Trader Qatar - November 02, 2021 التحليل الفني اليومي ل...
 
QNBFS Daily Technical Trader Qatar - February 27, 2022 التحليل الفني اليومي ل...
QNBFS Daily Technical Trader Qatar - February 27, 2022 التحليل الفني اليومي ل...QNBFS Daily Technical Trader Qatar - February 27, 2022 التحليل الفني اليومي ل...
QNBFS Daily Technical Trader Qatar - February 27, 2022 التحليل الفني اليومي ل...
 
QNBFS Daily Technical Trader Qatar - October 27, 2021 التحليل الفني اليومي لب...
QNBFS Daily Technical Trader Qatar - October 27, 2021 التحليل الفني اليومي لب...QNBFS Daily Technical Trader Qatar - October 27, 2021 التحليل الفني اليومي لب...
QNBFS Daily Technical Trader Qatar - October 27, 2021 التحليل الفني اليومي لب...
 
QNBFS Daily Technical Trader Qatar - November 03, 2021 التحليل الفني اليومي ل...
QNBFS Daily Technical Trader Qatar - November 03, 2021 التحليل الفني اليومي ل...QNBFS Daily Technical Trader Qatar - November 03, 2021 التحليل الفني اليومي ل...
QNBFS Daily Technical Trader Qatar - November 03, 2021 التحليل الفني اليومي ل...
 
QNBFS Daily Technical Trader Qatar - April 01, 2023 التحليل الفني اليومي لبور...
QNBFS Daily Technical Trader Qatar - April 01, 2023 التحليل الفني اليومي لبور...QNBFS Daily Technical Trader Qatar - April 01, 2023 التحليل الفني اليومي لبور...
QNBFS Daily Technical Trader Qatar - April 01, 2023 التحليل الفني اليومي لبور...
 
QNBFS Daily Technical Trader Qatar - December 21, 2021 التحليل الفني اليومي ل...
QNBFS Daily Technical Trader Qatar - December 21, 2021 التحليل الفني اليومي ل...QNBFS Daily Technical Trader Qatar - December 21, 2021 التحليل الفني اليومي ل...
QNBFS Daily Technical Trader Qatar - December 21, 2021 التحليل الفني اليومي ل...
 

Recently uploaded

Financial institutions facilitate financing, economic transactions, issue fun...
Financial institutions facilitate financing, economic transactions, issue fun...Financial institutions facilitate financing, economic transactions, issue fun...
Financial institutions facilitate financing, economic transactions, issue fun...Avanish Goel
 
Classical Theory of Macroeconomics by Adam Smith
Classical Theory of Macroeconomics by Adam SmithClassical Theory of Macroeconomics by Adam Smith
Classical Theory of Macroeconomics by Adam SmithAdamYassin2
 
VIP Call Girls LB Nagar ( Hyderabad ) Phone 8250192130 | ₹5k To 25k With Room...
VIP Call Girls LB Nagar ( Hyderabad ) Phone 8250192130 | ₹5k To 25k With Room...VIP Call Girls LB Nagar ( Hyderabad ) Phone 8250192130 | ₹5k To 25k With Room...
VIP Call Girls LB Nagar ( Hyderabad ) Phone 8250192130 | ₹5k To 25k With Room...Suhani Kapoor
 
Interimreport1 January–31 March2024 Elo Mutual Pension Insurance Company
Interimreport1 January–31 March2024 Elo Mutual Pension Insurance CompanyInterimreport1 January–31 March2024 Elo Mutual Pension Insurance Company
Interimreport1 January–31 March2024 Elo Mutual Pension Insurance CompanyTyöeläkeyhtiö Elo
 
VIP Kolkata Call Girl Jodhpur Park 👉 8250192130 Available With Room
VIP Kolkata Call Girl Jodhpur Park 👉 8250192130  Available With RoomVIP Kolkata Call Girl Jodhpur Park 👉 8250192130  Available With Room
VIP Kolkata Call Girl Jodhpur Park 👉 8250192130 Available With Roomdivyansh0kumar0
 
Independent Lucknow Call Girls 8923113531WhatsApp Lucknow Call Girls make you...
Independent Lucknow Call Girls 8923113531WhatsApp Lucknow Call Girls make you...Independent Lucknow Call Girls 8923113531WhatsApp Lucknow Call Girls make you...
Independent Lucknow Call Girls 8923113531WhatsApp Lucknow Call Girls make you...makika9823
 
The Triple Threat | Article on Global Resession | Harsh Kumar
The Triple Threat | Article on Global Resession | Harsh KumarThe Triple Threat | Article on Global Resession | Harsh Kumar
The Triple Threat | Article on Global Resession | Harsh KumarHarsh Kumar
 
OAT_RI_Ep19 WeighingTheRisks_Apr24_TheYellowMetal.pptx
OAT_RI_Ep19 WeighingTheRisks_Apr24_TheYellowMetal.pptxOAT_RI_Ep19 WeighingTheRisks_Apr24_TheYellowMetal.pptx
OAT_RI_Ep19 WeighingTheRisks_Apr24_TheYellowMetal.pptxhiddenlevers
 
Russian Call Girls In Gtb Nagar (Delhi) 9711199012 💋✔💕😘 Naughty Call Girls Se...
Russian Call Girls In Gtb Nagar (Delhi) 9711199012 💋✔💕😘 Naughty Call Girls Se...Russian Call Girls In Gtb Nagar (Delhi) 9711199012 💋✔💕😘 Naughty Call Girls Se...
Russian Call Girls In Gtb Nagar (Delhi) 9711199012 💋✔💕😘 Naughty Call Girls Se...shivangimorya083
 
Authentic No 1 Amil Baba In Pakistan Authentic No 1 Amil Baba In Karachi No 1...
Authentic No 1 Amil Baba In Pakistan Authentic No 1 Amil Baba In Karachi No 1...Authentic No 1 Amil Baba In Pakistan Authentic No 1 Amil Baba In Karachi No 1...
Authentic No 1 Amil Baba In Pakistan Authentic No 1 Amil Baba In Karachi No 1...First NO1 World Amil baba in Faisalabad
 
call girls in Nand Nagri (DELHI) 🔝 >༒9953330565🔝 genuine Escort Service 🔝✔️✔️
call girls in  Nand Nagri (DELHI) 🔝 >༒9953330565🔝 genuine Escort Service 🔝✔️✔️call girls in  Nand Nagri (DELHI) 🔝 >༒9953330565🔝 genuine Escort Service 🔝✔️✔️
call girls in Nand Nagri (DELHI) 🔝 >༒9953330565🔝 genuine Escort Service 🔝✔️✔️9953056974 Low Rate Call Girls In Saket, Delhi NCR
 
Instant Issue Debit Cards - School Designs
Instant Issue Debit Cards - School DesignsInstant Issue Debit Cards - School Designs
Instant Issue Debit Cards - School Designsegoetzinger
 
Quantitative Analysis of Retail Sector Companies
Quantitative Analysis of Retail Sector CompaniesQuantitative Analysis of Retail Sector Companies
Quantitative Analysis of Retail Sector Companiesprashantbhati354
 
Lundin Gold April 2024 Corporate Presentation v4.pdf
Lundin Gold April 2024 Corporate Presentation v4.pdfLundin Gold April 2024 Corporate Presentation v4.pdf
Lundin Gold April 2024 Corporate Presentation v4.pdfAdnet Communications
 
Q3 2024 Earnings Conference Call and Webcast Slides
Q3 2024 Earnings Conference Call and Webcast SlidesQ3 2024 Earnings Conference Call and Webcast Slides
Q3 2024 Earnings Conference Call and Webcast SlidesMarketing847413
 
SBP-Market-Operations and market managment
SBP-Market-Operations and market managmentSBP-Market-Operations and market managment
SBP-Market-Operations and market managmentfactical
 
Call Girls Service Nagpur Maya Call 7001035870 Meet With Nagpur Escorts
Call Girls Service Nagpur Maya Call 7001035870 Meet With Nagpur EscortsCall Girls Service Nagpur Maya Call 7001035870 Meet With Nagpur Escorts
Call Girls Service Nagpur Maya Call 7001035870 Meet With Nagpur Escortsranjana rawat
 
BPPG response - Options for Defined Benefit schemes - 19Apr24.pdf
BPPG response - Options for Defined Benefit schemes - 19Apr24.pdfBPPG response - Options for Defined Benefit schemes - 19Apr24.pdf
BPPG response - Options for Defined Benefit schemes - 19Apr24.pdfHenry Tapper
 
Malad Call Girl in Services 9892124323 | ₹,4500 With Room Free Delivery
Malad Call Girl in Services  9892124323 | ₹,4500 With Room Free DeliveryMalad Call Girl in Services  9892124323 | ₹,4500 With Room Free Delivery
Malad Call Girl in Services 9892124323 | ₹,4500 With Room Free DeliveryPooja Nehwal
 

Recently uploaded (20)

Financial institutions facilitate financing, economic transactions, issue fun...
Financial institutions facilitate financing, economic transactions, issue fun...Financial institutions facilitate financing, economic transactions, issue fun...
Financial institutions facilitate financing, economic transactions, issue fun...
 
Classical Theory of Macroeconomics by Adam Smith
Classical Theory of Macroeconomics by Adam SmithClassical Theory of Macroeconomics by Adam Smith
Classical Theory of Macroeconomics by Adam Smith
 
VIP Call Girls LB Nagar ( Hyderabad ) Phone 8250192130 | ₹5k To 25k With Room...
VIP Call Girls LB Nagar ( Hyderabad ) Phone 8250192130 | ₹5k To 25k With Room...VIP Call Girls LB Nagar ( Hyderabad ) Phone 8250192130 | ₹5k To 25k With Room...
VIP Call Girls LB Nagar ( Hyderabad ) Phone 8250192130 | ₹5k To 25k With Room...
 
Interimreport1 January–31 March2024 Elo Mutual Pension Insurance Company
Interimreport1 January–31 March2024 Elo Mutual Pension Insurance CompanyInterimreport1 January–31 March2024 Elo Mutual Pension Insurance Company
Interimreport1 January–31 March2024 Elo Mutual Pension Insurance Company
 
VIP Kolkata Call Girl Jodhpur Park 👉 8250192130 Available With Room
VIP Kolkata Call Girl Jodhpur Park 👉 8250192130  Available With RoomVIP Kolkata Call Girl Jodhpur Park 👉 8250192130  Available With Room
VIP Kolkata Call Girl Jodhpur Park 👉 8250192130 Available With Room
 
Independent Lucknow Call Girls 8923113531WhatsApp Lucknow Call Girls make you...
Independent Lucknow Call Girls 8923113531WhatsApp Lucknow Call Girls make you...Independent Lucknow Call Girls 8923113531WhatsApp Lucknow Call Girls make you...
Independent Lucknow Call Girls 8923113531WhatsApp Lucknow Call Girls make you...
 
The Triple Threat | Article on Global Resession | Harsh Kumar
The Triple Threat | Article on Global Resession | Harsh KumarThe Triple Threat | Article on Global Resession | Harsh Kumar
The Triple Threat | Article on Global Resession | Harsh Kumar
 
OAT_RI_Ep19 WeighingTheRisks_Apr24_TheYellowMetal.pptx
OAT_RI_Ep19 WeighingTheRisks_Apr24_TheYellowMetal.pptxOAT_RI_Ep19 WeighingTheRisks_Apr24_TheYellowMetal.pptx
OAT_RI_Ep19 WeighingTheRisks_Apr24_TheYellowMetal.pptx
 
Russian Call Girls In Gtb Nagar (Delhi) 9711199012 💋✔💕😘 Naughty Call Girls Se...
Russian Call Girls In Gtb Nagar (Delhi) 9711199012 💋✔💕😘 Naughty Call Girls Se...Russian Call Girls In Gtb Nagar (Delhi) 9711199012 💋✔💕😘 Naughty Call Girls Se...
Russian Call Girls In Gtb Nagar (Delhi) 9711199012 💋✔💕😘 Naughty Call Girls Se...
 
Authentic No 1 Amil Baba In Pakistan Authentic No 1 Amil Baba In Karachi No 1...
Authentic No 1 Amil Baba In Pakistan Authentic No 1 Amil Baba In Karachi No 1...Authentic No 1 Amil Baba In Pakistan Authentic No 1 Amil Baba In Karachi No 1...
Authentic No 1 Amil Baba In Pakistan Authentic No 1 Amil Baba In Karachi No 1...
 
call girls in Nand Nagri (DELHI) 🔝 >༒9953330565🔝 genuine Escort Service 🔝✔️✔️
call girls in  Nand Nagri (DELHI) 🔝 >༒9953330565🔝 genuine Escort Service 🔝✔️✔️call girls in  Nand Nagri (DELHI) 🔝 >༒9953330565🔝 genuine Escort Service 🔝✔️✔️
call girls in Nand Nagri (DELHI) 🔝 >༒9953330565🔝 genuine Escort Service 🔝✔️✔️
 
Commercial Bank Economic Capsule - April 2024
Commercial Bank Economic Capsule - April 2024Commercial Bank Economic Capsule - April 2024
Commercial Bank Economic Capsule - April 2024
 
Instant Issue Debit Cards - School Designs
Instant Issue Debit Cards - School DesignsInstant Issue Debit Cards - School Designs
Instant Issue Debit Cards - School Designs
 
Quantitative Analysis of Retail Sector Companies
Quantitative Analysis of Retail Sector CompaniesQuantitative Analysis of Retail Sector Companies
Quantitative Analysis of Retail Sector Companies
 
Lundin Gold April 2024 Corporate Presentation v4.pdf
Lundin Gold April 2024 Corporate Presentation v4.pdfLundin Gold April 2024 Corporate Presentation v4.pdf
Lundin Gold April 2024 Corporate Presentation v4.pdf
 
Q3 2024 Earnings Conference Call and Webcast Slides
Q3 2024 Earnings Conference Call and Webcast SlidesQ3 2024 Earnings Conference Call and Webcast Slides
Q3 2024 Earnings Conference Call and Webcast Slides
 
SBP-Market-Operations and market managment
SBP-Market-Operations and market managmentSBP-Market-Operations and market managment
SBP-Market-Operations and market managment
 
Call Girls Service Nagpur Maya Call 7001035870 Meet With Nagpur Escorts
Call Girls Service Nagpur Maya Call 7001035870 Meet With Nagpur EscortsCall Girls Service Nagpur Maya Call 7001035870 Meet With Nagpur Escorts
Call Girls Service Nagpur Maya Call 7001035870 Meet With Nagpur Escorts
 
BPPG response - Options for Defined Benefit schemes - 19Apr24.pdf
BPPG response - Options for Defined Benefit schemes - 19Apr24.pdfBPPG response - Options for Defined Benefit schemes - 19Apr24.pdf
BPPG response - Options for Defined Benefit schemes - 19Apr24.pdf
 
Malad Call Girl in Services 9892124323 | ₹,4500 With Room Free Delivery
Malad Call Girl in Services  9892124323 | ₹,4500 With Room Free DeliveryMalad Call Girl in Services  9892124323 | ₹,4500 With Room Free Delivery
Malad Call Girl in Services 9892124323 | ₹,4500 With Room Free Delivery
 

Introduction to Technical Analysis in Investment Trading

  • 1. TECHNICAL INDICATORS INTRODUCTION ........................................................................................................................................ 2 MOVING AVERAGES ................................................................................................................................ 2 STOCHASTICS (%K, %D FAST, %D SLOW)........................................................................................ 4 RELATIVE STRENGTH INDEX (RSI) .................................................................................................... 5 MOVING AVERAGE CONVERGENCE DIVERGENCE (MACD) ...................................................... 7 BOLLINGER BANDS ................................................................................................................................ 10 COMMODITY CHANNEL INDEX (CCI) .............................................................................................. 13 DIRECTIONAL INDICATORS (ADX, +DI/-DI, DMI).......................................................................... 15 TRIPLE EXPONENTIAL AVERAGE (TRIX) ....................................................................................... 16 Any unauthorized reproduction for commercial usage is strictly prohibited. © Prashant Ram, All rights reserved
  • 2. __________________________________Technical Analysis____________________________________ Introduction Technical Analysis is the practice of analyzing stock charts to uncover patterns in stock prices and predict the future behavior of the stock. This document introduces and describes in detail the calculation of some major Technical Indicators. The Technical Indicators (TAs) module form a part of most of the major trading packages available in the market today including Realtick, esignal, Bloomberg etc. MOVING AVERAGES Calculation: SIMPLE MOVING AVERAGE (SMA) SMA = Σ Prices / N Where, N is the time period over which the SMA is calculated Example: Following is SMA calculation over 5-day period SMA 1-Nov to 5-Nov EXPONENTIAL MOVING AVERAGE (EMA) EMAt = EMAt-1 + A(Pt - EMAt-1) With EMA1 = P1 A = 2 / (period -1) Note: EMA at time T is the EMA at time T-1, plus Alpha times the difference between the current price and EMA T-1. Thus based on the value of Alpha, EMA “reacts” more or lesser on the new price. Copyright © 2006 Prashant Ram, All rights reserved_______________________________________ 2
  • 3. __________________________________Technical Analysis____________________________________ Calculation: Closing EMA = 22.33 – 0.5 * (22.54 – 22.33) Dates Prices SMA EMA 1-Nov 22.33 Note: A = 2/ (period – 1) = 2 / (5-1) = 0.5 2-Nov 22.54 22.44 3-Nov 23.56 23.00 4-Nov 23.50 23.25 EMA = 22.44 – 0.5 * (23.56 – 22.44) 5-Nov 24.59 23.30 23.92 8-Nov 27.00 24.24 25.46 9-Nov 26.98 25.13 26.22 10-Nov 26.55 25.72 26.38 11-Nov 26.54 26.33 26.46 12-Nov 25.30 26.47 25.88 15-Nov 25.00 26.07 25.44 16-Nov 25.98 25.87 25.71 Usage and Description: One of the most basic and widely used indicators in a technical analyst's tool box, moving averages help traders verify existing trends, identify emerging trends, and view overextended trends about to reverse. Moving averages are lines overlaid on a chart indicating long term price trends with short term fluctuations smoothed out. There are three basic types of moving averages: • Simple • Weighted • Exponential A simple moving average gives equal weight to each price point over the specified period. The user defines whether the high, low, or close is used and these price points are added together and averaged. This average price point is then added to the existing string and a line is formed. With the addition of each new price point the sample set drops off the oldest point. The simple moving average is probably the most widely used moving average. A weighted moving average gives more emphasis to the latest data. A weighted moving average multiplies each data point by a weighting factor which differs from day to day. These figures are added and divided by the sum of the weighting factors. A weighted moving average allows the user to successfully smooth out a curve while having the average more responsive to current price changes. An exponential moving average is another way of "weighting" the more recent data. An exponential moving average multiplies a percentage of the most recent price by the previous period's average price. Defining the optimum moving average for a particular currency pair involves "curve fitting". Curve fitting is the process of selecting the right number of periods with the correct type of moving average to produce the results the user is trying to achieve. By trial and error, technicians work with the time periods to fit the price data. Copyright © 2006 Prashant Ram, All rights reserved_______________________________________ 3
  • 4. __________________________________Technical Analysis____________________________________ After determining the optimum moving average for a currency, this average price line can be used as a line of support in maintaining a long position or resistance in maintaining a short position. Breaches of this line can also be used as a signal that a currency is in the process of reversing course, in which case a trader will want to pare back an existing position or come up with entry levels for a new position Reference: 1. http://www.forex.com/forex_technical_indicators.html STOCHASTICS (%K, %D Fast, %D Slow) Description and Usage: Stochastic studies, or oscillators, are another useful tool for monitoring the expected sustainability of a trend. They provide a trader with information about the closing price in the current trading period relative to the prior performance of the instrument being analyzed. Stochastics are measured and represented by two different lines, %K and %D and are plotted on a scale ranging from 0 to 100. Indications above 80 represent strong upward movement while level indications below 20 represent strong downward movements. Fast stochastics (%K) can be very choppy. One can reduce choppiness by either increasing the number of periods or by using the further smoothed form, %D Slow. %D Slow is a moving average of %D. To create %D Slow you must select the number of intervals to include in the average as well as the parameters used to create %K and %D. Calculation: %K = [ (Close – Low) / (High – Low) ] * 100 Where, Close = Closing price for that period Low = Lowest price for that period High = Highest price for that period From above equation you will notice that 1. Since, (Close – Low) will always be <= (High – Low), %K will always be between 0 and 100. i.e. When Closing Price = Low , %K = 0 When Closing price = High, %K = 100 2. Note: Since (Close – Low) is a fraction of (High – Low) , %K will increase if the security closes at a higher price i.e. closer to the highest price. Closing Copyright © 2006 Prashant Ram, All rights reserved_______________________________________ 4
  • 5. __________________________________Technical Analysis____________________________________ levels that are consistently near the top of the range indicate accumulation (buying pressure) and those near the bottom of the range indicate distribution (selling pressure). %D (fast) = SMA (%K) %D (slow)k = (9/10) * %D(slow)k-1 + (1/10) *%Dk Reference: 1. http://www.stockcharts.com/education/IndicatorAnalysis/indic_stochasticOscillat or.html RELATIVE STRENGTH INDEX (RSI) Description and Usage: A high RSI (upwards of 80) indicates that the security is overbought and suggests that a downward trend in the price is expected. Consequently a low RSI (lower than 20) is indicative that the security is oversold and the prices of the security are expected to rise (RSI values range between 0 and 100). Other ways RSI can be used is as follows, Center line Cross over The centerline for RSI is 50. Reading above 50 indicates that average gains are higher than average losses and a reading below 50 indicates that losses are winning the battle. Divergence A rising RSI over a falling stock price indicates a positive divergence which indicates a buy signal. The underlying stock will soon reverse its direction soon after a divergence. Similarly, a falling RSI over a rising stock price indicates a negative divergence and indicates that prices may be expected to fall (See chart below). Copyright © 2006 Prashant Ram, All rights reserved_______________________________________ 5
  • 6. __________________________________Technical Analysis____________________________________ Calculation: RSI = 100 - [ 100 / (1 + RS) ] RS = (Avg of N period UP Close) / (Avg of N Period DOWN Close) N is typically, 14 period Example: Following example calculates RSI over a 14 day period, 1. Date Close UP DOWN 22.61 – 22.44 Up close since 1-Nov 22.44 prices are closing 2-Nov 22.61 0.17 up 3-Nov 22.67 0.06 4-Nov 22.88 0.21 5-Nov 23.36 0.48 8-Nov 23.23 -0.13 9-Nov 23.05 -0.18 23.23 – 23.36 10-Nov 22.86 -0.19 Down close since prices are closing 11-Nov 23.17 0.31 down 12-Nov 23.69 0.52 15-Nov 23.77 0.08 16-Nov 23.84 0.07 17-Nov 24.32 0.48 18-Nov 24.80 0.48 14 Days Total 2.86 0.5 2. Avg of 14 period UP Close = 2.86 / 14 = 0.204 Avg of 14 period DOWN Close = 0.5 / 14 = 0.036 3. RS = 0.204 / 0.036 = 5.72 1 + RS = 6.72 4. RSI (on 19 Nov) = 100 – [ 100 / 6.72 ] = 85.12 RSI for 19th Nov is 85.12 which is indicative that the stock is possibly overbought and the stock prices are expected to fall. Note how the large series of up days and the very small number of down days led to this up extreme reading. References: 1. http://www.streetauthority.com/terms/r/rsi.asp 2. http://www.stockcharts.com/education/IndicatorAnalysis/indic_RSI.html Copyright © 2006 Prashant Ram, All rights reserved_______________________________________ 6
  • 7. __________________________________Technical Analysis____________________________________ MOVING AVERAGE CONVERGENCE DIVERGENCE (MACD) Calculation: MACD (12,26,9) 1. MACD = EMA (12 period) – EMA (26 period) 2. Trigger Line = EMA (9 period) of MACD Note: The MACD is calculated and then compared with the trigger line (which is a EMA(9 period of MACD). Whenever the MACD crosses the trigger line it is indicative of change in trend. For example if the MACD line crosses up the trigger line it indicates that the prices are rising. Consequently a crossing down is indicative of falling prices. Histogram = MACD – signal, The purpose of the histogram is to help show when a crossing occurs, since when it crosses through zero the MACD crosses the signal line. The histogram can also help visualizing when the two lines are coming together. Both may still be rising, but coming together, so a falling histogram suggests a crossover may be approaching. Description and Usage Three types of trading signals are generated, 1. MACD line crossing the signal line 2. MACD line crossing zero line 3. Divergence between price and MACD levels 1. As indicated earlier, the MACD line crossing the EMA(9) signal line is indicative of change in trend, a crossing up suggests rising prices a crossing down suggests falling prices. 2. The zero line is the horizontal line when MACD = 0, A MACD line crossing the EMA(9) signal line and then also crossing the MACD=0 line confirms the trend. See the chart below Copyright © 2006 Prashant Ram, All rights reserved_______________________________________ 7
  • 8. __________________________________Technical Analysis____________________________________ 3. When the MACD trend diverges from the price trend, it can provide a signal that a trending market may slow or reverse. A negative, or bearish, divergence occurs when the MACD is making new lows while prices fail to reach new lows. A positive, or bullish, divergence occurs when the MACD is making new highs while prices fail to reach new highs. See chart below i.e. Positive divergence = MACD high, Prices still showing low, BULLISH MARKET Negative divergence = MACD low, Price may be going high or low, BEARISH MARKET The MACD proves most effective in trending markets rather than choppy, sideways markets. Note: A moving average over a shorter period “reacts” quicker to changes in stock prices. A moving average over a longer period “holds” on to the older values and hence “reacts” slower to the changes in stock prices. Consequently any fluctuations in prices will “move” EMA (12) more than it will move EMA (26). Thus rising stock Copyright © 2006 Prashant Ram, All rights reserved_______________________________________ 8
  • 9. __________________________________Technical Analysis____________________________________ prices will increase the value of the MACD. Since EMA (12) will rise faster than EMA (26). References: 1. http://en.wikipedia.org/wiki/MACD 2. http://www.chartfilter.com/reports/c22.htm Copyright © 2006 Prashant Ram, All rights reserved_______________________________________ 9
  • 10. __________________________________Technical Analysis____________________________________ BOLLINGER BANDS Calculation: Bollinger Bands = SMA +- A. (SD) Where, A is an integer typically set to 3 or 2 SD is standard deviation of the prices over the given SMA period Typical time period is 20-day SMA. Unlike stochastics, which are bounded by 0 and 100, %b can assume negative values and values above 100 when prices are outside of the bands. At 100 we are at the upper band, at 0 we are at the lower band. Above 100 we are above the upper bands and below 0 we are below the lower band. %b = (Close – Lower Band) / (High Band – Low Band) Bandwidth = (Upper Bandwidth – Lower Band) / Middle Band Bollinger bands differ from MAs in that they adapt (i.e. expand or contract) based on the price movements, Since BA = MA +- 3. (SD). Example: Copyright © 2006 Prashant Ram, All rights reserved_______________________________________ 10
  • 11. __________________________________Technical Analysis____________________________________ Usage: Bollinger Bands can be combined with price action and other indicators to generate signals and foreshadow significant moves. A double bottom buy signal is given when prices penetrate the lower band and remain above the lower band after a subsequent low forms. In the chart below the stock penetrated the lower band in late September (red arrow) and then held above on the subsequent test in October. The October breakout above the middle band (green circle) provided the bullish confirmation. Copyright © 2006 Prashant Ram, All rights reserved_______________________________________ 11
  • 12. __________________________________Technical Analysis____________________________________ References: 1. http://www.bollingerbands.com/services/bb/?page=7 2. http://www.stockcharts.com/education/IndicatorAnalysis/indic_Bbands.html Copyright © 2006 Prashant Ram, All rights reserved_______________________________________ 12
  • 13. __________________________________Technical Analysis____________________________________ Commodity Channel Index (CCI) Description and Usage: The CCI determines if the security is overbought or oversold securities. CCI typically oscillates above and below a zero line, within the range of +100 and -100. Values above +100 imply an overbought condition and indicate that the price of the stock will fall. Values below -100 imply an oversold condition and indicate possible future rise in stock prices. The assumption behind the indicator is that commodities (or stocks or bonds) move in cycles, with highs and lows coming at periodic intervals. Lambert recommended using 1/3 of a complete cycle (low to low or high to high) as a time frame for the CCI. If the cycle runs 60 days (a low about every 60 days), then a 20-day CCI would be recommended. Calculation: For the purpose of this example, a 20-day CCI is used. There are four steps in the calculation of CCI. 1. Calculation of typical price, TP = (H+L+C) / 3 Where, H- high price, L- low price , C- closing price NOTE: in some cases we may simply use the closing price Eg. CCI (20, Close), TP = Closing price 2. Calculate the 20-period SMA of the TP 3. Calculate the Mean Deviation. First, calculate the absolute value of the difference between the last period's SMATP and the typical price for each of the past 20 periods. Add all of these absolute values together and divide by 20 to find the Mean Deviation 4. CCI = (TP – SMATP) / ( (0.015) * Mean Deviation ) Example: The following example uses a 5-day period to calculate CCI Copyright © 2006 Prashant Ram, All rights reserved_______________________________________ 13
  • 14. __________________________________Technical Analysis____________________________________ References: 1. http://en.wikipedia.org/wiki/Commodity_Channel_Index 2. http://www.stockcharts.com/education/IndicatorAnalysis/indic_CCI.html Copyright © 2006 Prashant Ram, All rights reserved_______________________________________ 14
  • 15. __________________________________Technical Analysis____________________________________ Directional Indicators (ADX, +DI/-DI, DMI) Description and Usage: The ADX indicator ranges from 0 to 100, although values above 60 are rare. Typically values crossing over 40 and below 20 indicate a corresponding strong trend and weak trend respectively. Note that the ADX DOES NOT indicate bullish or bearish signal but merely reinforces the strength of the current trend. So if the stock is in a downward trend, an ADX value is above 40, it indicates that the downward trend is strong and expected to continue. ON the other hand an ADX of 15 on a downward trend indicates that the trend is weakening and a turn in trend may be expected. Similarly on an upward trend an ADX of 40 indicates that the trend is strong. In the most basic form +DI/-DI can be used to generate buy/sell signals as follows. When +DI crosses –DI upwards it indicates a buy signal, when +DI crosses – DI downward it indicates a sell signal. References: 1. http://www.stockcharts.com/education/IndicatorAnalysis/indic_ADX.html Copyright © 2006 Prashant Ram, All rights reserved_______________________________________ 15
  • 16. __________________________________Technical Analysis____________________________________ Triple Exponential Average (TRIX) Description and Usage: The TRIX is a leading indicator which can be used in conjunction with a signal line to indicate a buy/sell signal or can be used based on the price divergence. When it is used in conjunction with a signal line, when the TRIX crosses up the signal line it is indicative of a buy signal, conversely when it crosses down the signal line it is indicative of a sell signal. Typically TRIX(15,9) is taken where 9-EMA is the signal line. Calculation: For a 15 day period 1. Calculate the 15-day EMA of the closing price 2. Calculate the 15-day EMA of the prices in step 1 3. Calculate the 15-day EMA of the prices in step 2 4. Calculate the 1-day percentage change of the prices in step 3 NOTE: EMAt = EMAt-1 + A (Pt – EMAt-1) Where, EMA0 = P0 A = 2 / (period -1) = 1 / (15 – 1) = 0.14 References: 1. http://www.stockcharts.com/education/IndicatorAnalysis/indic_trix.htm Copyright © 2006 Prashant Ram, All rights reserved_______________________________________ 16