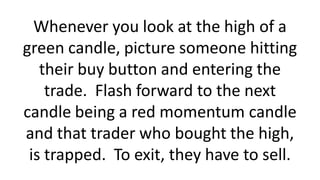
The concept of trapped traders is a
simple one to understand.
While there are two forms of trapped
traders, I only want to focus on one.
The trader who is trapped in a losing position.
These traders, by virtue of being on
the wrong side of the market, can help
propel your trade when they hit the
exits.
The fear and panic by those who enter
a trade only to find the market going
against them can cause a sudden burst
of price movement.
This movement in price is caused by these
traders exiting their positions and creating
order flow in the opposite direction from
which they entered the trade.
Whenever you look at the high of a
green candle, picture someone hitting
their buy button and entering the
trade. Flash forward to the next
candle being a red momentum candle
and that trader who bought the high,
is trapped. To exit, they have to sell.
Now imagine many traders or many
contracts being sold as these traders
exit.
That is what we want to jump on.
I want to show two trading setups that
are designed to capitalize on the plight
of these traders and take advantage of
their mistakes. We've all been there
and know what it's like to find
ourselves on the wrong side of the
colored candles.
Now, let's find a way that we can profit
from those that find themselves in the
same position.
These concepts apply to both long and short positions.
FAILURE TESTS
Some will call these false breakouts
but what is usually happening is the
market is probing levels above certain
areas for some sort of market action.
These probes are designed to grab
stops above key levels as well as entice
buyers or sellers to jump on the break
out. They are also used to gauge
interest at prices they are testing.
This is a daily chart and I have
extended a weekly resistance line
(since 2013) over to the displayed
chart position.
Price is consolidating around the zone
and this can often indicate a potential
for a move in the same direction.
I personally look for strong pushes and
then price to consolidate at the highs
of the move. Often times this can
result in a further move up.
But here, context is key. Many traders
take too small a view of the market
and in doing so, miss out on important
information.
This is not a short term price
resistance zone.
It goes back over two years, it's a
weekly zone, and the dashed line is
not the top end of the zone. It is from
a consolidation of price just under the
extreme high of the zone.
Traders see the large green candle, the
consolidation, probes, and finally a
strong push up. Remember, that
failure candle was actually a strong
green candle at one point.
Traders pile into the long side and that
high of the reversal candle runs right
into the extreme high of the zone!
On the same daily candle, price falls
back into the consolidation zone and
those long are trapped.
They must exit.
The next day, the red candle tells the
story of trapped traders exiting and
new shorts entering the market.
Once you have noted the reversal
candle, you can enter at the break of
the low or go short when price revisits
inside the consolidation area.
Stop placement is simply above the
extreme of the candle. If this is a true
failure, we don't expect price to
exceed that high.
We also don't expect price to stay in
the consolidation area. We want to
see strong movement after those that
are trapped exit the trade.
Failure to see price move in your favor
soon after entry, you can use the "3
period rule" to exit your trade.
3 Period Rule:
If price does not do what you expected
within 3 bars/candles after entry, exit
the position.
COMPLEX PULLBACK
Markets move in waves with impulsive
and corrective moves. A very popular
trading method is trading the
corrective move and entering a trade
in the direction of the trend once the
corrective move signals completion.
The issue is that many traders are
impatient and don't want to risk not
being in the move.
So they enter trades too early at the
first sign of completion. When
stopped out, they still don't want to
miss the move so they re-enter.
Complex pullbacks are a little tricky in
that they can be hiding inside a higher
time frame structure. What may
appear to be a simple pullback will
actually be a two-legged (complex)
pullback on a lower time frame.
Before this complex pullback, we had
what appeared to be simple pullbacks
on this time frame. Remember, simple
pullbacks can be complex pullbacks on
smaller time frames. Price advanced
off the simple but when this complex
completed, price went on an extended
up move.
The first black line indicates the first
leg of this pullback and the pinbar
looks like it could indicate a
resumption of the up trend. Traders
enter and place their stop below the
candle.
But you are looking for a complex
pullback and you sit on your hands.
Price advances then turns around and
turns the longs into trapped traders
and takes out stops. This could also
entice short players who will end up
being trapped if/when price turns back
in the direction of the trend.
Seeing that large green momentum
candle, what could be taking place?
Traders playing complex corrections
take the long
Trapped traders who exited longs
earlier, re-enter
Break out traders who got trapped
short exit their position
Entering these types of trades is not
always straightforward and neither is
the stop placement.
You could drill down to a lower time
frame and look for a pattern such as a
short breakout failure on that chart.
You could buy stop a break of the
highs once price breaches the low of
the first correction and scale buy stop
down until invalid.
Use a momentum indicator turn
such as Stochastic.
Stops can be placed a distance from
the low of the correction but not right
under the pivot. You can still have
price retest the area and execute the
test that was mentioned earlier
thereby taking out your stop.
It's very hard to see your position on
the wrong side of the market and the
execution of your stop not only saves
your account, but feed the account of
others who understand trapped
traders.
Standard technical analysis always tells
traders to place stops around the pivot
areas or just above support/resistance
in a range.
How can you tell traders do that?
Look around your charts and on every
time frame, you will see price enter a
zone beyond the traditional stop zones
and suddenly reverse.
Being on the right side of those moves
can propel your positions into profit
very quickly. The key is to see where
trapped traders may be and get
yourself positioned to take advantage
of them when they have to execute.
Profit from trapped traders with 2 simple setups

Profit from trapped traders with 2 simple setups

  • 2.
    The concept oftrapped traders is a simple one to understand. While there are two forms of trapped traders, I only want to focus on one.
  • 3.
    The trader whois trapped in a losing position. These traders, by virtue of being on the wrong side of the market, can help propel your trade when they hit the exits.
  • 4.
    The fear andpanic by those who enter a trade only to find the market going against them can cause a sudden burst of price movement.
  • 5.
    This movement inprice is caused by these traders exiting their positions and creating order flow in the opposite direction from which they entered the trade.
  • 6.
    Whenever you lookat the high of a green candle, picture someone hitting their buy button and entering the trade. Flash forward to the next candle being a red momentum candle and that trader who bought the high, is trapped. To exit, they have to sell.
  • 7.
    Now imagine manytraders or many contracts being sold as these traders exit. That is what we want to jump on.
  • 8.
    I want toshow two trading setups that are designed to capitalize on the plight of these traders and take advantage of their mistakes. We've all been there and know what it's like to find ourselves on the wrong side of the colored candles.
  • 9.
    Now, let's finda way that we can profit from those that find themselves in the same position. These concepts apply to both long and short positions.
  • 10.
    FAILURE TESTS Some willcall these false breakouts but what is usually happening is the market is probing levels above certain areas for some sort of market action.
  • 11.
    These probes aredesigned to grab stops above key levels as well as entice buyers or sellers to jump on the break out. They are also used to gauge interest at prices they are testing.
  • 12.
    This is adaily chart and I have extended a weekly resistance line (since 2013) over to the displayed chart position. Price is consolidating around the zone and this can often indicate a potential for a move in the same direction.
  • 14.
    I personally lookfor strong pushes and then price to consolidate at the highs of the move. Often times this can result in a further move up.
  • 15.
    But here, contextis key. Many traders take too small a view of the market and in doing so, miss out on important information. This is not a short term price resistance zone.
  • 16.
    It goes backover two years, it's a weekly zone, and the dashed line is not the top end of the zone. It is from a consolidation of price just under the extreme high of the zone.
  • 17.
    Traders see thelarge green candle, the consolidation, probes, and finally a strong push up. Remember, that failure candle was actually a strong green candle at one point.
  • 18.
    Traders pile intothe long side and that high of the reversal candle runs right into the extreme high of the zone!
  • 19.
    On the samedaily candle, price falls back into the consolidation zone and those long are trapped. They must exit.
  • 20.
    The next day,the red candle tells the story of trapped traders exiting and new shorts entering the market.
  • 21.
    Once you havenoted the reversal candle, you can enter at the break of the low or go short when price revisits inside the consolidation area. Stop placement is simply above the extreme of the candle. If this is a true failure, we don't expect price to exceed that high.
  • 22.
    We also don'texpect price to stay in the consolidation area. We want to see strong movement after those that are trapped exit the trade. Failure to see price move in your favor soon after entry, you can use the "3 period rule" to exit your trade.
  • 23.
    3 Period Rule: Ifprice does not do what you expected within 3 bars/candles after entry, exit the position.
  • 24.
    COMPLEX PULLBACK Markets movein waves with impulsive and corrective moves. A very popular trading method is trading the corrective move and entering a trade in the direction of the trend once the corrective move signals completion.
  • 25.
    The issue isthat many traders are impatient and don't want to risk not being in the move. So they enter trades too early at the first sign of completion. When stopped out, they still don't want to miss the move so they re-enter.
  • 26.
    Complex pullbacks area little tricky in that they can be hiding inside a higher time frame structure. What may appear to be a simple pullback will actually be a two-legged (complex) pullback on a lower time frame.
  • 27.
    Before this complexpullback, we had what appeared to be simple pullbacks on this time frame. Remember, simple pullbacks can be complex pullbacks on smaller time frames. Price advanced off the simple but when this complex completed, price went on an extended up move.
  • 29.
    The first blackline indicates the first leg of this pullback and the pinbar looks like it could indicate a resumption of the up trend. Traders enter and place their stop below the candle.
  • 30.
    But you arelooking for a complex pullback and you sit on your hands.
  • 31.
    Price advances thenturns around and turns the longs into trapped traders and takes out stops. This could also entice short players who will end up being trapped if/when price turns back in the direction of the trend.
  • 32.
    Seeing that largegreen momentum candle, what could be taking place?
  • 33.
    Traders playing complexcorrections take the long Trapped traders who exited longs earlier, re-enter Break out traders who got trapped short exit their position
  • 34.
    Entering these typesof trades is not always straightforward and neither is the stop placement.
  • 35.
    You could drilldown to a lower time frame and look for a pattern such as a short breakout failure on that chart.
  • 36.
    You could buystop a break of the highs once price breaches the low of the first correction and scale buy stop down until invalid. Use a momentum indicator turn such as Stochastic.
  • 37.
    Stops can beplaced a distance from the low of the correction but not right under the pivot. You can still have price retest the area and execute the test that was mentioned earlier thereby taking out your stop.
  • 38.
    It's very hardto see your position on the wrong side of the market and the execution of your stop not only saves your account, but feed the account of others who understand trapped traders.
  • 39.
    Standard technical analysisalways tells traders to place stops around the pivot areas or just above support/resistance in a range. How can you tell traders do that?
  • 40.
    Look around yourcharts and on every time frame, you will see price enter a zone beyond the traditional stop zones and suddenly reverse.
  • 41.
    Being on theright side of those moves can propel your positions into profit very quickly. The key is to see where trapped traders may be and get yourself positioned to take advantage of them when they have to execute.