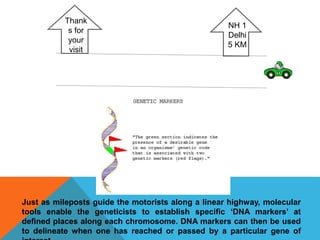
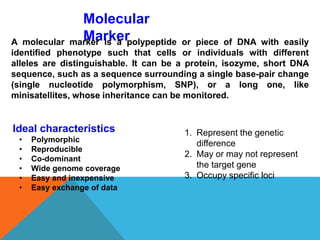
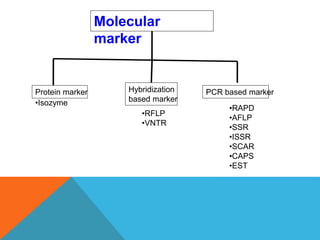
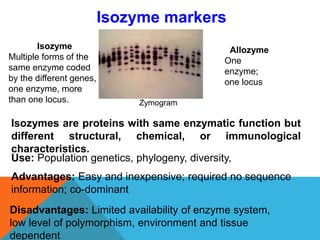
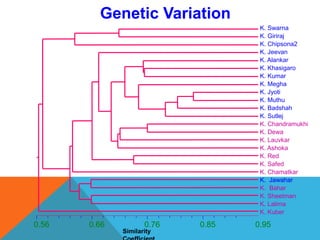
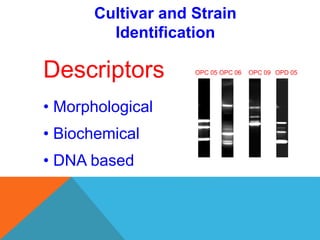
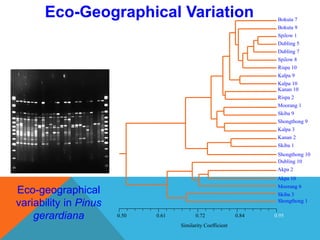
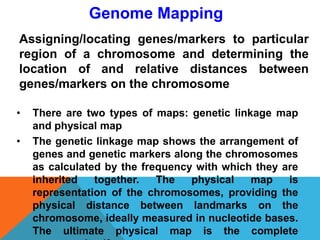
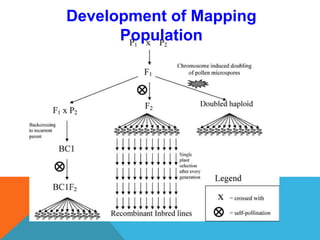
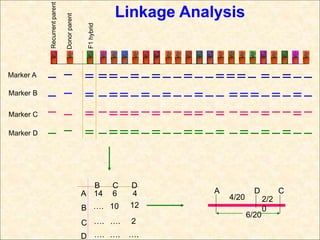
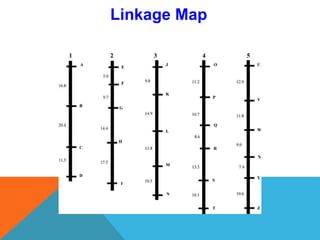
MOLECULAR MATKERS
NH 1
Delhi
5 KM
Thank
s for
your
visit
Just as mileposts guide the motorists along a linear highway, molecular
tools enable the geneticists to establish specific ‘DNA markers’ at
defined places along each chromosome. DNA markers can then be used
to delineate when one has reached or passed by a particular gene of
Molecular
MarkerA molecular marker is a polypeptide or piece of DNA with easily
identified phenotype such that cells or individuals with different
alleles are distinguishable. It can be a protein, isozyme, short DNA
sequence, such as a sequence surrounding a single base-pair change
(single nucleotide polymorphism, SNP), or a long one, like
minisatellites, whose inheritance can be monitored.
Ideal characteristics
• Polymorphic
• Reproducible
• Co-dominant
• Wide genome coverage
• Easy and inexpensive
• Easy exchange of data
1. Represent the genetic
difference
2. May or may not represent
the target gene
3. Occupy specific loci
Molecular
marker
Protein marker Hybridization
based marker
PCR based marker
•RFLP
•VNTR
•RAPD
•AFLP
•SSR
•ISSR
•SCAR
•CAPS
•EST
•Isozyme
Isozyme markers
Zymogram
Isozymes are proteins with same enzymatic function but
different structural, chemical, or immunological
characteristics.
Use: Population genetics, phylogeny, diversity,
Isozyme
Multiple forms of the
same enzyme coded
by the different genes,
one enzyme, more
than one locus.
Allozyme
One
enzyme;
one locus
Advantages: Easy and inexpensive; required no sequence
information; co-dominant
Disadvantages: Limited availability of enzyme system,
low level of polymorphism, environment and tissue
dependent
Restriction Fragment Length Polymorphism
Digestion with
restriction enzyme
Construct genomic or cDNA library
Develop probes
Electrophoresis
and Southern
blotting
Probe labelling
Hybridization
AA aa Aa
Marker scoring
Eco RI Eco RI
Eco RI Eco RI
Probe DNA Label
Labelled probe
Genomic
DNA
Restriction Fragment Length Polymorphism
Polymorphism: Point mutation, insertion, deletion or unequal
crossing over. It depends on enzyme probe combination.
Probes can be cDNA or PstI-derived genomic clone.
Advantages: Highly reproducible, co-dominant, wide genome
coverage, no sequence information, can be used across
species.
Disadvantages: Laborious, require high amount of DNA,
require radioactivity, difficult to automate.
Variable Number of Tandem Repeats (VN
Repetitive DNA
Majority of genome is constituted by tandem arrays of different
types of repetitive DNA, which play important roles in absorbing
mutation. Length polymorphisms arise due to polymerase slippage
during replication or unequal recombination.
Minisatellites
Tandem repeats with a monomer repeat length of about 11–60 bp
Microsatellites
Short tandem of 1 to 6 bp long monomer sequence
VNTR: Restriction digested genomic DNA is hybridized
with a particular minisatellite sequence.
Each variant acts as an inherited allele, allowing them to
be used for personal or parental identification. VNTRs
have become essential to forensic crime investigations,
via DNA fingerprinting and the CODIS database
Variable Number of Tandem Repeats (VN
The Combined DNA Index System (CODIS) is a DNA database funded by the United
States Federal Bureau of Investigation (FBI). It is a computer system that stores DNA
profiles created by federal, state, and local crime laboratories in the United States, with the
ability to search the database to assist in the identification of suspects in crimes
First cycle
Second cycle
Third cycle
Unit length RAPD products
Genomic DNA
Use one random decamer primer and amplify
by polymerase chain reaction
Electrophoresis
AA aa Aa
Marker scoring
40-45 cycles
Random
Amplified
Polymorphi
c DNA
(RAPD)
Random Amplified Polymorphic DNA
(RAPD)
Random Amplified Polymorphic DNA
(RAPD)
Multiple Arbitrary Amplicon Profiling (MAAP)
Collective term for techniques using single arbitrary primers
Use
Diversity, phylogeny
Advantage
Easy, inexpensive, no sequence information, low quantity of DNA, wide
genome coverage.
Disadvantage
Dominant, low reproducibility, sensitive to contamination
Arbitrarily Primed Polymerase Chain Reaction
(AP-PCR)
Uses longer arbitrary primers than RAPDs
DNA Amplification Fingerprinting (DAF)
Uses shorter, 5–8 bp primers
Electrophoresis
AA aa Aa
Marker scoring
Genomic DNA
Digestion with two
restriction enzymes
Ligation of adapter DNA
N
NN
Preselective-amplification
Use two selective primers
NNN
NN
Design longer selective primers
Selective PCR amplification
Amplified
Fragment
Length
Polymorphis
m (AFLP)
Uses
Genetic diversity, phylogeny, fingerprint & cultivar identification, contig
map, criminal & paternity test
Advantages
High polymorphism, wide genome coverage, low quantity of DNA,
amenable to automation
Disadvantages
Dominant, require good quality of DNA, use of radioactivity
AFLP fingerprint
Genomic DNA
P1
P2
Synthesize two primers per locus
from the flanking conserved regions
Polymerase Chain Reaction
Electrophoresis
AA aa Aa
Marker scoring
Simple Sequence Repeats
Di-nucleotide repeat:
CACACACA
Tri-nucleotide repeat:
ATGATGATGATG
Example of allelic variation in
SSRs:
Allele A: CACACACA (4 repeats of
the CA sequence)
Allele B: CACACACACACA (6
repeats of the CA sequence)
Microsatellites are sections of
DNA, consisting of tandemly
repeating mono-, di-, tri-, tetra- or
penta-nucleotide units that are
arranged throughout the genomes
of most eukaryotic species
Uses
Fingerprinting, genome mapping & linkage analysis, marker-assisted
selection
Advantages
Highly reproducible, co-dominant, wide genome coverage, low quantity
of DNA, PCR-based and nonradioactive, amenable to automation
Disadvantages
Need sequence information, can not be used across species
SSR fingerprint
Inter Simple Sequence Repeat (ISSR)
Sequence Tagged Site (STS)
PCR amplification of unique single copy segment
of the genome using long primer, designed based
on already available sequence information. So it
has the advantages of both RAPD (no probe,
PCR-based, rapidity) and RFLP (codominance,
highly reproducible).
Three types- SCAR, CAPS, STMS
Sequence Characterized Amplified Region
(SCAR)Select a unique RAPD fragment linked to a specific trait and
showing polymorphism
Gel cut the fragment, cloned into a suitable vector and end
sequence
Design primers based on the sequence information,
PCR amplification, gel run
High reproducibility as long sequence specific primers are
used, codominant inheritance, low quantity of DNA, quick
& easy, locus specific & can be used in gene mapping and
marker assisted selection (MAS). However, need
sequence information
Sequence Tagged Microsatellite Site (STMS): when microsatellite locus is ta
Cleaved Amplified Polymorphic Sequence
(CAPS)Amplify the target region using long PCR primer
Restriction digestion of the amplified fragment and gel run
High reproducibility as long sequence specific primers are
used, codominant inheritance, low quantity of DNA, quick
& easy, locus specific & can be used in gene mapping and
marker assisted selection (MAS). However, need
sequence information
SNPs are single base pair positions in genomic DNA, at which
different sequence alternatives (alleles) exist in normal
individuals in some population(s), herein the least frequent
allele has an abundance of 1% or greater.
Single Nucleotide Polymorphism
(SNP)
Several types of SNPs are distinguished, according to their
assignment to the structural element of genomic DNA or
their functional effect
Regulatory SNPs (rSNPs)
Involving regulatory regions that control gene expression (promoter SNPs
and some intron SNPs)
Anonymous SNPs
Functional effect is unknown
Candidate SNPs
Presumably having a functional effect
Protein SNPs
Change in the protein function or expression
Single Nucleotide Polymorphism
(SNP)
SNP
Genotyping
The detection of SNP markers on the basis of overlapping
genomic DNA sequences
The detection of SNP markers on the basis of overlapping EST
sequences
The detection of SNP markers on the basis of unique
(nonoverlapping) genomic and EST sequences
The detection of SNP markers on the basis of “shotgun”
sequencing
Allele
Discrimination
A C
T T
A
T
Match
C
T
Mismatch
Hybridization
No hybridization
Allele-specific hybridization
C
T
A
T
Match
C
T
Mismatch
Primer extension
No primer extension
Allele-specific PCR
A
T
Allele
Discrimination
C
T
A
T
Match
C
Mismatch
Nucleotide incorporation
No nucleotide incorporation
Allele-specific single-base primer extension
A
T
Allele
Discrimination
C
T
A
T
Match
C
Mismatch
Nucleotide incorporation
No nucleotide incorporation
Allele-specific single-base primer extension
A
T
Allele
Discrimination
Allele
Discrimination
The most straightforward way to detect an allele-
specific product is to label it by incorporating one or
more nucleotides conjugated to a fluorescent dye.
Direct fluorescence detection is generally used with
solid-phase assay formats (microarrays and bead
arrays) and where allele-specific products are
separated by gel electrophoresis or capillary
electrophoresis
Direct Fluorescence Detection
Fluorescence-based Detection in
Homogenous Solution
When a fluorophore is excited by plane-polarized light, the
fluorescence emitted by the dye is also polarized. This
phenomenon is termed fluorescence polarization (FP).
Complete FP occurs only when the dye molecule is
stationary. Therefore the degree of observed FP is
dependent on how fast a molecule tumbles in solution, and
this is in turn dependent on the volume of the molecule,
which is related to its molecular mass. Therefore changes
in molecular mass (e.g., caused by primer extension,
probe hydrolysis, or invasive cleavage) can be detected by
changes in FP as long as all other conditions (temperature,
viscosity, etc.) remain constant. FP is used as the
detection method in the SnaPshot (Applied Biosciences)
and Acycloprime (Perkin Elmer)
commercial genotyping systems.
Fluorescence Polarization
Signal detection is based on difference in molecular
weights of small DNA fragments rather than the
behavior of a label. The analysis of DNA by mass
spectrometry requires soft ionization (i.e., without
fragmentation) and is usually achieved by Matrix-
Assisted Laser Desorption/Ionization- Time of Flight
(MALDI-TOF) analysis. The MALDI procedure involves
mixing the allele-specific products of the
discrimination assay with a matrix compound on a
metal plate. The mixture is then heated with a short
laser pulse, causing it to expand into the gas phase
where ionization is achieved by applying a strong
potential difference. Ions are accelerated toward the
detector and the time of flight (the time taken to reach
the detector) is measured, allowing the mass/charge
Mass Spectrometry
Pyrosequencing is a novel method for sequencing short stretches of DNA based
on the detection of pyrophosphate, a normal by-product of DNA synthesis.
Although similar in principle to primer extension allele discrimination methods,
pyrosequencing is suitable not only for typing SNPs but also for scoring entire
haplotypes (groups of linked SNPs).
Pyrosequencing
A
T
PPi
Adenosine 5’ phosphosulfate (APS)
ATP sulfurylase
ATP
Luciferin
Oxyluciferin + Light
Luciferase
Genic Molecular Marker (GMM)
The markers, derived from genomic DNA, could belong to either the
transcribed or the non-transcribed part of the genome without any
information available on their functions. In contrast, GMMs are developed
from coding sequences like ESTs or fully characterized genes with known
functions.
Gene-targeted markers (GTMs)
Derived from polymorphisms within genes, however not necessarily
involved in phenotypic trait variation, e.g. untranslated regions (UTRs) of
EST sequences.
Functional markers (FMs)
Derived from polymorphic sequences or sites within genes and, thus, more
likely to be causally involved in phenotypic trait variation (e.g. candidate
gene-based molecular markers).
Indirect functional markers (IFMs): For which the role for phenotypic trait
variation is indirectly known, and Direct functional markers (DFMs): for
which the role for the phenotypic trait variation is well proven.
Genic Molecular Marker (GMM)
Expressed Sequence
Tag
Unigene Sequence Data
In silico mining
Software tools are
used to identify SSR,
SNP etc.
Direct mapping
Can be used as
RFLP probe or for
primer designing for
STS, CAPS etc.
DNA Fingerprinting
• Genetic variation
• Cultivar and strain identification
• Eco-geographical variation
• Mutation detection
• Selection of diverse parents
• Germplasm conservation
Genetic Variation
Similarity
0.56 0.66 0.76 0.85 0.95
K. Swarna
K. Giriraj
K. Chipsona2
K. Jeevan
K. Alankar
K. Khasigaro
K. Kumar
K. Megha
K. Jyoti
K. Muthu
K. Badshah
K. Sutlej
K. Chandramukhi
K. Dewa
K. Lauvkar
K. Ashoka
K. Red
K. Safed
K. Chamatkar
K. Jawahar
K. Bahar
K. Sheetman
K. Lalima
K. Kuber
Cultivar and Strain
Identification
OPC 05 OPC 06 OPC 09 OPD 05Descriptors
• Morphological
• Biochemical
• DNA based
Eco-Geographical Variation
Similarity Coefficient
0.50 0.61 0.72 0.84 0.95
Bokuta 7
Bokuta 9
Spilow 1
Dubling 5
Dubling 7
Spilow 8
Rispa 10
Kalpa 9
Kalpa 10
Kanan 10
Rispa 2
Moorang 1
Skiba 9
Shongthong 9
Kalpa 3
Kanan 2
Skiba 1
Shongthong 10
Dubling 10
Akpa 2
Akpa 10
Moorang 6
Skiba 3
Shongthong 1
Eco-geographical
variability in Pinus
gerardiana
Genome Mapping
Assigning/locating genes/markers to particular
region of a chromosome and determining the
location of and relative distances between
genes/markers on the chromosome
• There are two types of maps: genetic linkage map
and physical map
• The genetic linkage map shows the arrangement of
genes and genetic markers along the chromosomes
as calculated by the frequency with which they are
inherited together. The physical map is
representation of the chromosomes, providing the
physical distance between landmarks on the
chromosome, ideally measured in nucleotide bases.
The ultimate physical map is the complete
Genetic Linkage Map
The three main steps of linkage map
construction are:
(1)Production of a mapping population
(2)Identification of polymorphism
(3)Linkage analysis of markers
Development of Mapping
Population
Marker A
Marker C
Marker D
A
B
B
C
C
D
D
14 6 4
…. 10 12
…. …. 2
…. …. ….
A D C
4/20 2/2
0
6/20
Recurrentparent
Donorparent
F1hybridMarker B
Linkage Analysis
Linkage Map
Comparative Mapping or
Synteny• The grass model
• Tomato- potato co-linearity
• Map based prediction of location of
orthologous genes
Cross mapping of DNA
probes in a range of cereal
crops has led to the
widespread identification of
chromosomal regions in
which marker orders are
highly conserved. It is now
possible to describe all the
genomes of grass crop
species by their relationship
to a single reference genome,
rice. Potato genomes were mapped into 12 linkage groups
corresponding to 12 potato chromosomes using tomato cDNA
clones. Three paracentric inversions in chromosomes 5, 9, 10 were
detected in relation to the tomato chromosomes. The other nine
Species kilobases/centimorgan
Arabidopsis 139
Tomato 510
Corn 2140
Physical and genetic distances are resolved by hybridizing clones, which
define closely linked genetic markers, to DNA that has been cut with rare
cutting enzymes. If two clones hybridize to the same fragment, then the
maximum distance between those two clones is the size of the restriction
fragment. As the genetic distance between the loci is known, genetic and
physical distances in this region can be correlated.
Physical
Mapping
The correspondence between genetic and physical distance
varies widely at different locations within a genome due to
recombination suppressed or hotspot regions
Fluorescence in situ Hybridization
(FISH)
Metaphase cell
Array on glass slide
Hybridize with labelled probe
Fluorescent
counterstaining of
chromosome
Visualization on
fluorescent microscope
Marker-assisted
Selection
MAS refers to the use of DNA markers
that are tightly-linked to target loci as
a substitute for or to assist
phenotypic screening
Assumption: DNA markers can reliably
predict phenotype
High-resolution Linkage
Mapping
• Markers must be tightly-linked to target loci.
• Ideally markers should be <5 cM from a gene or QTL
Marker A
QTL
5 cM
RELIABILITY FOR
SELECTION
Using marker A only:
1 – rA = ~95%
Marker A
QTL
Marker B
5 cM 5 cM
Using markers A and B:
1 - 2 rArB = ~99.5%
• Using a pair of flanking markers can greatly improve reliability but
increases time and cost
Marker-assisted
Selection
Markers should be validated by testing their
effectiveness in determining the target
phenotype in independent populations and
different genetic backgrounds, which is referred
to as ‘marker validation’. In other words, marker
validation involves testing the reliability of
markers to predict phenotype. This indicates
whether or not a marker could be used in
routine screening for MAS.
Validation of
Markers
Marker
Conversion
There are two instances where markers may
need to be converted into other types of
markers: when there are problems of
reproducibility (e.g. RAPDs) and when the
marker technique is complicated, time-
consuming or expensive (e.g. RFLPs or
AFLPs). The problem of reproducibility may be
overcome by the development. of sequence
characterised amplified regions (SCARs) or
sequence-tagged sites (STSs) derived by
cloning and sequencing specific RAPD
markers.
F2
P2
F1
P1 x
large populations consisting of thousands
of plants
ResistantSusceptible
MARKER-ASSISTED SELECTION (MAS)
Method whereby phenotypic selection is based on DNA markers
Marker-assisted
Selection
• Simpler method compared to
phenotypic screening
– Especially for traits with laborious screening
– May save time and resources
• Selection at seedling stage
– Important for traits such as grain quality
– Can select before transplanting in rice
• Increased reliability
– No environmental effects
– Can discriminate between homozygotes and
heterozygotes and select single plants
Marker-assisted
Selection
• more accurate and efficient selection
of specific genotypes
– May lead to accelerated variety
development
• more efficient use of resources
– Especially field trials
Marker-assisted
Selection
Map Based Cloning
• Marker targeting
• Chromosome
walking
Chromosome
Bulked Segregants Analysis
(BSA)
A BGen
e
Chromosome Walking
Chromosome Landing
A B CGen
e
0.78 cM
0.16 cM 11.3 cM
B D E F
Gene
Target Gene Identification
RFLP B RFLP G RFLP D RFLP H RFLP E
Gene
• High-resolution mapping to demonstrate cosegregation of
the candidate clone with the phenotype
• Demonstration that the expression pattern of the gene is
consistent with the phenotype, for example, that it is
transcribed in the appropriate tissue(s) and/or induced by
the appropriate stimulus
• Determination of the DNA sequence of the gene and its
comparison with those in sequence databases to identify
any homology with genes of known function
• Probing mutant lines with the cDNAs to identify alterations
of the DNA or mRNA from the wild type
• Complementation of the mutant phenotype by
transformation with the gene
Target Gene Validation

Molecular marker by anil bl gather

  • 1.
  • 2.
    NH 1 Delhi 5 KM Thank sfor your visit Just as mileposts guide the motorists along a linear highway, molecular tools enable the geneticists to establish specific ‘DNA markers’ at defined places along each chromosome. DNA markers can then be used to delineate when one has reached or passed by a particular gene of
  • 3.
    Molecular MarkerA molecular markeris a polypeptide or piece of DNA with easily identified phenotype such that cells or individuals with different alleles are distinguishable. It can be a protein, isozyme, short DNA sequence, such as a sequence surrounding a single base-pair change (single nucleotide polymorphism, SNP), or a long one, like minisatellites, whose inheritance can be monitored. Ideal characteristics • Polymorphic • Reproducible • Co-dominant • Wide genome coverage • Easy and inexpensive • Easy exchange of data 1. Represent the genetic difference 2. May or may not represent the target gene 3. Occupy specific loci
  • 4.
    Molecular marker Protein marker Hybridization basedmarker PCR based marker •RFLP •VNTR •RAPD •AFLP •SSR •ISSR •SCAR •CAPS •EST •Isozyme
  • 5.
    Isozyme markers Zymogram Isozymes areproteins with same enzymatic function but different structural, chemical, or immunological characteristics. Use: Population genetics, phylogeny, diversity, Isozyme Multiple forms of the same enzyme coded by the different genes, one enzyme, more than one locus. Allozyme One enzyme; one locus Advantages: Easy and inexpensive; required no sequence information; co-dominant Disadvantages: Limited availability of enzyme system, low level of polymorphism, environment and tissue dependent
  • 6.
    Restriction Fragment LengthPolymorphism Digestion with restriction enzyme Construct genomic or cDNA library Develop probes Electrophoresis and Southern blotting Probe labelling Hybridization AA aa Aa Marker scoring Eco RI Eco RI Eco RI Eco RI Probe DNA Label Labelled probe Genomic DNA
  • 7.
    Restriction Fragment LengthPolymorphism Polymorphism: Point mutation, insertion, deletion or unequal crossing over. It depends on enzyme probe combination. Probes can be cDNA or PstI-derived genomic clone. Advantages: Highly reproducible, co-dominant, wide genome coverage, no sequence information, can be used across species. Disadvantages: Laborious, require high amount of DNA, require radioactivity, difficult to automate.
  • 8.
    Variable Number ofTandem Repeats (VN Repetitive DNA Majority of genome is constituted by tandem arrays of different types of repetitive DNA, which play important roles in absorbing mutation. Length polymorphisms arise due to polymerase slippage during replication or unequal recombination. Minisatellites Tandem repeats with a monomer repeat length of about 11–60 bp Microsatellites Short tandem of 1 to 6 bp long monomer sequence VNTR: Restriction digested genomic DNA is hybridized with a particular minisatellite sequence.
  • 9.
    Each variant actsas an inherited allele, allowing them to be used for personal or parental identification. VNTRs have become essential to forensic crime investigations, via DNA fingerprinting and the CODIS database Variable Number of Tandem Repeats (VN The Combined DNA Index System (CODIS) is a DNA database funded by the United States Federal Bureau of Investigation (FBI). It is a computer system that stores DNA profiles created by federal, state, and local crime laboratories in the United States, with the ability to search the database to assist in the identification of suspects in crimes
  • 10.
    First cycle Second cycle Thirdcycle Unit length RAPD products Genomic DNA Use one random decamer primer and amplify by polymerase chain reaction Electrophoresis AA aa Aa Marker scoring 40-45 cycles Random Amplified Polymorphi c DNA (RAPD)
  • 11.
  • 12.
    Random Amplified PolymorphicDNA (RAPD) Multiple Arbitrary Amplicon Profiling (MAAP) Collective term for techniques using single arbitrary primers Use Diversity, phylogeny Advantage Easy, inexpensive, no sequence information, low quantity of DNA, wide genome coverage. Disadvantage Dominant, low reproducibility, sensitive to contamination Arbitrarily Primed Polymerase Chain Reaction (AP-PCR) Uses longer arbitrary primers than RAPDs DNA Amplification Fingerprinting (DAF) Uses shorter, 5–8 bp primers
  • 13.
    Electrophoresis AA aa Aa Markerscoring Genomic DNA Digestion with two restriction enzymes Ligation of adapter DNA N NN Preselective-amplification Use two selective primers NNN NN Design longer selective primers Selective PCR amplification Amplified Fragment Length Polymorphis m (AFLP)
  • 14.
    Uses Genetic diversity, phylogeny,fingerprint & cultivar identification, contig map, criminal & paternity test Advantages High polymorphism, wide genome coverage, low quantity of DNA, amenable to automation Disadvantages Dominant, require good quality of DNA, use of radioactivity AFLP fingerprint
  • 15.
    Genomic DNA P1 P2 Synthesize twoprimers per locus from the flanking conserved regions Polymerase Chain Reaction Electrophoresis AA aa Aa Marker scoring Simple Sequence Repeats Di-nucleotide repeat: CACACACA Tri-nucleotide repeat: ATGATGATGATG Example of allelic variation in SSRs: Allele A: CACACACA (4 repeats of the CA sequence) Allele B: CACACACACACA (6 repeats of the CA sequence) Microsatellites are sections of DNA, consisting of tandemly repeating mono-, di-, tri-, tetra- or penta-nucleotide units that are arranged throughout the genomes of most eukaryotic species
  • 16.
    Uses Fingerprinting, genome mapping& linkage analysis, marker-assisted selection Advantages Highly reproducible, co-dominant, wide genome coverage, low quantity of DNA, PCR-based and nonradioactive, amenable to automation Disadvantages Need sequence information, can not be used across species SSR fingerprint
  • 17.
    Inter Simple SequenceRepeat (ISSR)
  • 18.
    Sequence Tagged Site(STS) PCR amplification of unique single copy segment of the genome using long primer, designed based on already available sequence information. So it has the advantages of both RAPD (no probe, PCR-based, rapidity) and RFLP (codominance, highly reproducible). Three types- SCAR, CAPS, STMS
  • 19.
    Sequence Characterized AmplifiedRegion (SCAR)Select a unique RAPD fragment linked to a specific trait and showing polymorphism Gel cut the fragment, cloned into a suitable vector and end sequence Design primers based on the sequence information, PCR amplification, gel run High reproducibility as long sequence specific primers are used, codominant inheritance, low quantity of DNA, quick & easy, locus specific & can be used in gene mapping and marker assisted selection (MAS). However, need sequence information Sequence Tagged Microsatellite Site (STMS): when microsatellite locus is ta
  • 20.
    Cleaved Amplified PolymorphicSequence (CAPS)Amplify the target region using long PCR primer Restriction digestion of the amplified fragment and gel run High reproducibility as long sequence specific primers are used, codominant inheritance, low quantity of DNA, quick & easy, locus specific & can be used in gene mapping and marker assisted selection (MAS). However, need sequence information
  • 21.
    SNPs are singlebase pair positions in genomic DNA, at which different sequence alternatives (alleles) exist in normal individuals in some population(s), herein the least frequent allele has an abundance of 1% or greater. Single Nucleotide Polymorphism (SNP)
  • 22.
    Several types ofSNPs are distinguished, according to their assignment to the structural element of genomic DNA or their functional effect Regulatory SNPs (rSNPs) Involving regulatory regions that control gene expression (promoter SNPs and some intron SNPs) Anonymous SNPs Functional effect is unknown Candidate SNPs Presumably having a functional effect Protein SNPs Change in the protein function or expression Single Nucleotide Polymorphism (SNP)
  • 23.
    SNP Genotyping The detection ofSNP markers on the basis of overlapping genomic DNA sequences The detection of SNP markers on the basis of overlapping EST sequences The detection of SNP markers on the basis of unique (nonoverlapping) genomic and EST sequences The detection of SNP markers on the basis of “shotgun” sequencing
  • 24.
  • 25.
    C T A T Match C T Mismatch Primer extension No primerextension Allele-specific PCR A T Allele Discrimination
  • 26.
    C T A T Match C Mismatch Nucleotide incorporation No nucleotideincorporation Allele-specific single-base primer extension A T Allele Discrimination
  • 27.
    C T A T Match C Mismatch Nucleotide incorporation No nucleotideincorporation Allele-specific single-base primer extension A T Allele Discrimination
  • 28.
  • 29.
    The most straightforwardway to detect an allele- specific product is to label it by incorporating one or more nucleotides conjugated to a fluorescent dye. Direct fluorescence detection is generally used with solid-phase assay formats (microarrays and bead arrays) and where allele-specific products are separated by gel electrophoresis or capillary electrophoresis Direct Fluorescence Detection
  • 30.
  • 31.
    When a fluorophoreis excited by plane-polarized light, the fluorescence emitted by the dye is also polarized. This phenomenon is termed fluorescence polarization (FP). Complete FP occurs only when the dye molecule is stationary. Therefore the degree of observed FP is dependent on how fast a molecule tumbles in solution, and this is in turn dependent on the volume of the molecule, which is related to its molecular mass. Therefore changes in molecular mass (e.g., caused by primer extension, probe hydrolysis, or invasive cleavage) can be detected by changes in FP as long as all other conditions (temperature, viscosity, etc.) remain constant. FP is used as the detection method in the SnaPshot (Applied Biosciences) and Acycloprime (Perkin Elmer) commercial genotyping systems. Fluorescence Polarization
  • 32.
    Signal detection isbased on difference in molecular weights of small DNA fragments rather than the behavior of a label. The analysis of DNA by mass spectrometry requires soft ionization (i.e., without fragmentation) and is usually achieved by Matrix- Assisted Laser Desorption/Ionization- Time of Flight (MALDI-TOF) analysis. The MALDI procedure involves mixing the allele-specific products of the discrimination assay with a matrix compound on a metal plate. The mixture is then heated with a short laser pulse, causing it to expand into the gas phase where ionization is achieved by applying a strong potential difference. Ions are accelerated toward the detector and the time of flight (the time taken to reach the detector) is measured, allowing the mass/charge Mass Spectrometry
  • 33.
    Pyrosequencing is anovel method for sequencing short stretches of DNA based on the detection of pyrophosphate, a normal by-product of DNA synthesis. Although similar in principle to primer extension allele discrimination methods, pyrosequencing is suitable not only for typing SNPs but also for scoring entire haplotypes (groups of linked SNPs). Pyrosequencing A T PPi Adenosine 5’ phosphosulfate (APS) ATP sulfurylase ATP Luciferin Oxyluciferin + Light Luciferase
  • 34.
    Genic Molecular Marker(GMM) The markers, derived from genomic DNA, could belong to either the transcribed or the non-transcribed part of the genome without any information available on their functions. In contrast, GMMs are developed from coding sequences like ESTs or fully characterized genes with known functions. Gene-targeted markers (GTMs) Derived from polymorphisms within genes, however not necessarily involved in phenotypic trait variation, e.g. untranslated regions (UTRs) of EST sequences. Functional markers (FMs) Derived from polymorphic sequences or sites within genes and, thus, more likely to be causally involved in phenotypic trait variation (e.g. candidate gene-based molecular markers). Indirect functional markers (IFMs): For which the role for phenotypic trait variation is indirectly known, and Direct functional markers (DFMs): for which the role for the phenotypic trait variation is well proven.
  • 35.
    Genic Molecular Marker(GMM) Expressed Sequence Tag Unigene Sequence Data In silico mining Software tools are used to identify SSR, SNP etc. Direct mapping Can be used as RFLP probe or for primer designing for STS, CAPS etc.
  • 36.
    DNA Fingerprinting • Geneticvariation • Cultivar and strain identification • Eco-geographical variation • Mutation detection • Selection of diverse parents • Germplasm conservation
  • 37.
    Genetic Variation Similarity 0.56 0.660.76 0.85 0.95 K. Swarna K. Giriraj K. Chipsona2 K. Jeevan K. Alankar K. Khasigaro K. Kumar K. Megha K. Jyoti K. Muthu K. Badshah K. Sutlej K. Chandramukhi K. Dewa K. Lauvkar K. Ashoka K. Red K. Safed K. Chamatkar K. Jawahar K. Bahar K. Sheetman K. Lalima K. Kuber
  • 38.
    Cultivar and Strain Identification OPC05 OPC 06 OPC 09 OPD 05Descriptors • Morphological • Biochemical • DNA based
  • 39.
    Eco-Geographical Variation Similarity Coefficient 0.500.61 0.72 0.84 0.95 Bokuta 7 Bokuta 9 Spilow 1 Dubling 5 Dubling 7 Spilow 8 Rispa 10 Kalpa 9 Kalpa 10 Kanan 10 Rispa 2 Moorang 1 Skiba 9 Shongthong 9 Kalpa 3 Kanan 2 Skiba 1 Shongthong 10 Dubling 10 Akpa 2 Akpa 10 Moorang 6 Skiba 3 Shongthong 1 Eco-geographical variability in Pinus gerardiana
  • 40.
    Genome Mapping Assigning/locating genes/markersto particular region of a chromosome and determining the location of and relative distances between genes/markers on the chromosome • There are two types of maps: genetic linkage map and physical map • The genetic linkage map shows the arrangement of genes and genetic markers along the chromosomes as calculated by the frequency with which they are inherited together. The physical map is representation of the chromosomes, providing the physical distance between landmarks on the chromosome, ideally measured in nucleotide bases. The ultimate physical map is the complete
  • 41.
    Genetic Linkage Map Thethree main steps of linkage map construction are: (1)Production of a mapping population (2)Identification of polymorphism (3)Linkage analysis of markers
  • 42.
  • 43.
    Marker A Marker C MarkerD A B B C C D D 14 6 4 …. 10 12 …. …. 2 …. …. …. A D C 4/20 2/2 0 6/20 Recurrentparent Donorparent F1hybridMarker B Linkage Analysis
  • 44.
  • 45.
    Comparative Mapping or Synteny•The grass model • Tomato- potato co-linearity • Map based prediction of location of orthologous genes Cross mapping of DNA probes in a range of cereal crops has led to the widespread identification of chromosomal regions in which marker orders are highly conserved. It is now possible to describe all the genomes of grass crop species by their relationship to a single reference genome, rice. Potato genomes were mapped into 12 linkage groups corresponding to 12 potato chromosomes using tomato cDNA clones. Three paracentric inversions in chromosomes 5, 9, 10 were detected in relation to the tomato chromosomes. The other nine
  • 46.
    Species kilobases/centimorgan Arabidopsis 139 Tomato510 Corn 2140 Physical and genetic distances are resolved by hybridizing clones, which define closely linked genetic markers, to DNA that has been cut with rare cutting enzymes. If two clones hybridize to the same fragment, then the maximum distance between those two clones is the size of the restriction fragment. As the genetic distance between the loci is known, genetic and physical distances in this region can be correlated. Physical Mapping The correspondence between genetic and physical distance varies widely at different locations within a genome due to recombination suppressed or hotspot regions
  • 47.
    Fluorescence in situHybridization (FISH) Metaphase cell Array on glass slide Hybridize with labelled probe Fluorescent counterstaining of chromosome Visualization on fluorescent microscope
  • 48.
    Marker-assisted Selection MAS refers tothe use of DNA markers that are tightly-linked to target loci as a substitute for or to assist phenotypic screening Assumption: DNA markers can reliably predict phenotype
  • 49.
  • 50.
    • Markers mustbe tightly-linked to target loci. • Ideally markers should be <5 cM from a gene or QTL Marker A QTL 5 cM RELIABILITY FOR SELECTION Using marker A only: 1 – rA = ~95% Marker A QTL Marker B 5 cM 5 cM Using markers A and B: 1 - 2 rArB = ~99.5% • Using a pair of flanking markers can greatly improve reliability but increases time and cost Marker-assisted Selection
  • 51.
    Markers should bevalidated by testing their effectiveness in determining the target phenotype in independent populations and different genetic backgrounds, which is referred to as ‘marker validation’. In other words, marker validation involves testing the reliability of markers to predict phenotype. This indicates whether or not a marker could be used in routine screening for MAS. Validation of Markers
  • 52.
    Marker Conversion There are twoinstances where markers may need to be converted into other types of markers: when there are problems of reproducibility (e.g. RAPDs) and when the marker technique is complicated, time- consuming or expensive (e.g. RFLPs or AFLPs). The problem of reproducibility may be overcome by the development. of sequence characterised amplified regions (SCARs) or sequence-tagged sites (STSs) derived by cloning and sequencing specific RAPD markers.
  • 53.
    F2 P2 F1 P1 x large populationsconsisting of thousands of plants ResistantSusceptible MARKER-ASSISTED SELECTION (MAS) Method whereby phenotypic selection is based on DNA markers Marker-assisted Selection
  • 54.
    • Simpler methodcompared to phenotypic screening – Especially for traits with laborious screening – May save time and resources • Selection at seedling stage – Important for traits such as grain quality – Can select before transplanting in rice • Increased reliability – No environmental effects – Can discriminate between homozygotes and heterozygotes and select single plants Marker-assisted Selection
  • 55.
    • more accurateand efficient selection of specific genotypes – May lead to accelerated variety development • more efficient use of resources – Especially field trials Marker-assisted Selection
  • 56.
    Map Based Cloning •Marker targeting • Chromosome walking Chromosome
  • 57.
  • 58.
  • 59.
    Chromosome Landing A BCGen e 0.78 cM 0.16 cM 11.3 cM B D E F Gene
  • 60.
    Target Gene Identification RFLPB RFLP G RFLP D RFLP H RFLP E Gene
  • 61.
    • High-resolution mappingto demonstrate cosegregation of the candidate clone with the phenotype • Demonstration that the expression pattern of the gene is consistent with the phenotype, for example, that it is transcribed in the appropriate tissue(s) and/or induced by the appropriate stimulus • Determination of the DNA sequence of the gene and its comparison with those in sequence databases to identify any homology with genes of known function • Probing mutant lines with the cDNAs to identify alterations of the DNA or mRNA from the wild type • Complementation of the mutant phenotype by transformation with the gene Target Gene Validation