SlideShare a Scribd company logo
1 of 13
Download to read offline
Kashif Murtaza
AI Sciences Instructor
A Practical Approach to Timeseries
Forecasting using Python
• Basic Data Manipulation in Time Series
Shahzaib Hamid
• How to Install Packages?
• Basic Plotting and Data Visualization in Python
• Dataset Manipulation and Slicing
• Overview of Time Series Parameters
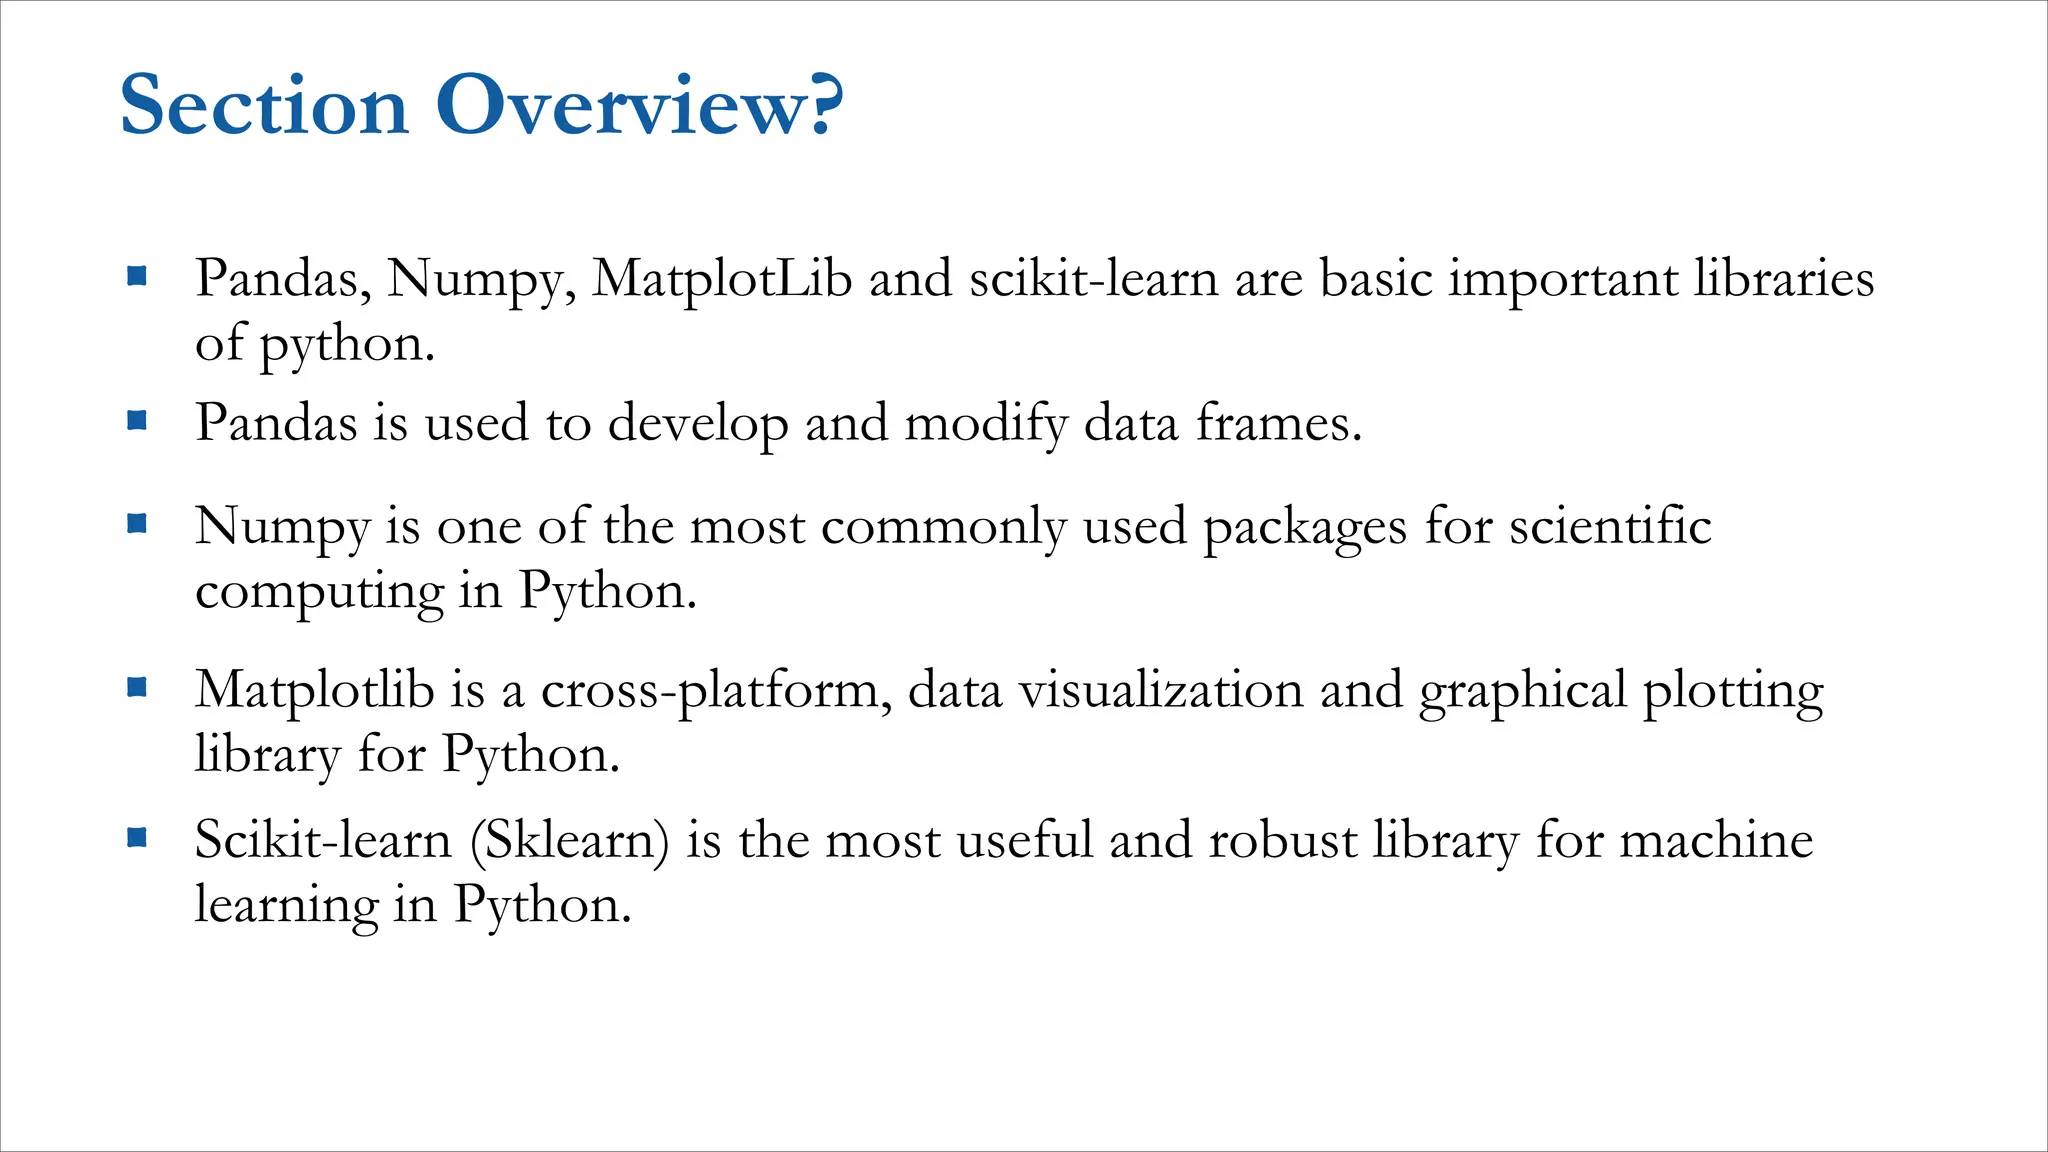
Section Overview?
▪ Pandas, Numpy, MatplotLib and scikit-learn are basic important libraries
of python.
▪ Pandas is used to develop and modify data frames.
▪ Numpy is one of the most commonly used packages for scientific
computing in Python.
▪ Matplotlib is a cross-platform, data visualization and graphical plotting
library for Python.
▪ Scikit-learn (Sklearn) is the most useful and robust library for machine
learning in Python.
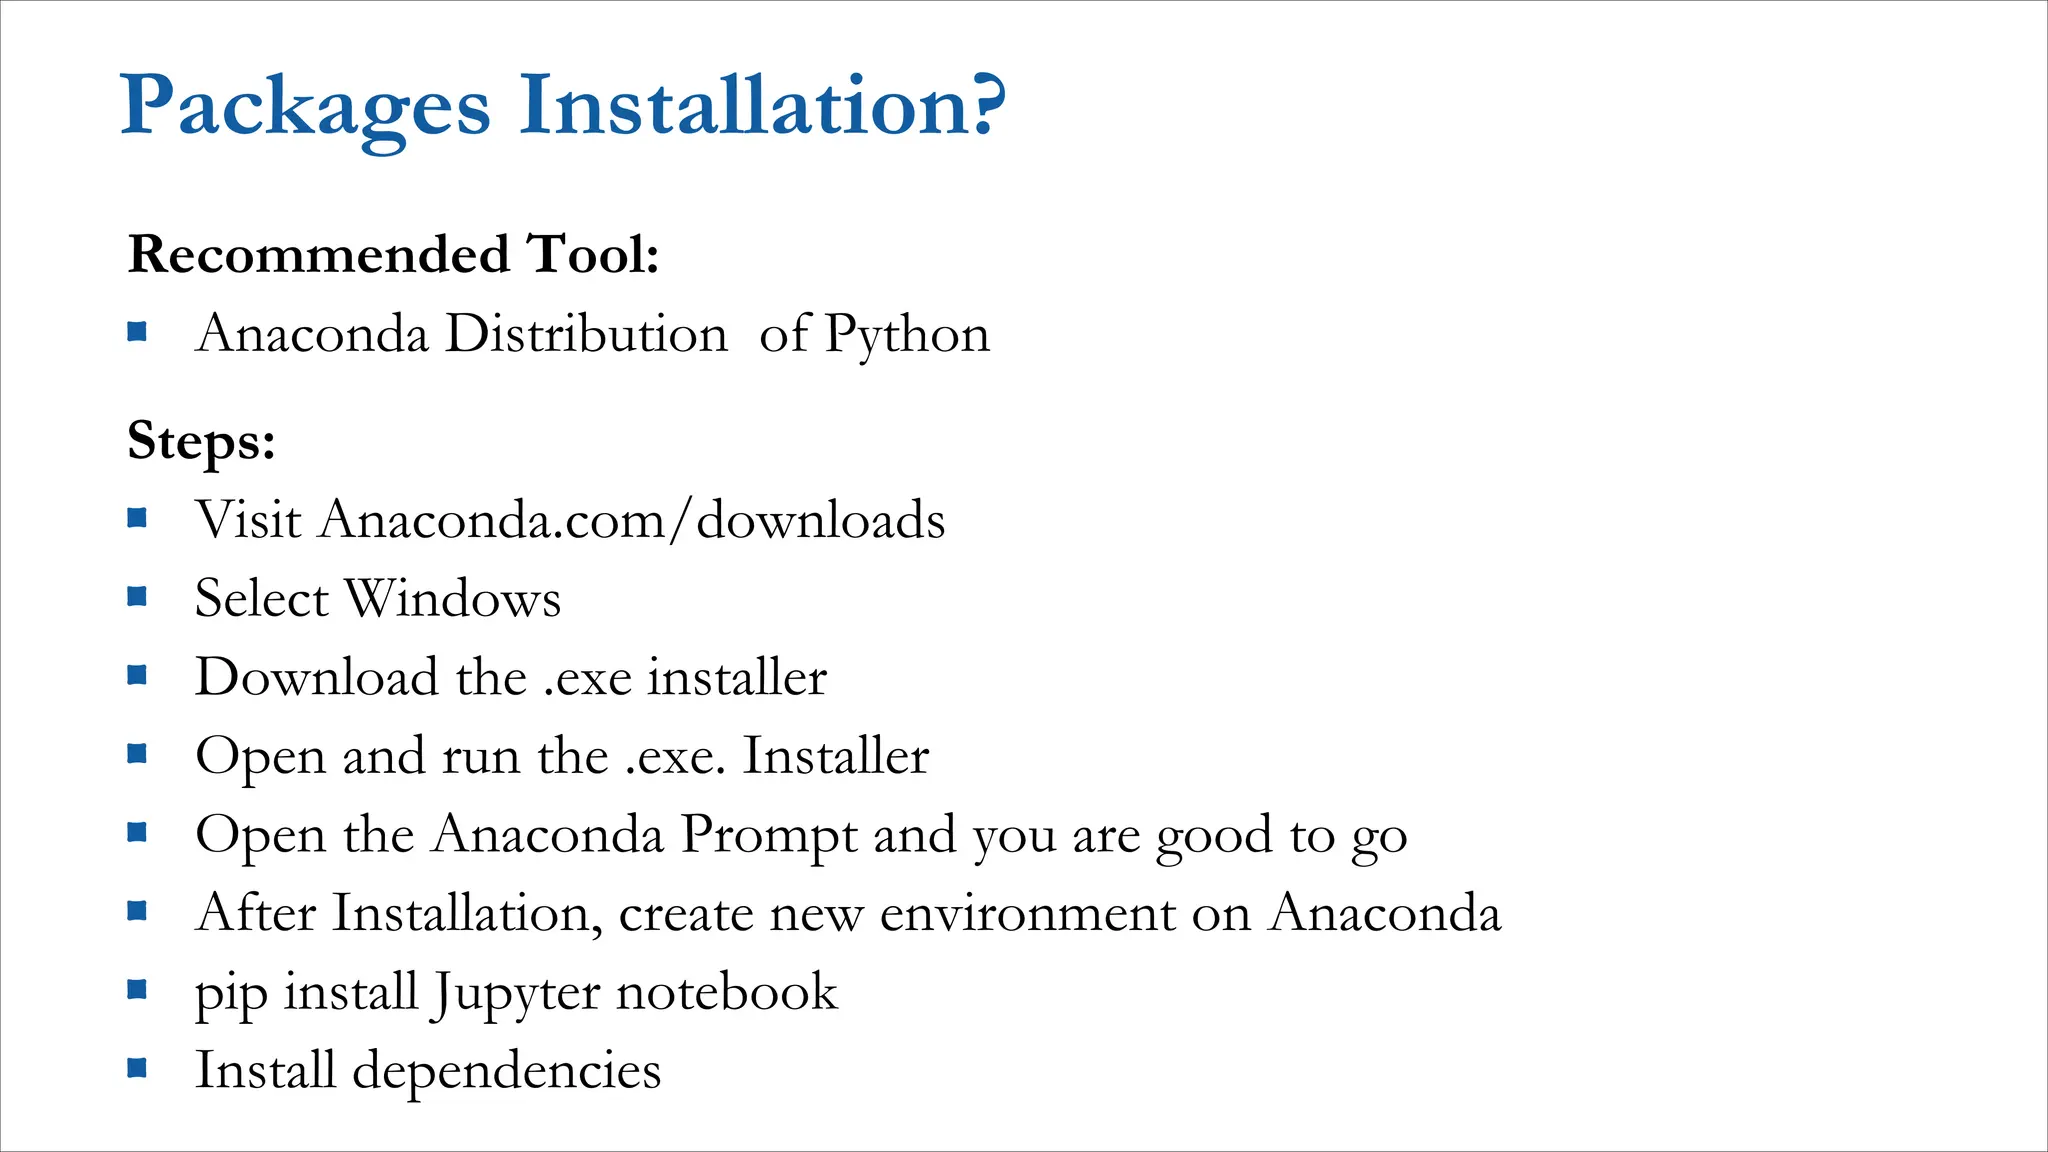
Packages Installation?
Recommended Tool:
▪ Anaconda Distribution of Python
Steps:
▪ Visit Anaconda.com/downloads
▪ Select Windows
▪ Download the .exe installer
▪ Open and run the .exe. Installer
▪ Open the Anaconda Prompt and you are good to go
▪ After Installation, create new environment on Anaconda
▪ pip install Jupyter notebook
▪ Install dependencies
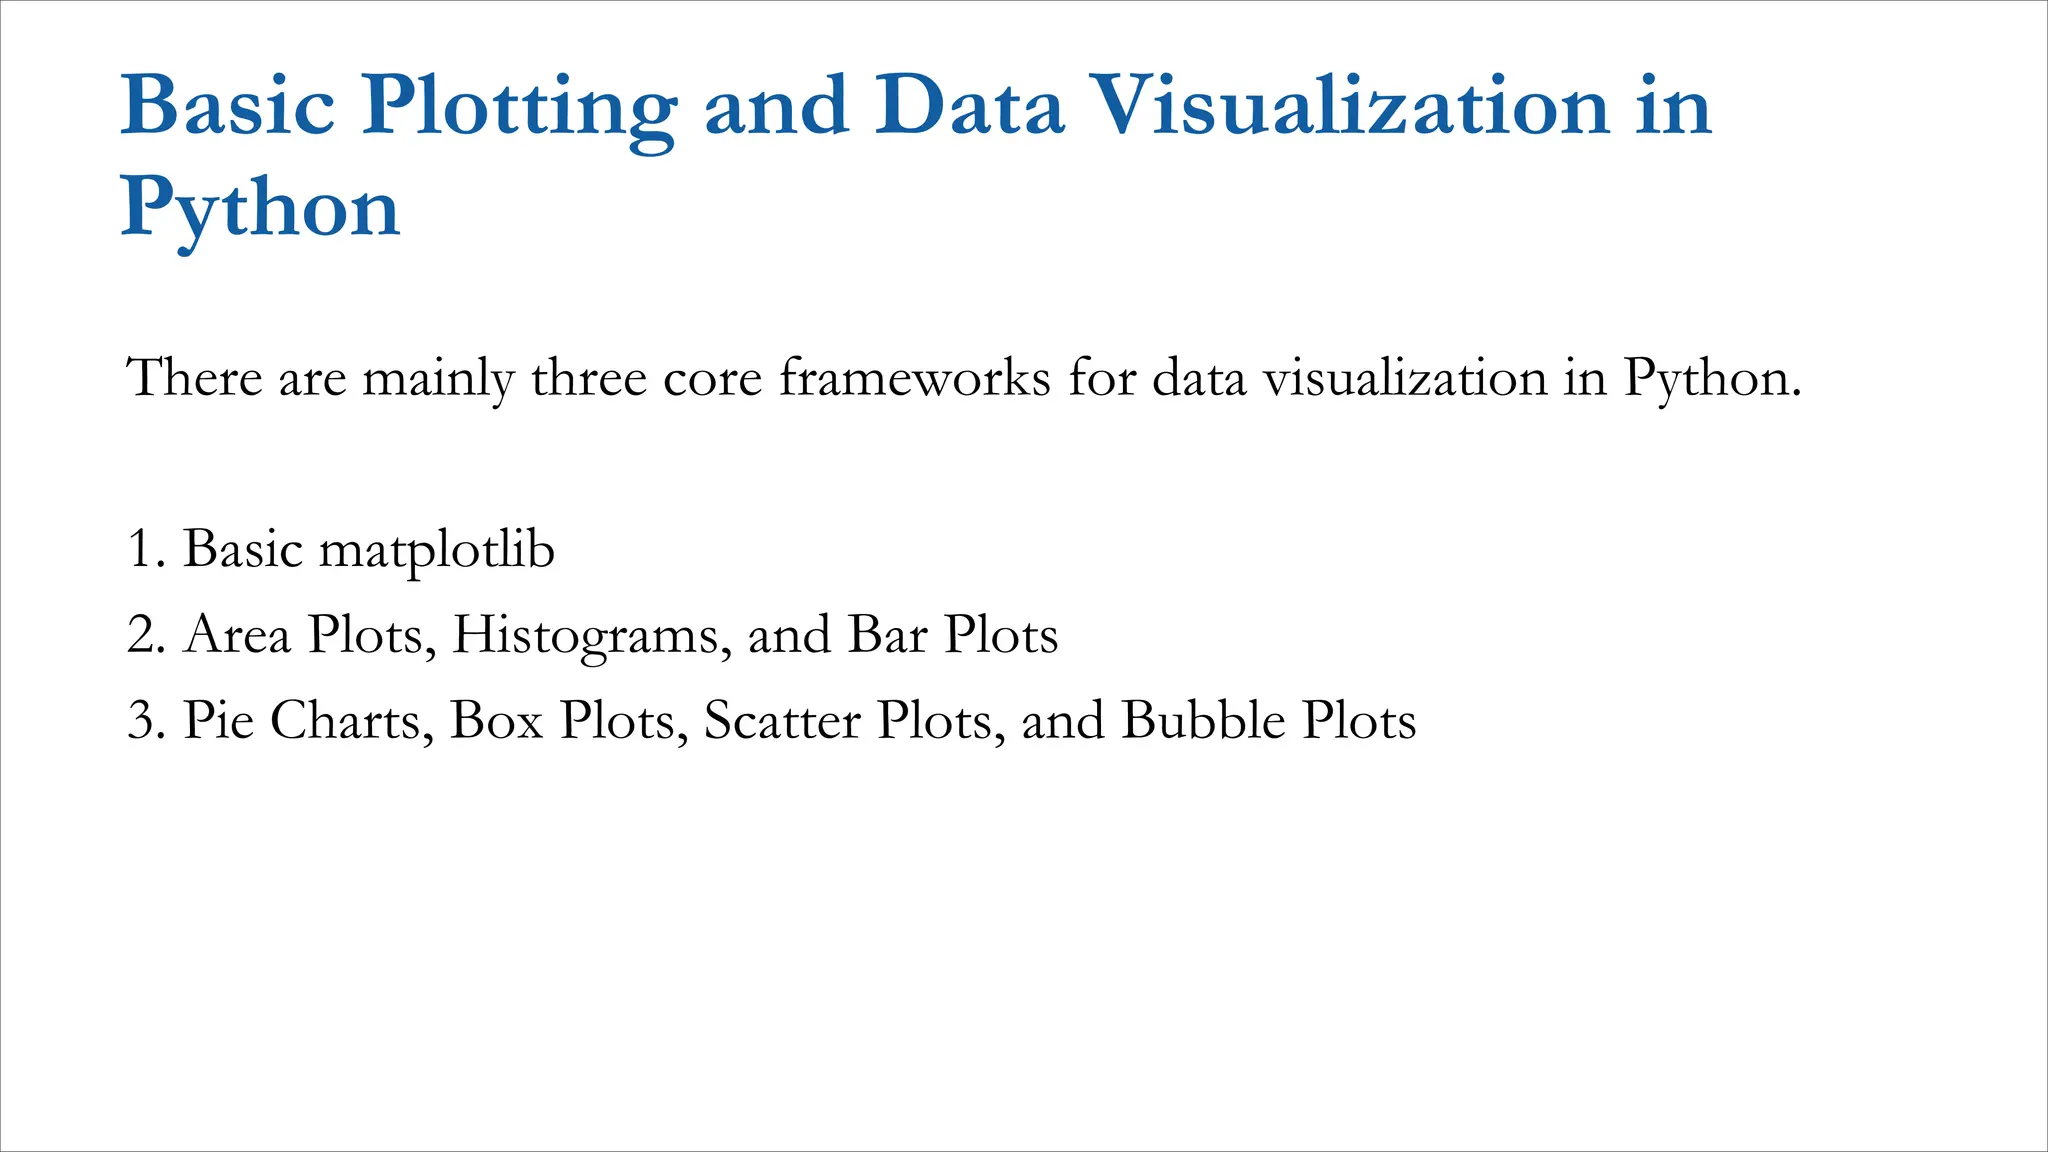
Basic Plotting and Data Visualization in
Python
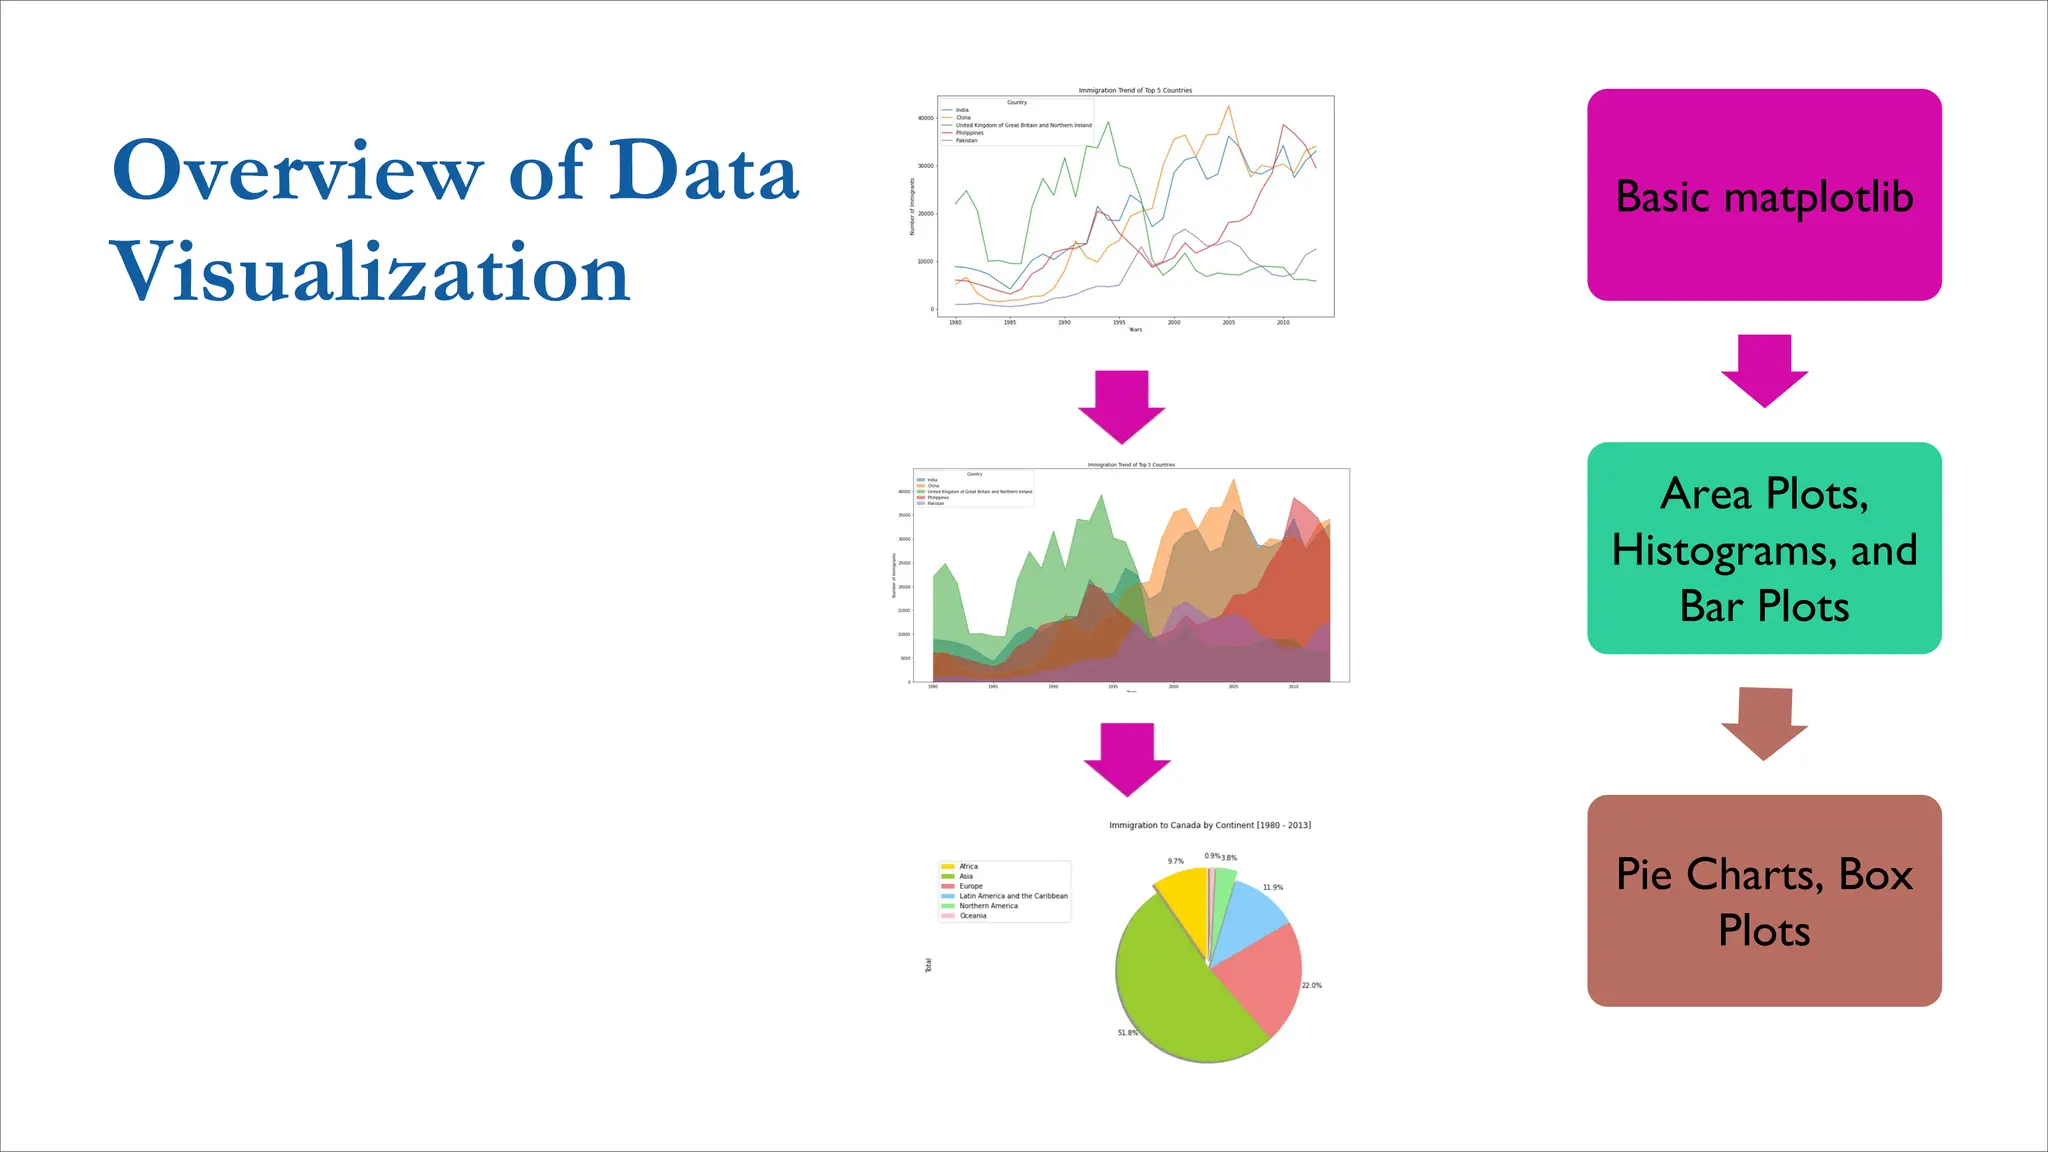
There are mainly three core frameworks for data visualization in Python.
1. Basic matplotlib
2. Area Plots, Histograms, and Bar Plots
3. Pie Charts, Box Plots, Scatter Plots, and Bubble Plots
Overview of Data
Visualization
Basic matplotlib
Area Plots,
Histograms, and
Bar Plots
Pie Charts, Box
Plots
Matplotlib
Install
Dependencies
Load Dataset
Data slicing
Data
visualization
using
matplotlib
Area Plots,
Histograms, and
Bar Plots
Load Dataset
Data Sorting
Data
visualization of
Area Plot
Histogram and
Pie Charts
Histogram
Pie Charts
Overview of Time Series Parameters
Correlation MAE
RMSE MAPE
Correlation
• It can be useful in data analysis and modeling to better
understand the relationships between variables.
• The statistical relationship between two variables is referred
to as their correlation.
• numpy, matplotlib
Mean Absolute Error
• Mean Absolute Error calculates the average difference
between the calculated values and actual values.
• It is also known as scale-dependent accuracy as it calculates
error in observations taken on the same scale.
• It is used as evaluation metrics for regression models in
machine learning.
• scikit-learn
Root Mean Square Error
• Root Mean Square Error, which is the square root of value
obtained from Mean Square Error function.
• Using RMSE, we can easily plot a difference between the
estimated and actual values of a parameter of the model.
• scikit-learn
Mean Absolute Percentage Error
• It is a statistical measure to define the accuracy of a machine
learning algorithm on a particular dataset.
• Can be considered as a loss function to define the error
termed by the model evaluation.
• It helps estimate the accuracy in terms of the differences in
the actual v/s estimated values.
• scikit-learn

More Related Content

Similar to Module 3 - Basics of Data Manipulation in Time Series

Data Science Job ready #DataScienceInterview Question and Answers 2022 | #Dat...
Data Science Job ready #DataScienceInterview Question and Answers 2022 | #Dat...Data Science Job ready #DataScienceInterview Question and Answers 2022 | #Dat...
Data Science Job ready #DataScienceInterview Question and Answers 2022 | #Dat...
Rohit Dubey
 
Data Science.pptx NEW COURICUUMN IN DATA
Data Science.pptx NEW COURICUUMN IN DATAData Science.pptx NEW COURICUUMN IN DATA
Data Science.pptx NEW COURICUUMN IN DATA
javed75
 

Similar to Module 3 - Basics of Data Manipulation in Time Series (20)

UNIT_5_Data Wrangling.pptx
UNIT_5_Data Wrangling.pptxUNIT_5_Data Wrangling.pptx
UNIT_5_Data Wrangling.pptx
 
2. Data Preprocessing.pdf
2. Data Preprocessing.pdf2. Data Preprocessing.pdf
2. Data Preprocessing.pdf
 
Python and data analytics
Python and data analyticsPython and data analytics
Python and data analytics
 
Internship Presentation.pdf
Internship Presentation.pdfInternship Presentation.pdf
Internship Presentation.pdf
 
Data visualization
Data visualizationData visualization
Data visualization
 
Rapid Miner
Rapid MinerRapid Miner
Rapid Miner
 
Abhishek Training PPT.pptx
Abhishek Training PPT.pptxAbhishek Training PPT.pptx
Abhishek Training PPT.pptx
 
Machine Learning with ML.NET and Azure - Andy Cross
Machine Learning with ML.NET and Azure - Andy CrossMachine Learning with ML.NET and Azure - Andy Cross
Machine Learning with ML.NET and Azure - Andy Cross
 
Data Science Job ready #DataScienceInterview Question and Answers 2022 | #Dat...
Data Science Job ready #DataScienceInterview Question and Answers 2022 | #Dat...Data Science Job ready #DataScienceInterview Question and Answers 2022 | #Dat...
Data Science Job ready #DataScienceInterview Question and Answers 2022 | #Dat...
 
Session 2
Session 2Session 2
Session 2
 
Biomedical Signal and Image Analytics using MATLAB
Biomedical Signal and Image Analytics using MATLABBiomedical Signal and Image Analytics using MATLAB
Biomedical Signal and Image Analytics using MATLAB
 
Analytics demystified
Analytics demystifiedAnalytics demystified
Analytics demystified
 
The Power of Auto ML and How Does it Work
The Power of Auto ML and How Does it WorkThe Power of Auto ML and How Does it Work
The Power of Auto ML and How Does it Work
 
Scaling Analytics with Apache Spark
Scaling Analytics with Apache SparkScaling Analytics with Apache Spark
Scaling Analytics with Apache Spark
 
Data Science and Analysis.pptx
Data Science and Analysis.pptxData Science and Analysis.pptx
Data Science and Analysis.pptx
 
Choosing a Machine Learning technique to solve your need
Choosing a Machine Learning technique to solve your needChoosing a Machine Learning technique to solve your need
Choosing a Machine Learning technique to solve your need
 
Deep Dive Time Series Anomaly Detection in Azure with dotnet
Deep Dive Time Series Anomaly Detection in Azure with dotnetDeep Dive Time Series Anomaly Detection in Azure with dotnet
Deep Dive Time Series Anomaly Detection in Azure with dotnet
 
Machine Learning for Capacity Management
 Machine Learning for Capacity Management Machine Learning for Capacity Management
Machine Learning for Capacity Management
 
Data Science.pptx NEW COURICUUMN IN DATA
Data Science.pptx NEW COURICUUMN IN DATAData Science.pptx NEW COURICUUMN IN DATA
Data Science.pptx NEW COURICUUMN IN DATA
 
Data science
Data scienceData science
Data science
 

More from ssusere5ddd6 (6)

Pythonlearn-12-HTTP- Network Programming
Pythonlearn-12-HTTP-  Network ProgrammingPythonlearn-12-HTTP-  Network Programming
Pythonlearn-12-HTTP- Network Programming
 
A practical Approach to Timeseries Forecasting using Python
A practical Approach to Timeseries Forecasting using PythonA practical Approach to Timeseries Forecasting using Python
A practical Approach to Timeseries Forecasting using Python
 
Day 00 - Introduction to machine learning with big data
Day 00 - Introduction to machine learning with big dataDay 00 - Introduction to machine learning with big data
Day 00 - Introduction to machine learning with big data
 
Chapter 1 Introduction to Data Science.pptx
Chapter 1 Introduction to Data Science.pptxChapter 1 Introduction to Data Science.pptx
Chapter 1 Introduction to Data Science.pptx
 
convolutional_neural_networks in deep learning
convolutional_neural_networks in deep learningconvolutional_neural_networks in deep learning
convolutional_neural_networks in deep learning
 
Beginner Control Structures - For Loop.pdf
Beginner Control Structures - For Loop.pdfBeginner Control Structures - For Loop.pdf
Beginner Control Structures - For Loop.pdf
 

Recently uploaded

IATP How-to Foreign Travel May 2024.pdff
IATP How-to Foreign Travel May 2024.pdffIATP How-to Foreign Travel May 2024.pdff
IATP How-to Foreign Travel May 2024.pdff
17thcssbs2
 
會考英聽會考英聽會考英聽會考英聽會考英聽會考英聽會考英聽會考英聽會考英聽會考英聽
會考英聽會考英聽會考英聽會考英聽會考英聽會考英聽會考英聽會考英聽會考英聽會考英聽會考英聽會考英聽會考英聽會考英聽會考英聽會考英聽會考英聽會考英聽會考英聽會考英聽
會考英聽會考英聽會考英聽會考英聽會考英聽會考英聽會考英聽會考英聽會考英聽會考英聽
中 央社
 
Neurulation and the formation of the neural tube
Neurulation and the formation of the neural tubeNeurulation and the formation of the neural tube
Neurulation and the formation of the neural tube
SaadHumayun7
 
Liberal & Redical Feminism presentation.pptx
Liberal & Redical Feminism presentation.pptxLiberal & Redical Feminism presentation.pptx
Liberal & Redical Feminism presentation.pptx
Rizwan Abbas
 
ppt your views.ppt your views of your college in your eyes
ppt your views.ppt your views of your college in your eyesppt your views.ppt your views of your college in your eyes
ppt your views.ppt your views of your college in your eyes
ashishpaul799
 

Recently uploaded (20)

Matatag-Curriculum and the 21st Century Skills Presentation.pptx
Matatag-Curriculum and the 21st Century Skills Presentation.pptxMatatag-Curriculum and the 21st Century Skills Presentation.pptx
Matatag-Curriculum and the 21st Century Skills Presentation.pptx
 
IATP How-to Foreign Travel May 2024.pdff
IATP How-to Foreign Travel May 2024.pdffIATP How-to Foreign Travel May 2024.pdff
IATP How-to Foreign Travel May 2024.pdff
 
會考英聽會考英聽會考英聽會考英聽會考英聽會考英聽會考英聽會考英聽會考英聽會考英聽
會考英聽會考英聽會考英聽會考英聽會考英聽會考英聽會考英聽會考英聽會考英聽會考英聽會考英聽會考英聽會考英聽會考英聽會考英聽會考英聽會考英聽會考英聽會考英聽會考英聽
會考英聽會考英聽會考英聽會考英聽會考英聽會考英聽會考英聽會考英聽會考英聽會考英聽
 
Morse OER Some Benefits and Challenges.pptx
Morse OER Some Benefits and Challenges.pptxMorse OER Some Benefits and Challenges.pptx
Morse OER Some Benefits and Challenges.pptx
 
Keeping Your Information Safe with Centralized Security Services
Keeping Your Information Safe with Centralized Security ServicesKeeping Your Information Safe with Centralized Security Services
Keeping Your Information Safe with Centralized Security Services
 
size separation d pharm 1st year pharmaceutics
size separation d pharm 1st year pharmaceuticssize separation d pharm 1st year pharmaceutics
size separation d pharm 1st year pharmaceutics
 
INU_CAPSTONEDESIGN_비밀번호486_업로드용 발표자료.pdf
INU_CAPSTONEDESIGN_비밀번호486_업로드용 발표자료.pdfINU_CAPSTONEDESIGN_비밀번호486_업로드용 발표자료.pdf
INU_CAPSTONEDESIGN_비밀번호486_업로드용 발표자료.pdf
 
Incoming and Outgoing Shipments in 2 STEPS Using Odoo 17
Incoming and Outgoing Shipments in 2 STEPS Using Odoo 17Incoming and Outgoing Shipments in 2 STEPS Using Odoo 17
Incoming and Outgoing Shipments in 2 STEPS Using Odoo 17
 
MichaelStarkes_UncutGemsProjectSummary.pdf
MichaelStarkes_UncutGemsProjectSummary.pdfMichaelStarkes_UncutGemsProjectSummary.pdf
MichaelStarkes_UncutGemsProjectSummary.pdf
 
Neurulation and the formation of the neural tube
Neurulation and the formation of the neural tubeNeurulation and the formation of the neural tube
Neurulation and the formation of the neural tube
 
philosophy and it's principles based on the life
philosophy and it's principles based on the lifephilosophy and it's principles based on the life
philosophy and it's principles based on the life
 
UNIT – IV_PCI Complaints: Complaints and evaluation of complaints, Handling o...
UNIT – IV_PCI Complaints: Complaints and evaluation of complaints, Handling o...UNIT – IV_PCI Complaints: Complaints and evaluation of complaints, Handling o...
UNIT – IV_PCI Complaints: Complaints and evaluation of complaints, Handling o...
 
Liberal & Redical Feminism presentation.pptx
Liberal & Redical Feminism presentation.pptxLiberal & Redical Feminism presentation.pptx
Liberal & Redical Feminism presentation.pptx
 
2024_Student Session 2_ Set Plan Preparation.pptx
2024_Student Session 2_ Set Plan Preparation.pptx2024_Student Session 2_ Set Plan Preparation.pptx
2024_Student Session 2_ Set Plan Preparation.pptx
 
50 ĐỀ LUYỆN THI IOE LỚP 9 - NĂM HỌC 2022-2023 (CÓ LINK HÌNH, FILE AUDIO VÀ ĐÁ...
50 ĐỀ LUYỆN THI IOE LỚP 9 - NĂM HỌC 2022-2023 (CÓ LINK HÌNH, FILE AUDIO VÀ ĐÁ...50 ĐỀ LUYỆN THI IOE LỚP 9 - NĂM HỌC 2022-2023 (CÓ LINK HÌNH, FILE AUDIO VÀ ĐÁ...
50 ĐỀ LUYỆN THI IOE LỚP 9 - NĂM HỌC 2022-2023 (CÓ LINK HÌNH, FILE AUDIO VÀ ĐÁ...
 
....................Muslim-Law notes.pdf
....................Muslim-Law notes.pdf....................Muslim-Law notes.pdf
....................Muslim-Law notes.pdf
 
[GDSC YCCE] Build with AI Online Presentation
[GDSC YCCE] Build with AI Online Presentation[GDSC YCCE] Build with AI Online Presentation
[GDSC YCCE] Build with AI Online Presentation
 
Mbaye_Astou.Education Civica_Human Rights.pptx
Mbaye_Astou.Education Civica_Human Rights.pptxMbaye_Astou.Education Civica_Human Rights.pptx
Mbaye_Astou.Education Civica_Human Rights.pptx
 
ppt your views.ppt your views of your college in your eyes
ppt your views.ppt your views of your college in your eyesppt your views.ppt your views of your college in your eyes
ppt your views.ppt your views of your college in your eyes
 
factors influencing drug absorption-final-2.pptx
factors influencing drug absorption-final-2.pptxfactors influencing drug absorption-final-2.pptx
factors influencing drug absorption-final-2.pptx
 

Module 3 - Basics of Data Manipulation in Time Series

  • 1. Kashif Murtaza AI Sciences Instructor A Practical Approach to Timeseries Forecasting using Python • Basic Data Manipulation in Time Series Shahzaib Hamid • How to Install Packages? • Basic Plotting and Data Visualization in Python • Dataset Manipulation and Slicing • Overview of Time Series Parameters
  • 2. Section Overview? ▪ Pandas, Numpy, MatplotLib and scikit-learn are basic important libraries of python. ▪ Pandas is used to develop and modify data frames. ▪ Numpy is one of the most commonly used packages for scientific computing in Python. ▪ Matplotlib is a cross-platform, data visualization and graphical plotting library for Python. ▪ Scikit-learn (Sklearn) is the most useful and robust library for machine learning in Python.
  • 3. Packages Installation? Recommended Tool: ▪ Anaconda Distribution of Python Steps: ▪ Visit Anaconda.com/downloads ▪ Select Windows ▪ Download the .exe installer ▪ Open and run the .exe. Installer ▪ Open the Anaconda Prompt and you are good to go ▪ After Installation, create new environment on Anaconda ▪ pip install Jupyter notebook ▪ Install dependencies
  • 4. Basic Plotting and Data Visualization in Python There are mainly three core frameworks for data visualization in Python. 1. Basic matplotlib 2. Area Plots, Histograms, and Bar Plots 3. Pie Charts, Box Plots, Scatter Plots, and Bubble Plots
  • 5. Overview of Data Visualization Basic matplotlib Area Plots, Histograms, and Bar Plots Pie Charts, Box Plots
  • 7. Area Plots, Histograms, and Bar Plots Load Dataset Data Sorting Data visualization of Area Plot
  • 9. Overview of Time Series Parameters Correlation MAE RMSE MAPE
  • 10. Correlation • It can be useful in data analysis and modeling to better understand the relationships between variables. • The statistical relationship between two variables is referred to as their correlation. • numpy, matplotlib
  • 11. Mean Absolute Error • Mean Absolute Error calculates the average difference between the calculated values and actual values. • It is also known as scale-dependent accuracy as it calculates error in observations taken on the same scale. • It is used as evaluation metrics for regression models in machine learning. • scikit-learn
  • 12. Root Mean Square Error • Root Mean Square Error, which is the square root of value obtained from Mean Square Error function. • Using RMSE, we can easily plot a difference between the estimated and actual values of a parameter of the model. • scikit-learn
  • 13. Mean Absolute Percentage Error • It is a statistical measure to define the accuracy of a machine learning algorithm on a particular dataset. • Can be considered as a loss function to define the error termed by the model evaluation. • It helps estimate the accuracy in terms of the differences in the actual v/s estimated values. • scikit-learn