Large volcanic eruptions can cool the global climate by ejecting ash and sulfur dioxide into the stratosphere, where they reflect sunlight back into space. The 1991 eruption of Mount Pinatubo cooled the planet by 0.5°C for about a year by reducing sunlight by 10%. Even larger eruptions like Tambora in 1815 and Krakatoa in 1883 lowered global temperatures more significantly for multiple years.
This is a presentation that I completed for EDU 290 in the Fall 2009. The intent of the assignment was to create a lesson that could be used by a student that missed the classroom instruction due to illness.
The Earth’s climate is changing. Temperatures are rising, snow and rainfall patterns are shifting, and more extreme climate events—like heavy rainstorms and record-high temperatures, are already taking place. One important way to track and communicate the causes and effects of climate change is
through the use of indicators. An indicator represents the state or trend of certain environmental or societal conditions over a given area and a specified period of time. This lesson highlights all those indicators for a better understanding of climate change.
Effect of climatic variabulity on Indian summer monsoon rainfallSunil Kumar
Monsoon origin theories, Earths atmosphere evolution, climate change, factors of climatic change, climatic variability, how these influencing Indian monsoon rainfall, EL Nino, La Nino, ENSO, Indian ocean dipole, MJO etc
"Climate Change 2007: The Physical Science Basis", assesses the current
scientific knowledge of the natural and human drivers of climate change,
observed changes in climate, the ability of science to attribute changes
to different causes, and projections for future climate change.
The report was produced by some 600 authors from 40 countries. Over 620
expert reviewers and a large number of government reviewers also
participated. Representatives from 113 governments reviewed and revised
the Summary line-by-line during the course of this week before adopting
it and accepting the underlying report.
“Climate Change
2007: The Physical Science Basis”, assesses the current scientific knowledge of
the natural and human drivers of climate change, observed changes in climate,
the ability of science to attribute changes to different causes, and projections
for future climate change.
The report was
produced by some 600 authors from 40 countries. Over 620 expert reviewers and a
large number of government reviewers also participated. Representatives from 113
governments reviewed and revised the Summary line-by-line during the course of
this week before adopting it and accepting the underlying
report.
Climate: Climatic Change - Evidence, Cycles and The Futuregeomillie
A PowerPoint used in class to cover the key forms of evidence you need to know for the Exam. Key Questions are likely to be focused on how we can gain information of past climatic change, and how it can be used to predict future, and I would expect you to be able to comment on the usefulness of the different types. For instance, Ice cores are highly accurate and quantifiable evidence, but gaining them is expensive, and only gives a climatic record for the site at which the snow formed. However, they do provide the longest record of change.
CAMBRIDGE GEOGRAPHY A2 - PRODUCTION, LOCATION AND CHANGE: THE GREEN REVOLUTIONGeorge Dumitrache
CAMBRIDGE GEOGRAPHY A2 - PRODUCTION, LOCATION AND CHANGE: THE GREEN REVOLUTION. It contains: green revolution, Norman Bourlag, green revolution in Mexico, India, Brazil, Philippines. Effects on food security, Malthusian criticism, the environmental impact.
The Earth’s climate is dynamic and characterised by trends, aberrations and quasi-periodic oscillations varying over a broad range of time-scales [1], which are governed by external (extraterrestrial systems) and/or internal(ocean, atmosphere and land system). Trends are largely controlled by plate tectonics, and thus to change gradually on million year time scale. Aberrations occur when the certain thresholds are passed and are manifested in the geological record as the unusual rapid (less than a few thousands of years) or extreme change in climate. The quasi-periodic oscillations are mostly astronomically paced; they are driven by astronomical perturbations that affect the earth’s orbit around the sun and the orientation of earth’s rotation axis with respect to its orbital plane. These perturbations are described by the three main astronomical cycles: eccentricity, precession and obliquity, which together determine the spatial and seasonal pattern of insolation received by the earth [2], eventually resulting in climatic oscillations of ten to hundreds of thousands of year [3].Sun being the main source of energy for the earth system controls the climate of it. Variation in solar activity and cosmic ray intensity has direct influence over climatic features such as cloudiness, temperature and rainfall [4]. Volcanic eruptions also force all elements of the climatic systems up to a varying degree but producing long term climatic signals in the ocean. The cumulative volcanic cooling effect at present offsets about one third of anthropogenic warming [5].Other than these causes paleoclimatologists also relates the past climate changes with movement of solar system[6], interplanetary dusts and influence of asteroids[7].However the recent variability in climate what earth is experiencing is unlikely due to any of the individual above factors rather it is due to the compound effect of complex interactions of all the natural as well as anthropogenic forcings.
References:
1. J. C. Zachos, M. Pagani, L. Sloan, E. Thomas, K. Billups, Science 292 (2001) 686-693.
2. G. Kukla, Nature (London) 253, 600 (1975).
3. J. D. Hays, J. Imbrie, N. J. Shackleton, Science 194 (1876) 1121-1132.
4. N. Marsh, H. Swensmark, Space Sci. Rev. 94 (2000) 215-230.
5. T. L. Delworth, V. Ramaswamy, G. L. Stenchikov, Geophys. Res. Lett. 32 (2005) L24709.
6. K. Fuhrer, E. W. Wolf, S. J. Johnsen, J. Geophys. Res. 104(D24) (1999) 31043-31052
7. P. Hut, W. Alvarez, W. P. Elder, T. Hansen, E. G. Kauffman, G. Keller, E. M. Shoemaker & P. R. Weissman, Nature Vol. 329, 10 September, 1987
Presentation on behalf of the SA Weather Service presented during SA National Science Week - The harsh realities of climate change, 29 July to 2 August 2019.
Climate change is a significant and lasting change in the statistical distribution of weather patterns over periods ranging from decades to millions of years. It may be a change in average weather conditions, or in the distribution of weather around the average conditions (i.e., more or fewer extreme weather events). Climate change is caused by factors such as biotic processes, variations in solar radiation received by Earth, plate tectonics, and volcanic eruptions. Certain human activities have also been identified as significant causes of recent climate change, often referred to as "global warming"
Scientists actively work to understand past and future climate by using observations and theoretical models. A climate record — extending deep into the Earth's past — has been assembled, and continues to be built up, based on geological evidence from borehole temperature profiles, cores removed from deep accumulations of ice, floral and faunal records, glacial and periglacial processes, stable-isotope and other analyses of sediment layers, and records of past sea levels. More recent data are provided by the instrumental record. General circulation models, based on the physical sciences, are often used in theoretical approaches to match past climate data, make future projections, and link causes and effects in climate change.
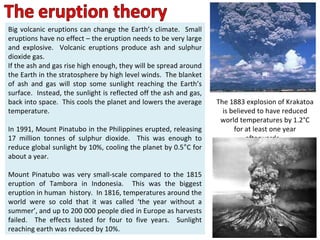
1. Big volcanic eruptions can change the Earth’s climate. Small eruptions have no effect – the eruption needs to be very large and explosive. Volcanic eruptions produce ash and sulphur dioxide gas. If the ash and gas rise high enough, they will be spread around the Earth in the stratosphere by high level winds. The blanket of ash and gas will stop some sunlight reaching the Earth’s surface. Instead, the sunlight is reflected off the ash and gas, back into space. This cools the planet and lowers the average temperature. In 1991, Mount Pinatubo in the Philippines erupted, releasing 17 million tonnes of sulphur dioxide. This was enough to reduce global sunlight by 10%, cooling the planet by 0.5 ° C for about a year. Mount Pinatubo was very small-scale compared to the 1815 eruption of Tambora in Indonesia. This was the biggest eruption in human history. In 1816, temperatures around the world were so cold that it was called ‘the year without a summer’, and up to 200 000 people died in Europe as harvests failed. The effects lasted for four to five years. Sunlight reaching earth was reduced by 10%. The 1883 explosion of Krakatoa is believed to have reduced world temperatures by 1.2°C for at least one year afterwards.
2. The Sun’s output is not constant. Cycles have been detected that reduce or increase the amount of solar energy. Over 2000 years ago Chinese astronomers started to record sunspots. These are black areas on the surface of the sun. Sometimes the sun has lots of these spots. At other times they disappear. Even though the spots are dark, they tell us that the sun is more active than usual. Lots of spots mean more solar energy being fired out from the sun towards Earth. Cooler periods, such as the Little Ice Age, and warmer periods, such as the Medieval Warm Period, may have been caused by changes in sunspot activity. Some people think that, on average, there were more volcanic eruptions during the Little Ice Age, and that this added to the cooling. However, climate change on timescales of a few hundred years, and 1-2°C, cannot be explained by volcanoes – but it might be explained by sunspot cycles. Temperatures are greatest when there are plenty of sunspots – because it means other areas of the Sun are working even harder!
3.
4. The natural causes of climate change Long term changes (may last for many centuries) Short term changes (lasting just a few years) The orbital theory The sunspot theory The eruption theory