Lesson Menu
Five-Minute Check(over Chapter 2)
Mathematical Practices
Then/Now
New Vocabulary
Example 1: Graph a Quadratic Function by Using a Table
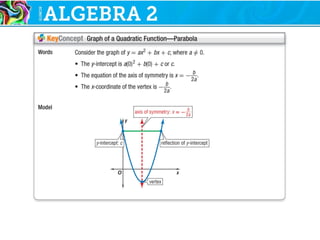
Key Concept: Graph of a Quadratic Function—Parabola
Example 2: Axis of Symmetry, y-intercept, and Vertex
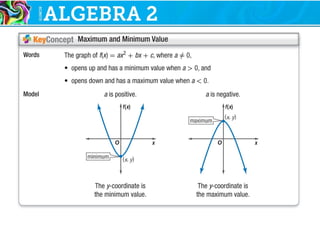
Key Concept: Maximum and Minimum Value
Example 3: Maximum or Minimum Values
Example 4: Real-World Example: Quadratic Equations in the
Real World
2.
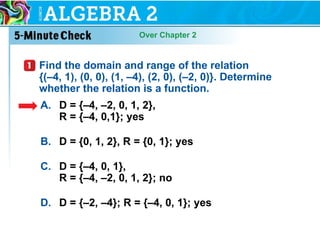
Over Chapter 2
A.D = {–4, –2, 0, 1, 2},
R = {–4, 0,1}; yes
B. D = {0, 1, 2}, R = {0, 1}; yes
C. D = {–4, 0, 1},
R = {–4, –2, 0, 1, 2}; no
D. D = {–2, –4}; R = {–4, 0, 1}; yes
Find the domain and range of the relation
{(–4, 1), (0, 0), (1, –4), (2, 0), (–2, 0)}. Determine
whether the relation is a function.
3.
Over Chapter 2
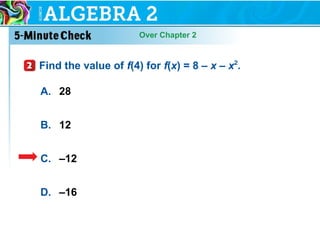
A.28
B. 12
C. –12
D. –16
Find the value of f(4) for f(x) = 8 – x – x2
.
Over Chapter 2
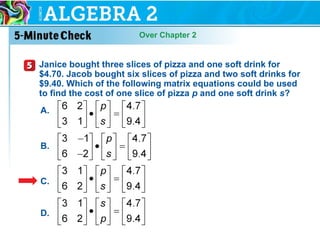
Janicebought three slices of pizza and one soft drink for
$4.70. Jacob bought six slices of pizza and two soft drinks for
$9.40. Which of the following matrix equations could be used
to find the cost of one slice of pizza p and one soft drink s?
A.
B.
C.
D.
7.
Mathematical Practices
3 Constructviable arguments and critique
the reasoning of others.
Content Standards
A.CED.3 Represent constraints by equations
or inequalities, and by systems of equations
and/or inequalities, and interpret solutions as
viable or nonviable options in a modeling
context.
8.
You identified andmanipulated graphs of
functions.
• Graph quadratic functions.
• Find and interpret the maximum and
minimum values of a quadratic function.
9.
• quadratic function
•quadratic term
• linear term
• constant term
• parabola
• axis of symmetry
• vertex
• maximum value
• minimum value
10.
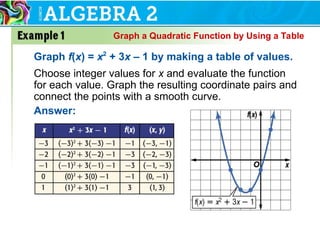
Graph a QuadraticFunction by Using a Table
Graph f(x) = x2
+ 3x – 1 by making a table of values.
Choose integer values for x and evaluate the function
for each value. Graph the resulting coordinate pairs and
connect the points with a smooth curve.
Answer:
11.
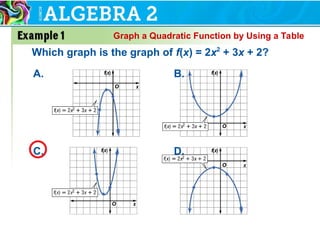
A. B.
C. D.
Whichgraph is the graph of f(x) = 2x2
+ 3x + 2?
Graph a Quadratic Function by Using a Table
13.
Axis of Symmetry,y-intercept, and Vertex
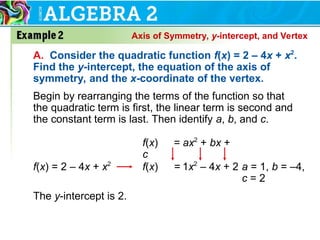
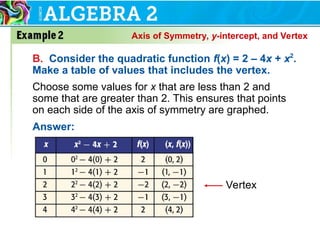
A. Consider the quadratic function f(x) = 2 – 4x + x2
.
Find the y-intercept, the equation of the axis of
symmetry, and the x-coordinate of the vertex.
Begin by rearranging the terms of the function so that
the quadratic term is first, the linear term is second and
the constant term is last. Then identify a, b, and c.
f(x) = ax2
+ bx +
c
f(x) = 1x2
– 4x + 2
f(x) = 2 – 4x + x2
a = 1, b = –4,
c = 2
The y-intercept is 2.
14.
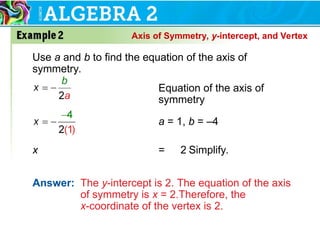
Use a andb to find the equation of the axis of
symmetry.
x = 2 Simplify.
Answer: The y-intercept is 2. The equation of the axis
of symmetry is x = 2.Therefore, the
x-coordinate of the vertex is 2.
Equation of the axis of
symmetry
a = 1, b = –4
Axis of Symmetry, y-intercept, and Vertex
15.
B. Consider thequadratic function f(x) = 2 – 4x + x2
.
Make a table of values that includes the vertex.
Choose some values for x that are less than 2 and
some that are greater than 2. This ensures that points
on each side of the axis of symmetry are graphed.
Answer:
Vertex
Axis of Symmetry, y-intercept, and Vertex
16.
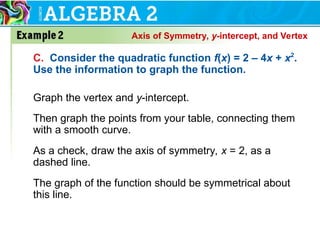
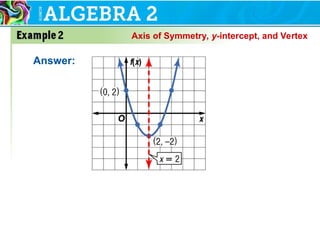
C. Consider thequadratic function f(x) = 2 – 4x + x2
.
Use the information to graph the function.
Graph the vertex and y-intercept.
Then graph the points from your table, connecting them
with a smooth curve.
As a check, draw the axis of symmetry, x = 2, as a
dashed line.
The graph of the function should be symmetrical about
this line.
Axis of Symmetry, y-intercept, and Vertex
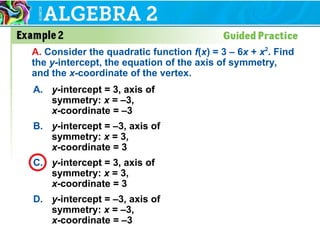
A. y-intercept =3, axis of
symmetry: x = –3,
x-coordinate = –3
B. y-intercept = –3, axis of
symmetry: x = 3,
x-coordinate = 3
C. y-intercept = 3, axis of
symmetry: x = 3,
x-coordinate = 3
D. y-intercept = –3, axis of
symmetry: x = –3,
x-coordinate = –3
A. Consider the quadratic function f(x) = 3 – 6x + x2
. Find
the y-intercept, the equation of the axis of symmetry,
and the x-coordinate of the vertex.
19.
B. Consider thequadratic function f(x) = 3 – 6x + x2
.
Make a table of values that includes the vertex.
A.
B.
C.
D.
20.
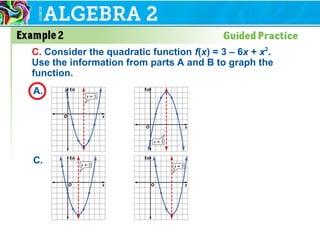
C. Consider thequadratic function f(x) = 3 – 6x + x2
.
Use the information from parts A and B to graph the
function.
A. B.
C. D.
22.
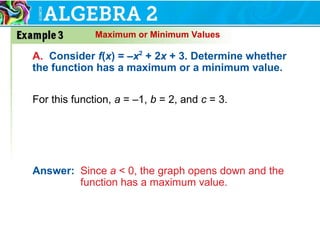
Maximum or MinimumValues
A. Consider f(x) = –x2
+ 2x + 3. Determine whether
the function has a maximum or a minimum value.
For this function, a = –1, b = 2, and c = 3.
Answer: Since a < 0, the graph opens down and the
function has a maximum value.
23.
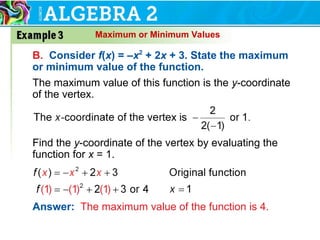
Maximum or MinimumValues
B. Consider f(x) = –x2
+ 2x + 3. State the maximum
or minimum value of the function.
The maximum value of this function is the y-coordinate
of the vertex.
Answer: The maximum value of the function is 4.
Find the y-coordinate of the vertex by evaluating the
function for x = 1.
24.
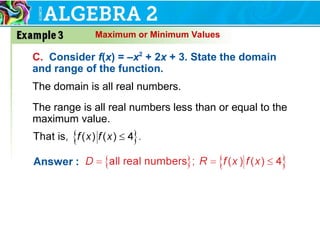
Maximum or MinimumValues
C. Consider f(x) = –x2
+ 2x + 3. State the domain
and range of the function.
The domain is all real numbers.
The range is all real numbers less than or equal to the
maximum value.
25.
A. maximum
B. minimum
C.both
D. none
A. Consider the function f(x) = x2
+ 4x – 1.
Determine whether the function has a maximum or
a minimum value.
26.
A. –5
B. –1
C.5
D. none
B. Consider the function f(x) = x2
+ 4x – 1. What is
the maximum or minimum value of the function?
27.
A. D ={all real numbers};
R = {f(x) | f(x) ≥ –5}
B. D = {all real numbers};
R = {f(x) | f(x) ≤ –5}
C. D = {x ≥ –5};
R = {all real numbers}
D. D = {x ≤ –5};
R = {all real numbers}
C. Consider the function f(x) = x2
+ 4x – 1. What are
the domain and range of the function?
28.
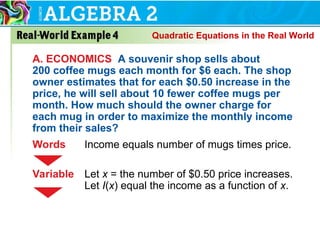
Quadratic Equations inthe Real World
A. ECONOMICS A souvenir shop sells about
200 coffee mugs each month for $6 each. The shop
owner estimates that for each $0.50 increase in the
price, he will sell about 10 fewer coffee mugs per
month. How much should the owner charge for
each mug in order to maximize the monthly income
from their sales?
Words Income equals number of mugs times price.
Variable Let x = the number of $0.50 price increases.
Let I(x) equal the income as a function of x.
29.
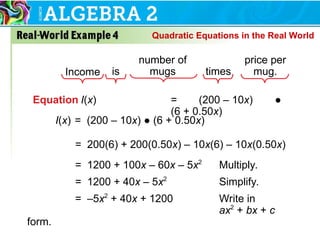
Equation I(x) =(200 – 10x) ●
(6 + 0.50x)
Income is
number of
mugs times
price per
mug.
= 200(6) + 200(0.50x) – 10x(6) – 10x(0.50x)
= 1200 + 100x – 60x – 5x2
Multiply.
= 1200 + 40x – 5x2
Simplify.
= –5x2
+ 40x + 1200 Write in
ax2
+ bx + c
form.
I(x) = (200 – 10x) ● (6 + 0.50x)
Quadratic Equations in the Real World
30.
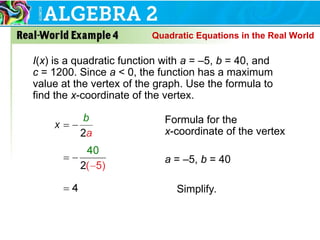
I(x) is aquadratic function with a = –5, b = 40, and
c = 1200. Since a < 0, the function has a maximum
value at the vertex of the graph. Use the formula to
find the x-coordinate of the vertex.
Formula for the
x-coordinate of the vertex
a = –5, b = 40
Simplify.
Quadratic Equations in the Real World
31.
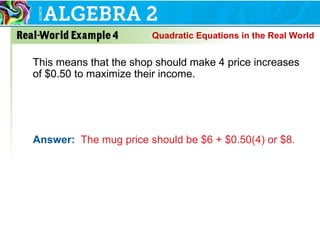
This means thatthe shop should make 4 price increases
of $0.50 to maximize their income.
Answer: The mug price should be $6 + $0.50(4) or $8.
Quadratic Equations in the Real World
32.
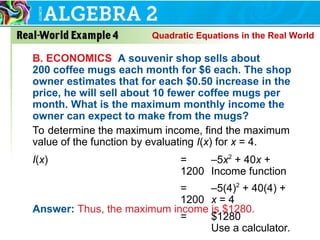
B. ECONOMICS Asouvenir shop sells about
200 coffee mugs each month for $6 each. The shop
owner estimates that for each $0.50 increase in the
price, he will sell about 10 fewer coffee mugs per
month. What is the maximum monthly income the
owner can expect to make from the mugs?
To determine the maximum income, find the maximum
value of the function by evaluating I(x) for x = 4.
I(x) = –5x2
+ 40x +
1200 Income function
= –5(4)2
+ 40(4) +
1200 x = 4
= $1280
Use a calculator.
Answer: Thus, the maximum income is $1280.
Quadratic Equations in the Real World
33.
Check Graph thisfunction on a graphing calculator,
and use the CALC menu to confirm this
solution.
Keystrokes:
At the bottom of the display are
the coordinates of the maximum
point on the graph of
y = –5x2
+ 40x + 1200. The
y-value of these coordinates is
the maximum value of the
function, or 1280.
ENTER
2nd [CALC] 4 0 10ENTER ENTER
Quadratic Equations in the Real World
34.
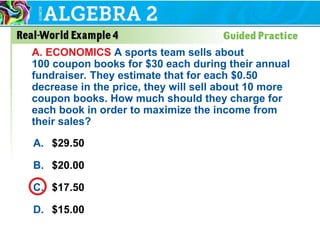
A. $29.50
B. $20.00
C.$17.50
D. $15.00
A. ECONOMICS A sports team sells about
100 coupon books for $30 each during their annual
fundraiser. They estimate that for each $0.50
decrease in the price, they will sell about 10 more
coupon books. How much should they charge for
each book in order to maximize the income from
their sales?
35.
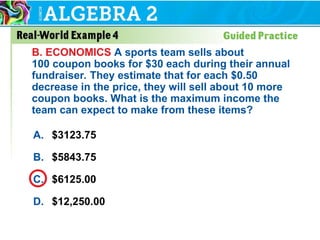
A. $3123.75
B. $5843.75
C.$6125.00
D. $12,250.00
B. ECONOMICS A sports team sells about
100 coupon books for $30 each during their annual
fundraiser. They estimate that for each $0.50
decrease in the price, they will sell about 10 more
coupon books. What is the maximum income the
team can expect to make from these items?

![Check Graph this function on a graphing calculator,
and use the CALC menu to confirm this
solution.
Keystrokes:
At the bottom of the display are
the coordinates of the maximum
point on the graph of
y = –5x2
+ 40x + 1200. The
y-value of these coordinates is
the maximum value of the
function, or 1280.
ENTER
2nd [CALC] 4 0 10ENTER ENTER
Quadratic Equations in the Real World](https://image.slidesharecdn.com/lessonpresentationgraphingquadraticfunctions-250406195836-12f0b658/85/Lesson_Presentation_Graphing_Quadratic_Functions-ppt-33-320.jpg)