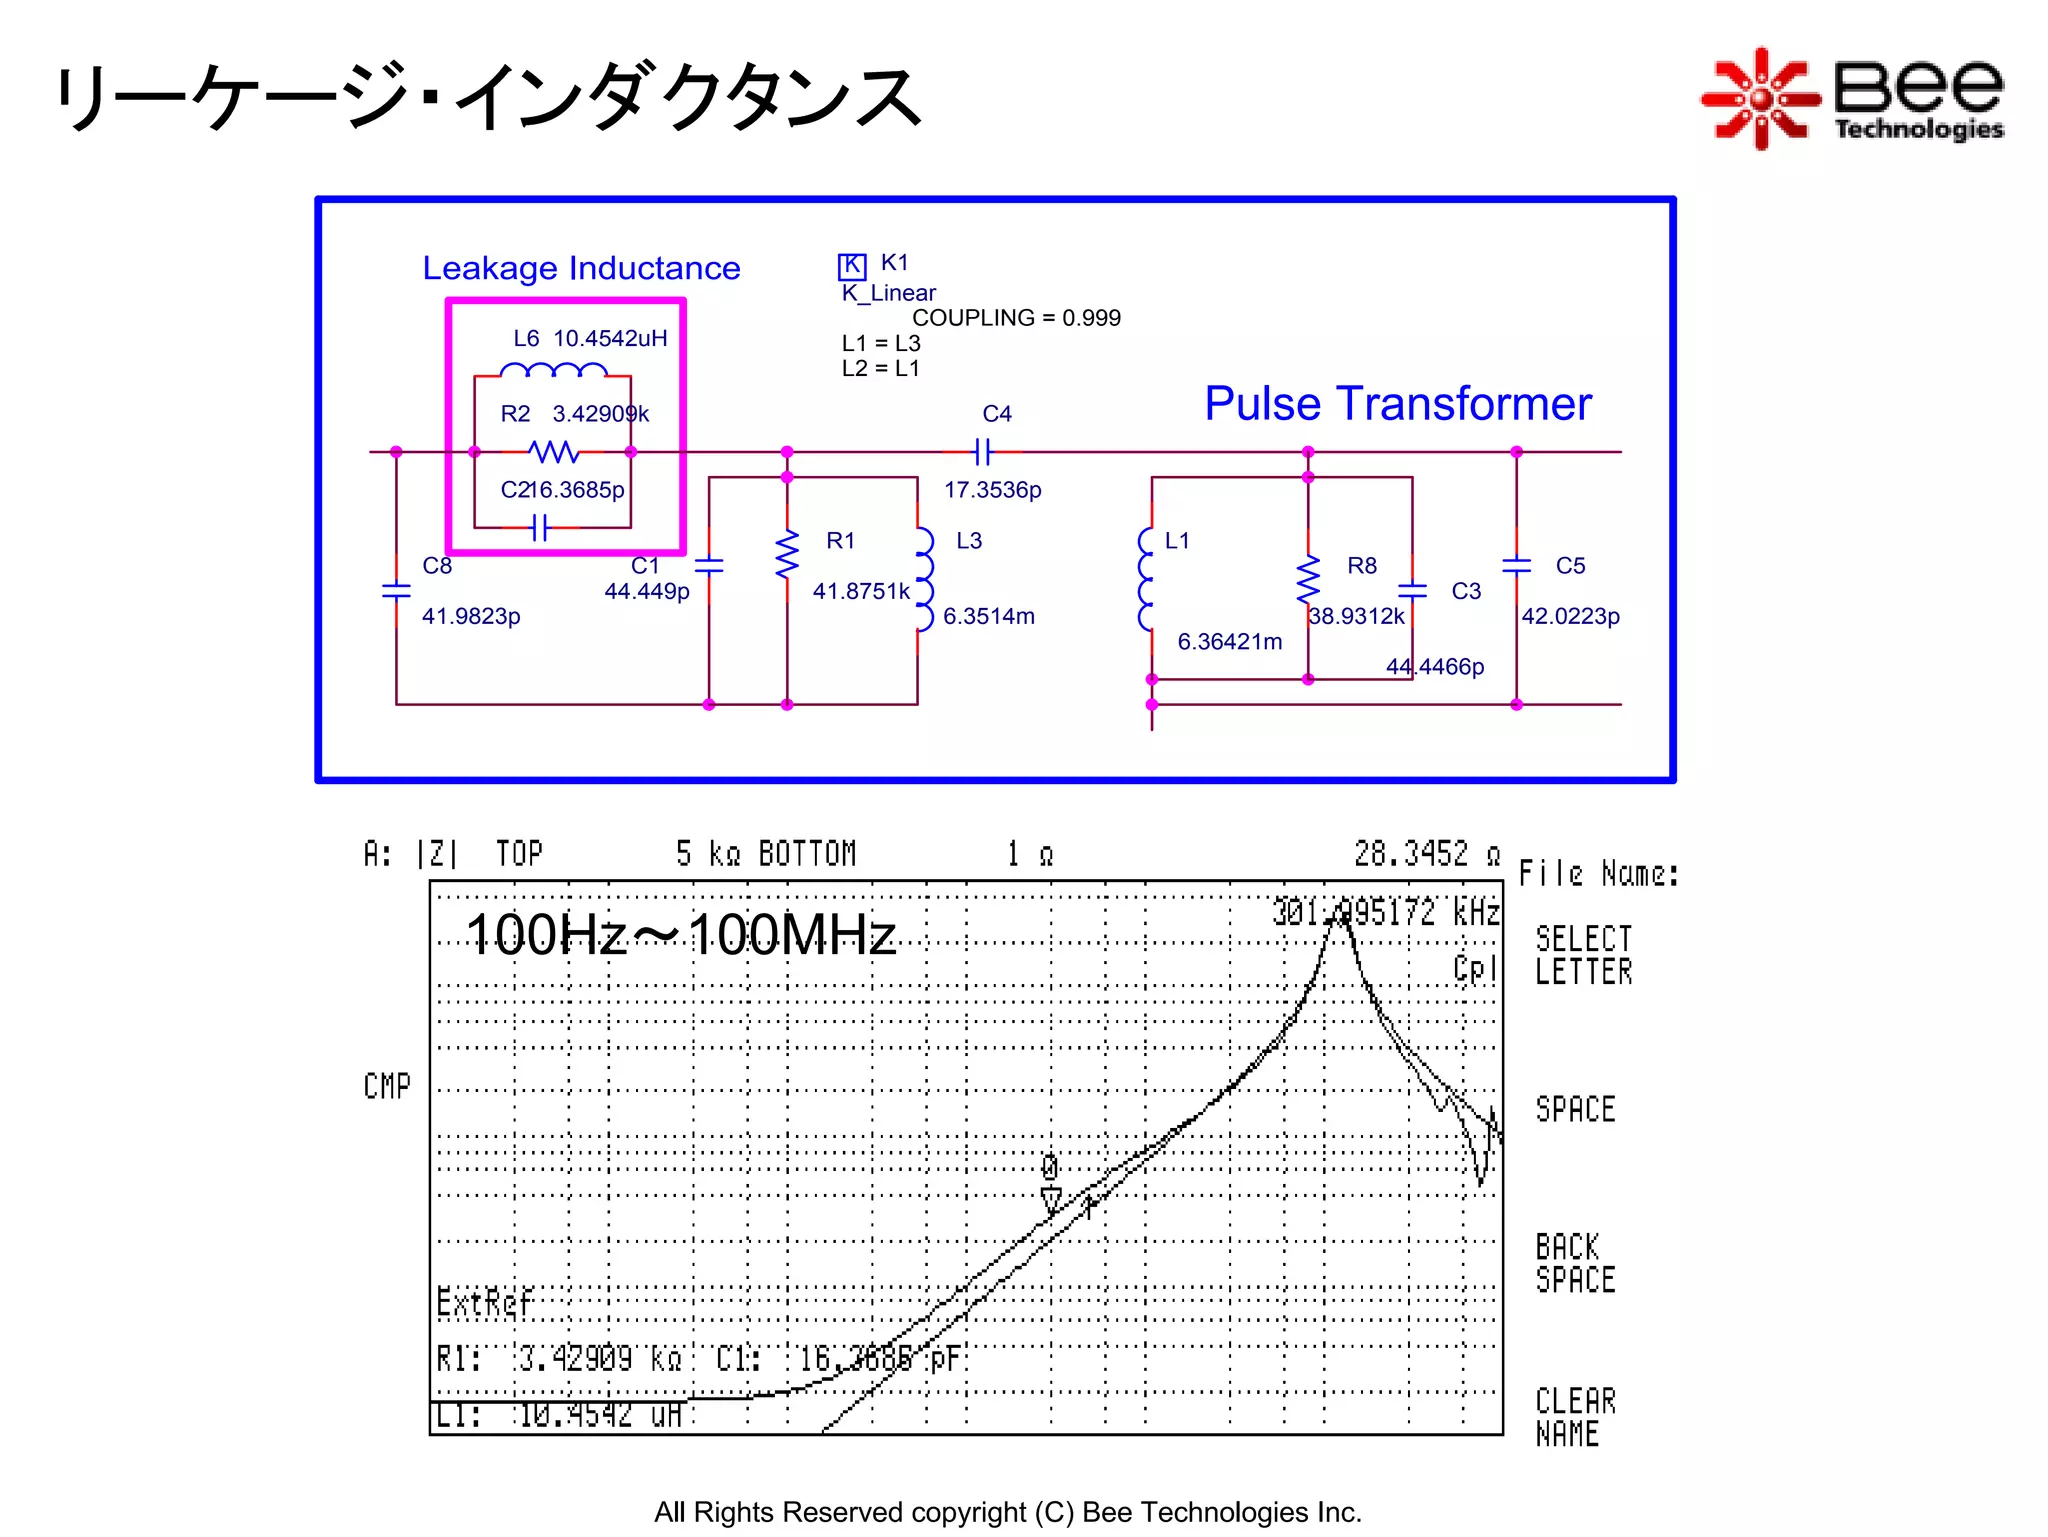
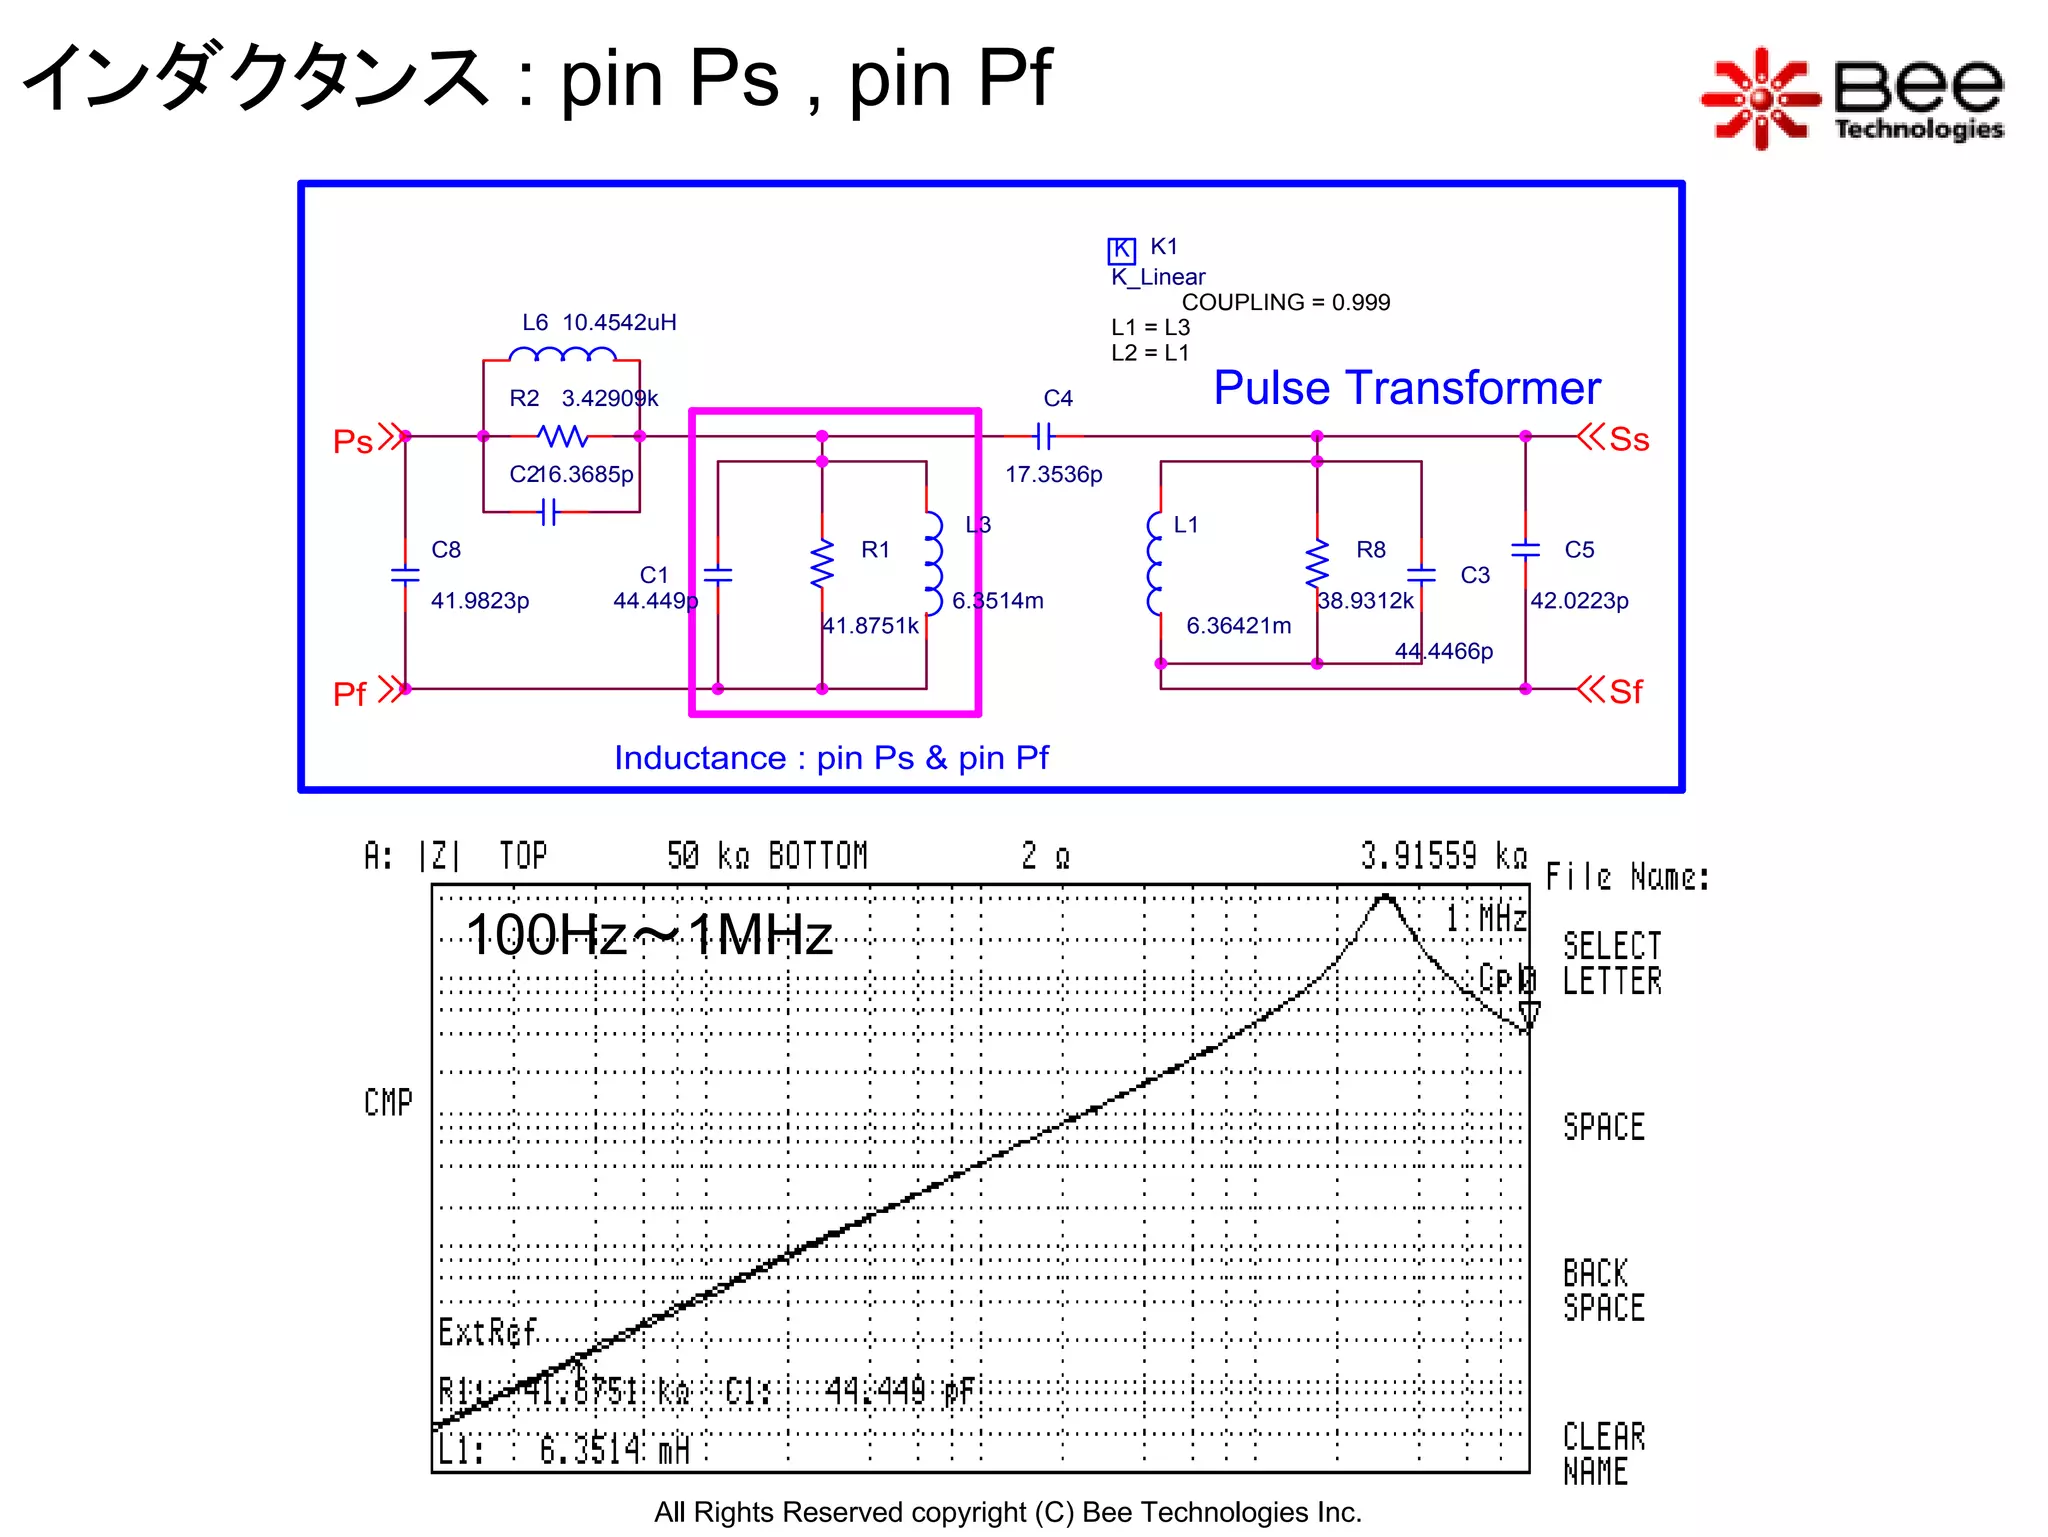
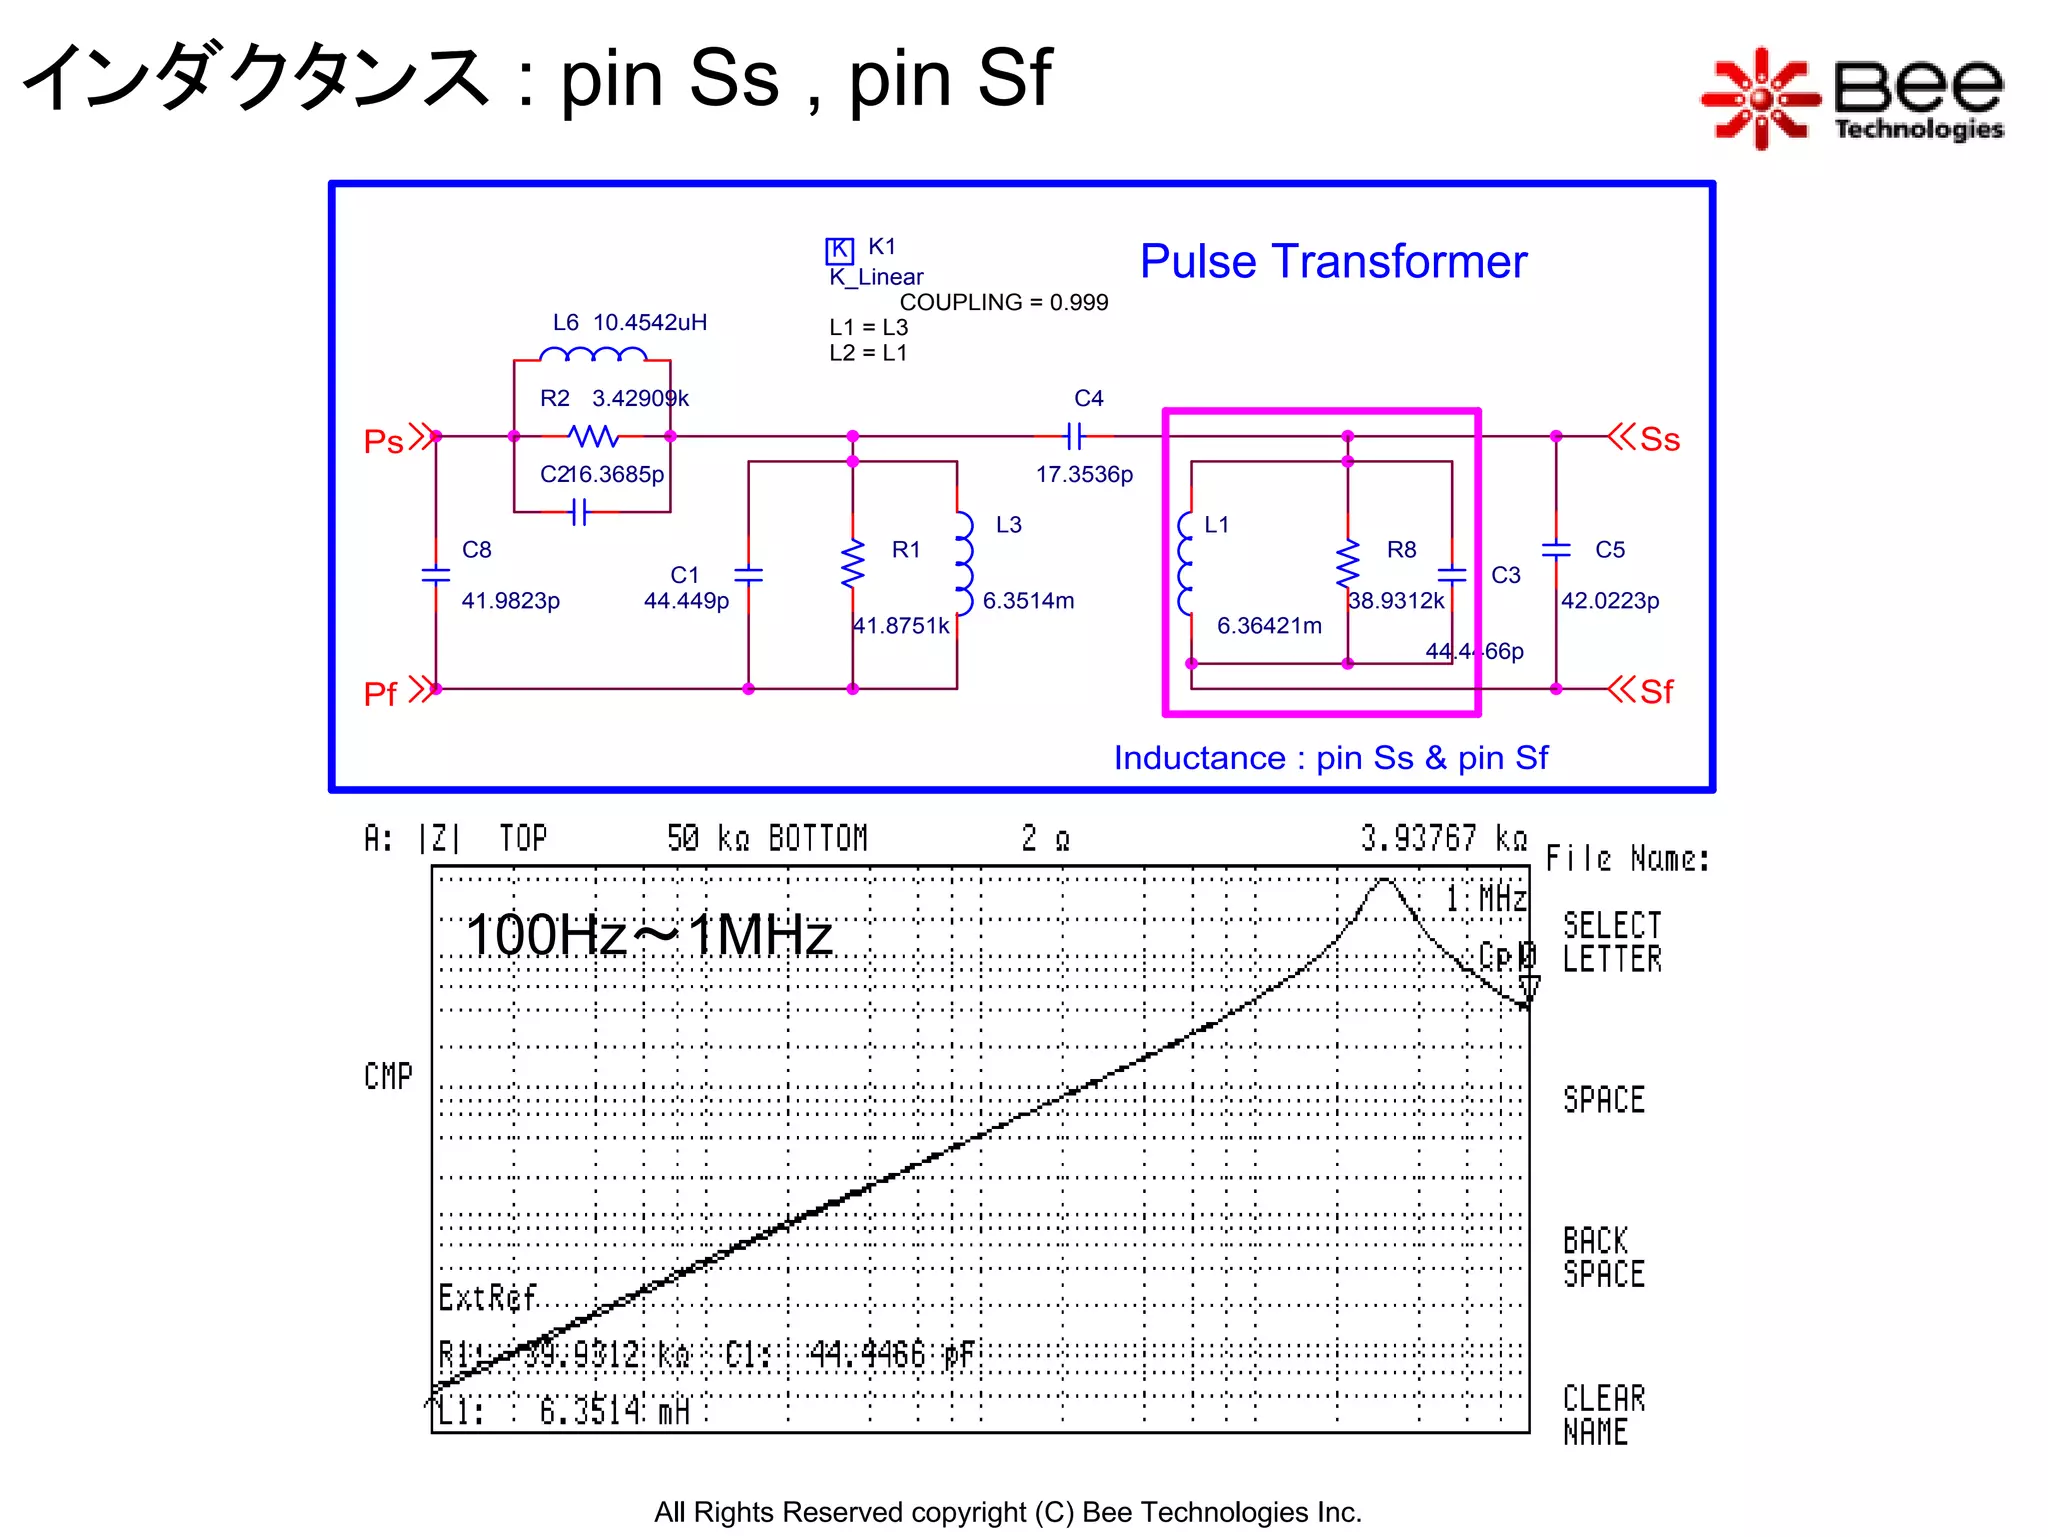
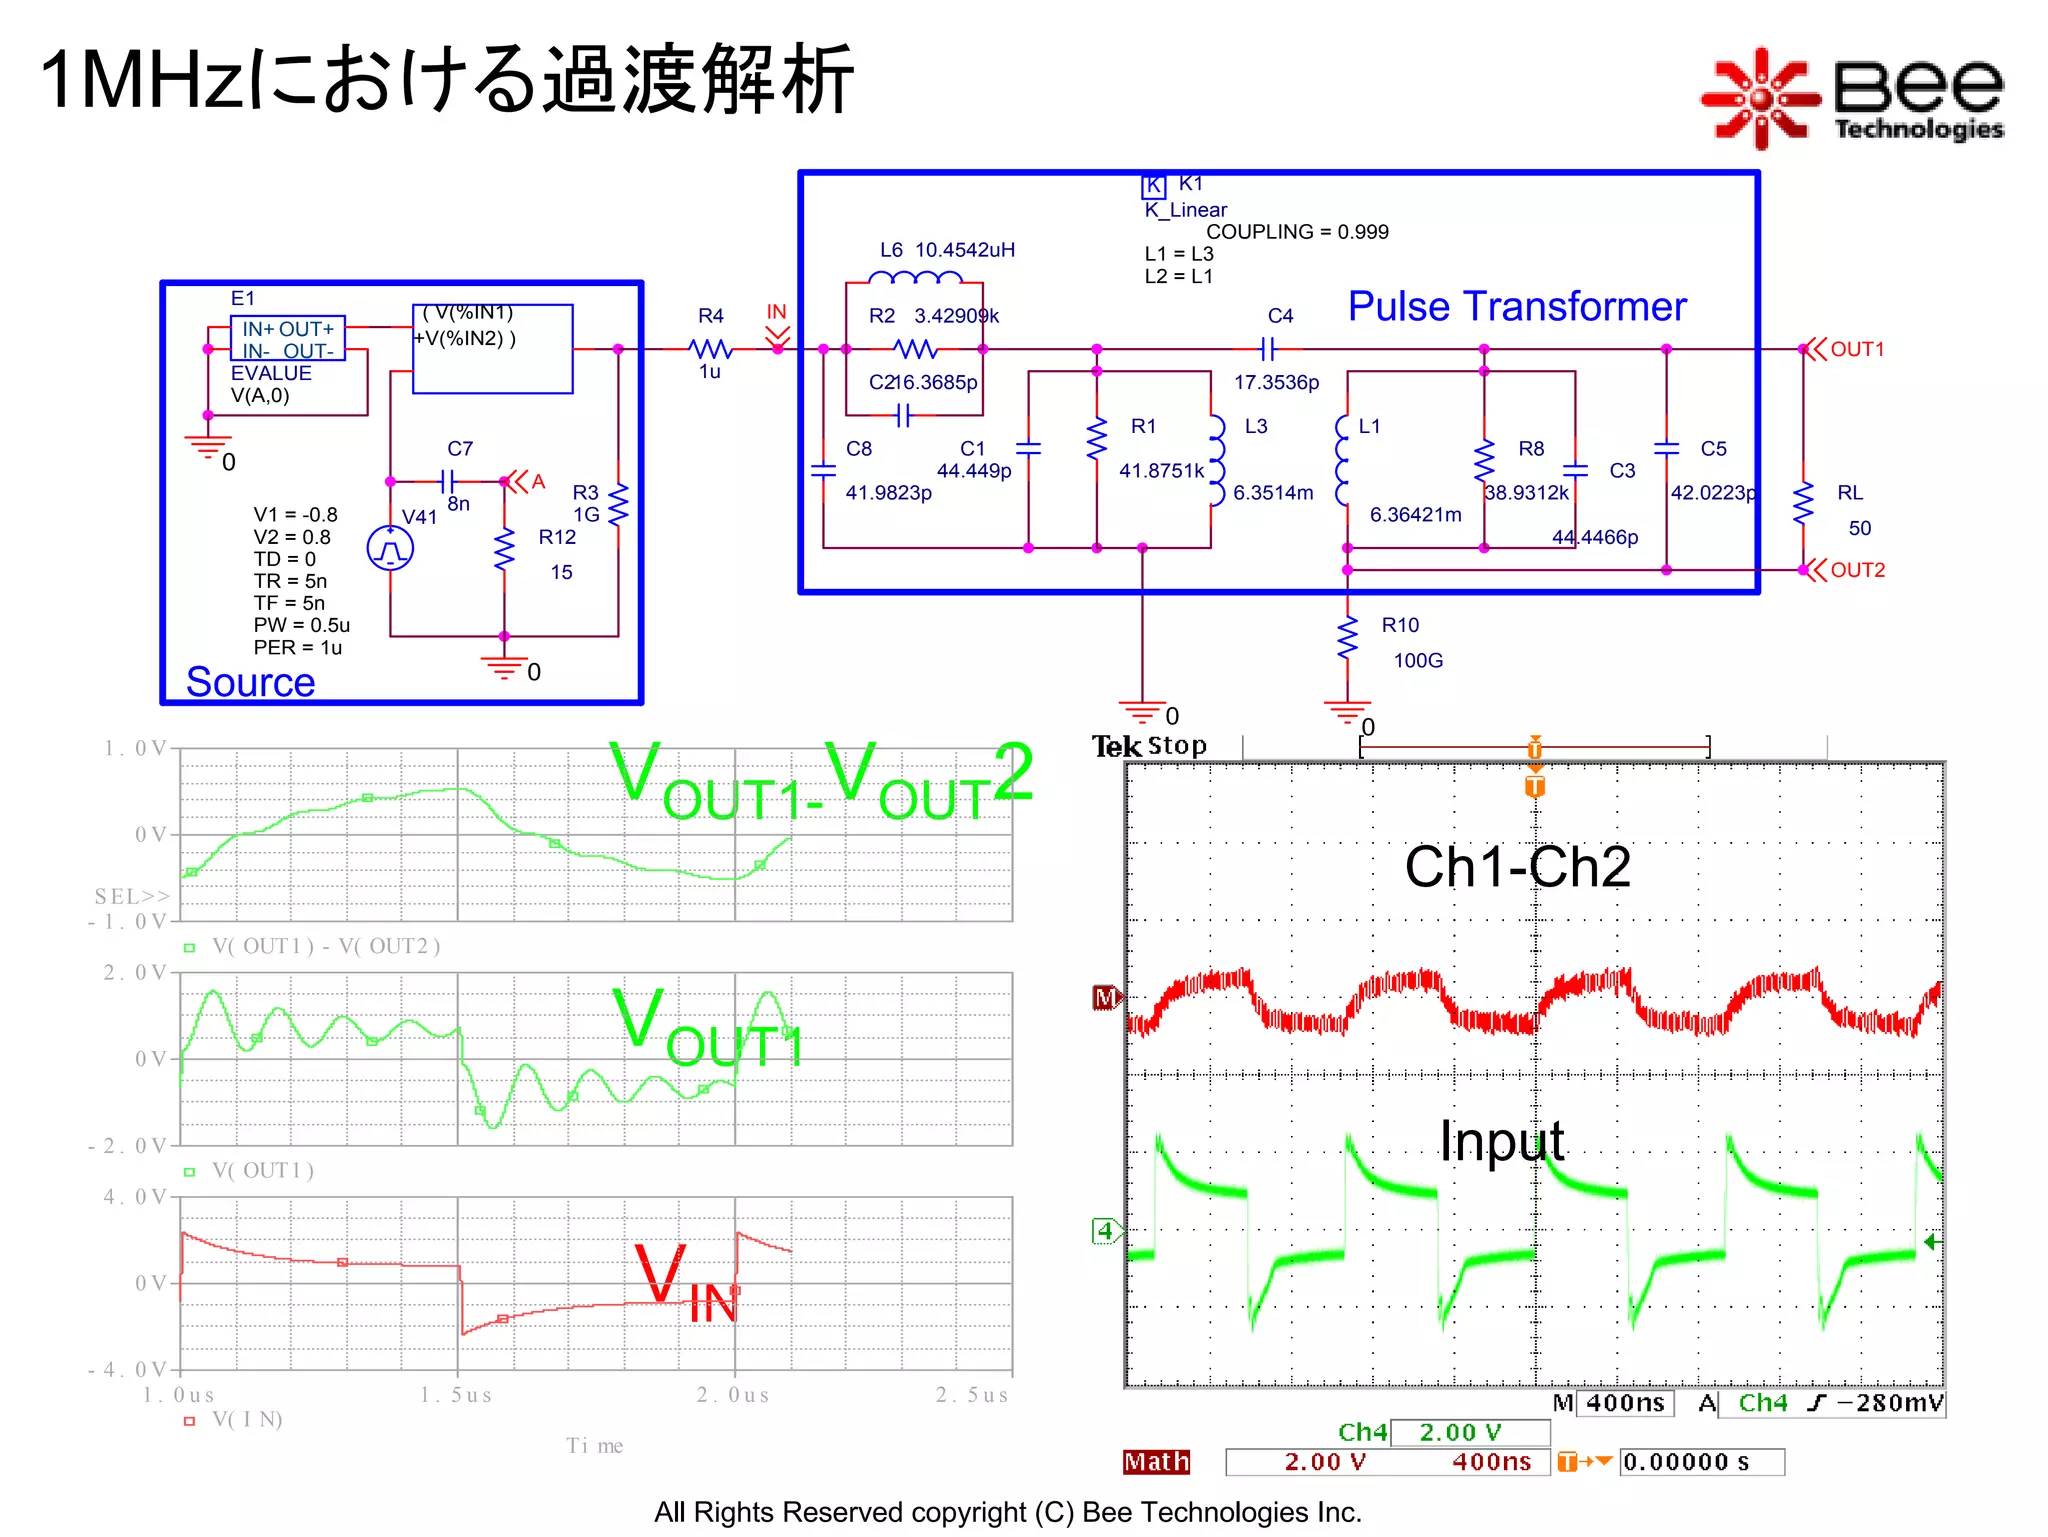
This document summarizes the device modeling of a pulse transformer in three sentences:
1) It uses a frequency characteristic model that can model frequencies from 100Hz to 100MHz.
2) It provides the equivalent circuit diagram and models the leakage inductance, inductance between terminals, and inductance at 1kHz transient analysis.
3) All content is copyrighted by Bee Technologies Inc.
The document discusses generating square and triangular waves using Fourier series of sine and cosine waves. It also examines signals in the time and frequency domains. Key points:
1) A square wave can be produced from a series of sine waves at different frequencies and amplitudes, with the fundamental and odd harmonics present.
2) A triangular wave results from a series of cosine waves, with the fundamental and odd harmonics.
3) Signals can be viewed in the time domain as voltage over time, or in the frequency domain as the amplitude of sine/cosine waves at different frequencies.
This document describes an experiment on Fourier theory and its applications in signal processing. The objectives are to: 1) Produce a square wave from sine waves of different frequencies and amplitudes using Fourier theory. 2) Produce a triangular wave similarly using cosine waves. 3) Examine the difference between time domain and frequency domain representations of signals. 4) Analyze periodic pulses with different duty cycles in both domains. 5) Examine the effect of low-pass filtering on pulses as the cutoff frequency varies. The experiment uses function generators, oscilloscopes, spectrum analyzers, and op-amps to generate and analyze signals.
This document describes an experiment on Fourier theory involving the time domain and frequency domain. The objectives are to generate square and triangular waves from Fourier series, examine the difference between time and frequency domain plots, and analyze periodic pulses with different duty cycles in both domains while varying a low-pass filter's cutoff frequency. Procedures generate waves using function generators and measure them on an oscilloscope and spectrum analyzer while eliminating harmonics. The document explains Fourier analysis and how signals can be represented by sine/cosine waves of different frequencies and amplitudes in the frequency domain.
Here are the key steps in the simulation example:
1. Set PWM controller parameters: FOSC, VREF, VP
2. Set output voltage: Rupper, Rlower
3. Select inductor: L for CCM operation
4. Select capacitor: C, ESR for ripple requirements
5. Extract compensator parameters: C1, C2, R1, R2
6. Simulate and verify switching waveforms, efficiency
The example shows designing, simulating, and verifying the operation of the boost converter to meet the given specifications.
This document describes an experiment to characterize active band-pass and band-stop filters. The objectives are to determine the gain-frequency response, center frequency, bandwidth, quality factor, and phase response. For the band-pass filter, the measured and calculated results for center frequency, gain, bandwidth, and quality factor agree to within 5%. For the band-stop filter, the measured and calculated results for center frequency, gain, bandwidth, and quality factor agree to within 1%. The phase response of the band-pass filter shows the output is approximately 180 degrees out of phase with the input at the center frequency.
The document discusses potentiostats, which are used to control the voltage between a working and reference electrode in electrochemical measurements. It describes the basic components and functions of a potentiostat, including maintaining a constant potential and delivering current. Voltammetry techniques that actively vary the cell potential are also summarized. Key aspects like accuracy, bandwidth, noise, and stability are important characteristics of potentiostats. Operational amplifiers and voltage ramp generators are important components of potentiostat circuitry used to control the electrochemical reaction and output current signals.
This document describes an experiment on Fourier theory involving the generation of square waves and triangular waves from a series of sine and cosine waves. Key points:
1. Square and triangular waves were generated on an oscilloscope from Fourier series of sine/cosine waves at different frequencies and amplitudes.
2. Measurements showed the fundamental frequency of the generated waves matched the frequency of the individual sine/cosine waves.
3. Removing higher harmonic waves caused the generated waves to become more sinusoidal, demonstrating the role of harmonics in shaping the waveform.
This document describes an experiment on pulse code modulation (PCM) using an analog-to-digital converter (ADC) and digital-to-analog converter (DAC). The objectives are to demonstrate PCM encoding and decoding, show how the ADC sampling rate relates to analog signal frequency, and examine the effect of low-pass filtering on the DAC output. The experiment involves using an 8-bit ADC to sample an analog signal and an 8-bit DAC to reconstruct the signal, with a low-pass filter to smooth the DAC output.
1. The document describes an experiment on Fourier theory and how signals can be represented in both the time domain and frequency domain. Square waves and triangular waves are generated from a series of sine and cosine waves (Fourier series) and plotted in both domains.
2. Low-pass filters are used to remove higher harmonics from signals. This distorts the original waveshape as more harmonics are removed. The bandwidth needed to transmit pulses with minimal distortion depends on the duty cycle.
3. Objectives include learning how square and triangular waves can be produced from Fourier series, comparing time and frequency domain plots, and examining how duty cycle and filtering affect pulses in both domains.
This document describes experiments performed to characterize active band-pass and band-stop filters, including plotting the gain-frequency response curves to determine cutoff frequencies and bandwidth, calculating quality factors and center frequencies, and comparing measured and expected voltage gains. Procedures are provided to implement and analyze a multiple-feedback band-pass filter and a two-pole Sallen-Key notch filter using op-amps and passive components.
The buck converter simulation example evaluates the switching waveforms and power switch voltages and currents. The specifications include a voltage output of 5V from an input voltage ranging from 7-40V. Inductor and capacitor values are selected to be 330uH and 330uF respectively. Simulation results are obtained for the switching waveforms, power switch voltages and currents using the average models with analysis directives to skip the breakpoints for a 10ms transient simulation.
This document describes an experiment on Fourier theory involving the time domain and frequency domain. It explains how square waves and triangular waves can be produced from a series of sine/cosine waves at different frequencies and amplitudes. The experiment uses function generators, an oscilloscope, and spectrum analyzer to generate and observe waveforms in both the time and frequency domains. It also examines how filtering affects periodic pulses with varying duty cycles.
1) The experiment demonstrated pulse code modulation (PCM) encoding using an analog-to-digital converter (ADC) and decoding using a digital-to-analog converter (DAC).
2) The sampling frequency determined by the pulse generator was measured to be 250 kHz, which was higher than twice the analog input frequency, satisfying the Nyquist criterion.
3) After low-pass filtering the DAC output, the waveform was smoothed into a close approximation of the original analog input signal.
IJERD (www.ijerd.com) International Journal of Engineering Research and Devel...IJERD Editor
This document summarizes research on estimating the conditions required to break lock in a missile-borne monopulse receiver. It describes designing a third-order phase-locked loop (PLL) receiver model and simulating two jamming scenarios: 1) continuous wave (CW) radar echo with CW jammer signal, and 2) CW radar echo with frequency-modulated (FM) CW jammer signal. For the first scenario, simulation results show the PLL loses lock to the radar echo when the jammer to signal amplitude ratio exceeds 1.01. For the second scenario, simulations estimate the FM modulation index required for break lock varies exponentially with the modulating signal voltage, and an empirical relationship is derived.
SIGNAL SPECTRA EXPERIMENT 2 - FINALS (for PULA)Sarah Krystelle
This document describes an experiment conducted on a class B push-pull power amplifier. The objectives were to determine the dc and ac load lines, observe crossover distortion, measure maximum output voltage and power, and calculate efficiency. The circuit diagram and theory of operation for a class B push-pull amplifier are provided. Key steps in the procedure involve using simulations and equipment to analyze the input/output waveforms, dc bias voltages, and performance metrics.
1. The document describes an experiment on Fourier theory involving the generation of square waves and triangular waves from a series of sine and cosine waves at different frequencies and amplitudes.
2. Key findings include that a square wave can be produced from odd harmonics of a fundamental sine wave, while a triangular wave can be produced from odd harmonic cosine waves. Eliminating harmonics distorts the output wave shape.
3. The time domain shows voltage over time, while the frequency domain shows amplitude by frequency using a Fourier series. Filtering affects the frequency spectrum and output wave shape.
1. The experiment demonstrated pulse-code modulation (PCM) using an analog-to-digital converter (ADC) and digital-to-analog converter (DAC).
2. The DAC output had a staircase-like waveform that was smoothed into an analog signal by a low-pass filter.
3. The sampling frequency determined by the pulse generator affected the time between samples but did not change the cutoff frequency of the filter or the output frequency, which matched the input analog signal frequency.
The document describes an experiment demonstrating pulse code modulation (PCM) using an analog-to-digital converter (ADC) and digital-to-analog converter (DAC). The experiment showed how the ADC sampling rate must be at least twice the analog signal frequency to avoid aliasing. It also showed that a low-pass filter can smooth the DAC's staircase output into a representation of the original analog signal. The conclusions were that PCM can digitize analog signals for digital communication, with ADC and DAC performing the encoding and decoding, and that the filter output retains the analog input frequency regardless of the sampling rate.
SIGNAL SPECTRA EXPERIMENT 1 - FINALS (for AGDON)Sarah Krystelle
This experiment analyzed the operation of a class A power amplifier. Key findings include:
1) The initial operating point (Q-point) was not centered on the AC load line, resulting in output clipping.
2) Adjusting the emitter resistance centered the Q-point on the AC load line, eliminating clipping and increasing the maximum undistorted output voltage.
3) A class A amplifier has low efficiency due to conduction over the entire input cycle, but provides the most linear amplification.
The document provides a device modeling report for a Toshiba TA7291P bridge driver IC. It includes:
- Component and part number details
- Circuit simulations and evaluation circuits showing the IC's operation under different input and output conditions
- Simulation results analyzing key parameters like supply current, input characteristics, saturation voltages, and diode characteristics.
The report concludes with 11 sections summarizing the IC's electrical behavior and performance based on circuit simulations, with tables comparing simulated and measured values.
The document summarizes an SPICE model of a 3-phase AC motor that can accurately reproduce: (1) frequency characteristics (impedance characteristics), (2) reverse electromotive force characteristics, and (3) physical characteristics. It provides details on parameter settings for the model, the simulation circuit diagram, and simulation results showing characteristics like phase current, back-EMF, speed, torque, power output, and efficiency under varying load conditions.
This document provides a device modeling report for a PWM stepping motor driver with the part number TB62206FG manufactured by Toshiba. The report details the circuit configuration including components, block diagrams of subcircuits, parameter definitions, and simulation results comparing phase input to phase output current.
The document describes the HAL 9000 computer system and presents an analysis of different inverter options for the system. It provides details on the system description, input/output requirements, performance requirements, and testing procedures. It then analyzes critical characteristics, schematics, DC analysis results, frequency response, propagation delays, and time delays for CMOS, BiCMOS, and TTL inverter options. The document compares these inverter options for use in the HAL 9000 system.
This document provides a design kit for a Forward Coupling Converter (FCC) with an output voltage of 5V, output current of 2A. The design kit shows the circuit diagram of the FCC including components such as inductors L1-L5, capacitors C1-C6, diodes D5LC20U_PRO, resistors R1-R5, and transistors U1-U2. It also lists the voltage, timing, and pulse parameters of the FCC design.
- The simulation shows the peak current in the bridge diode D1 at startup, which reaches around 140A.
- This occurs when the power supply is first turned on before it reaches steady state operation.
- The high current is due to the initial charging of the transformer primary from the DC bus capacitor.
- Over time, the current decreases as the power supply components become energized and regulated operation begins.
The document shows a circuit diagram and simulation results for a forward coupling converter (FCC) with an output voltage of 5V and current of 0.5A. It consists of inductors, capacitors, diodes, and switches arranged in an FCC configuration to step up or down an input voltage. The simulation graphs compare the voltage and current over time against theoretical measurements.
The document describes the design and construction of a logic pulser circuit that can override the logic state of a point being tested by generating a short pulse to drive the point to the opposite logic level. The circuit uses transistors to generate a 500 nanosecond pulse when a microswitch is pressed that can set the point under test to either a logic 1 or 0, and includes protections for safety and to prevent damage to the circuit being tested. Details are provided on the circuit design and components as well as guidelines for building the pulser on a printed circuit board with a microswitch.
This document describes the parameters for a power factor correction circuit simulation with the following key details:
1. The circuit includes components like diodes, MOSFETs, resistors, capacitors, and an IC controller.
2. Key parameters include an input AC voltage of 100V at 50Hz, inductors with values of 230uH and a ratio of 1:9.6, and a load current of 0.5A.
3. The circuit aims to provide power factor correction for an AC input voltage using the components and controller.
Her I am use MC3357 / LA1186 in this 2m Receiver
This experiment was done when I was a SWL lesson 145.625MHz Repeater / 145.650MHz Repeater 59 Signal Repot With my Home brew ground plan Antenna 10 feet height Excellent Sensitivity without preamp . Local osc are very stable when I on Rx 2min in drift +- 50 kHz and get very stable in 24 hrs.
This Receiver good perform for SWL / Ham operators / Monitor 2m band.
This document discusses Fourier analysis of signals in the time and frequency domains. It explains that any non-sinusoidal periodic signal can be represented as a sum of sinusoidal waves of different frequencies and amplitudes. Signals are normally expressed in the time domain but Fourier theory allows expressing them in the frequency domain. The frequency spectrum reveals the bandwidth needed to transmit the signal with minimal distortion. Fourier analysis is useful for analyzing digital pulses, and the duty cycle of a periodic pulse train affects its frequency spectrum. Sample circuits are provided to generate square and triangular waves using Fourier series approximations.
This document describes a temperature sensor circuit using an LM339 comparator. The circuit contains 3 voltage dividers that set reference voltages for 100C, 85C, and 60C, which are compared to the output of an LM35 temperature sensor by the 3 comparators in the LM339. The output of each comparator indicates if the sensed temperature has exceeded the reference temperature level.
This document discusses the astable operation of the 555 IC timer. It begins by stating the lesson and chapter objectives, which are to calculate the time delay and frequency of a 555 timer circuit. It then describes the specific objectives of being able to draw the astable multivibrator circuit using IC 555, calculate the mark and space timing, and calculate the oscillator frequency using a given formula. An example calculation is shown to determine the mark, space, and frequency values given resistor and capacitor component values in an astable multivibrator circuit.
1. The document provides a design kit for a high-precision linear regulator with an output voltage of 5V and output current of 3A.
2. The design kit includes schematics showing the circuit components including transistors, resistors, capacitors, and integrated circuits used in the regulator design.
3. The schematics provide details on the connections between the components and labeling for voltage and current measurements.
This document discusses Fourier theory and how it can be used to represent non-sinusoidal signals as a combination of sinusoidal waves of different frequencies and amplitudes. It provides examples of how square waves and triangular waves can be produced by adding together sine and cosine waves. The document also discusses the difference between analyzing signals in the time domain versus the frequency domain and how these representations provide different insights. Finally, it discusses how Fourier analysis can be used to understand the bandwidth requirements to transmit digital pulses accurately.
This document summarizes the modeling parameters and performance of the uPC78N08H voltage regulator. It includes:
1) A list of model parameters used in the PSpice model including reference voltage, emission coefficient, and capacitance values.
2) Simulation results showing the input-output voltage differential is within 0.008% of measurements.
3) Ripple rejection ratio simulation of 67.535dB is within -0.684% of measured value.
4) Output characteristic simulation of 7.9796V is within -0.255% of measured 8V output voltage.
The document provides instructions to build the Purple Peaker circuit. It includes a layout diagram and parts list for the circuit, which uses switches instead of potentiometers to modify the frequency response. Off-board components are not shown on the layout. The layout and parts list are intended to build the circuit described without any external modifications.
1. The document provides a parts list for building a 3000W inverter, including various capacitors, resistors, diodes, transistors, crystals, transformers, fuses, and chokes.
2. It then lists three key features of the 3000W inverter: advanced energy flow management, reduced component stress for reliability, and harmonics compensated wave shape for longer appliance life.
3. The document includes a circuit diagram for the 3000W inverter built using the listed parts.
This document summarizes the specifications and performance of the N13T2 programmable unijunction transistor (PUT) made by NEC. It includes the component parameters, equivalent circuit diagram, characteristics such as peak voltage and current, forward voltage, and pulse output voltage and rise time. The performance is evaluated based on the manufacturer's specifications.
This document provides a user manual for the Arduino Clonet (Serial) board. It includes descriptions of the main components and features, including the serial connector, power supply, ICSP header, jumpers, buttons, LEDs, pinouts for digital, analog and power pins. The board is fully compatible with Shield boards and includes auto reset, voltage regulation, noise filtering and other features to make it compatible with the Arduino platform.
Update 22 models(Schottky Rectifier ) in SPICE PARK(APR2024)Tsuyoshi Horigome
This document provides an inventory update of 6,747 parts at Spice Park as of April 2024. It lists the part numbers, manufacturers, and quantities of various semiconductor components, including 1,697 Schottky rectifier diodes from 29 different manufacturers. It also includes details on passive components, batteries, mechanical parts, motors, and lamps in the inventory.
The document provides an inventory update from April 2024 of the Spice Park collection which contains 6,747 electronic components. It includes tables listing the types of semiconductor components, passive parts, batteries, mechanical parts, motors, and lamps in the collection along with their manufacturer and quantities. One of the semiconductor components, the general purpose rectifier diode, is broken down into a more detailed table with 116 entries providing part numbers, manufacturers, thermal ratings, and remarks.
Update 31 models(Diode/General ) in SPICE PARK(MAR2024)Tsuyoshi Horigome
The document provides an inventory update from March 2024 of parts in the Spice Park warehouse. It lists 6,725 total parts across various categories including semiconductors, passive parts, batteries, mechanical parts, motors, and lamps. The semiconductor section lists 652 general purpose rectifier diodes from 18 different manufacturers with quantities ranging from 2 to 145 pieces.
This document provides an inventory list of parts at Spice Park as of March 2024. It contains 3 sections - Semiconductor parts (diodes, transistors, ICs etc.), Passive parts (capacitors, resistors etc.), and Battery parts. For Semiconductor parts, it lists 36 different part types and provides the quantity of each part. It then provides further details of Diode/General Purpose Rectifiers, listing the manufacturer and quantity of 652 individual part numbers.
Update 29 models(Solar cell) in SPICE PARK(FEB2024)Tsuyoshi Horigome
The document provides an inventory update from February 2024 of Spice Park, which contains 6,694 total pieces of electronic components and parts. It lists 36 categories of semiconductor devices, 11 categories of passive parts, 10 types of batteries, 5 mechanical parts, DC motors, lamps, and power supplies. It provides the most detailed listing for solar cells, with 1,003 total pieces from 51 manufacturers listed with part numbers.
The document provides an inventory update from February 2024 of Spice Park, which contains 6,694 electronic components. It lists the components by type (e.g. semiconductor), part number, manufacturer, thermal rating, and quantity on hand. For example, it shows that there are 621 general purpose rectifier diodes from manufacturers such as Fairchild, Fuji, Intersil, Rohm, Shindengen, and Toshiba. The detailed four-page section provides further information on the first item, general purpose rectifier diodes, including 152 individual part numbers and specifications.
This document discusses circuit simulations using LTspice. It describes driving a circuit simulation by inserting a 250 ohm resistor between the output terminals. It also describes simulating a 1 channel bridge circuit where the DUT1 and DUT2 resistors are both set to 100 ohms and the input voltage is set to either 1V or 5V.
This document discusses parametric sweeps of external and internal resistance values Rg for circuit simulation in LTspice. It also references outputting a waveform similar to a report on fall time characteristics for a device modeling report with customer Samsung.
Skybuffer SAM4U tool for SAP license adoptionTatiana Kojar
Manage and optimize your license adoption and consumption with SAM4U, an SAP free customer software asset management tool.
SAM4U, an SAP complimentary software asset management tool for customers, delivers a detailed and well-structured overview of license inventory and usage with a user-friendly interface. We offer a hosted, cost-effective, and performance-optimized SAM4U setup in the Skybuffer Cloud environment. You retain ownership of the system and data, while we manage the ABAP 7.58 infrastructure, ensuring fixed Total Cost of Ownership (TCO) and exceptional services through the SAP Fiori interface.
Session 1 - Intro to Robotic Process Automation.pdfUiPathCommunity
👉 Check out our full 'Africa Series - Automation Student Developers (EN)' page to register for the full program:
https://bit.ly/Automation_Student_Kickstart
In this session, we shall introduce you to the world of automation, the UiPath Platform, and guide you on how to install and setup UiPath Studio on your Windows PC.
📕 Detailed agenda:
What is RPA? Benefits of RPA?
RPA Applications
The UiPath End-to-End Automation Platform
UiPath Studio CE Installation and Setup
💻 Extra training through UiPath Academy:
Introduction to Automation
UiPath Business Automation Platform
Explore automation development with UiPath Studio
👉 Register here for our upcoming Session 2 on June 20: Introduction to UiPath Studio Fundamentals: https://community.uipath.com/events/details/uipath-lagos-presents-session-2-introduction-to-uipath-studio-fundamentals/
Have you ever been confused by the myriad of choices offered by AWS for hosting a website or an API?
Lambda, Elastic Beanstalk, Lightsail, Amplify, S3 (and more!) can each host websites + APIs. But which one should we choose?
Which one is cheapest? Which one is fastest? Which one will scale to meet our needs?
Join me in this session as we dive into each AWS hosting service to determine which one is best for your scenario and explain why!
inQuba Webinar Mastering Customer Journey Management with Dr Graham HillLizaNolte
HERE IS YOUR WEBINAR CONTENT! 'Mastering Customer Journey Management with Dr. Graham Hill'. We hope you find the webinar recording both insightful and enjoyable.
In this webinar, we explored essential aspects of Customer Journey Management and personalization. Here’s a summary of the key insights and topics discussed:
Key Takeaways:
Understanding the Customer Journey: Dr. Hill emphasized the importance of mapping and understanding the complete customer journey to identify touchpoints and opportunities for improvement.
Personalization Strategies: We discussed how to leverage data and insights to create personalized experiences that resonate with customers.
Technology Integration: Insights were shared on how inQuba’s advanced technology can streamline customer interactions and drive operational efficiency.
LF Energy Webinar: Carbon Data Specifications: Mechanisms to Improve Data Acc...DanBrown980551
This LF Energy webinar took place June 20, 2024. It featured:
-Alex Thornton, LF Energy
-Hallie Cramer, Google
-Daniel Roesler, UtilityAPI
-Henry Richardson, WattTime
In response to the urgency and scale required to effectively address climate change, open source solutions offer significant potential for driving innovation and progress. Currently, there is a growing demand for standardization and interoperability in energy data and modeling. Open source standards and specifications within the energy sector can also alleviate challenges associated with data fragmentation, transparency, and accessibility. At the same time, it is crucial to consider privacy and security concerns throughout the development of open source platforms.
This webinar will delve into the motivations behind establishing LF Energy’s Carbon Data Specification Consortium. It will provide an overview of the draft specifications and the ongoing progress made by the respective working groups.
Three primary specifications will be discussed:
-Discovery and client registration, emphasizing transparent processes and secure and private access
-Customer data, centering around customer tariffs, bills, energy usage, and full consumption disclosure
-Power systems data, focusing on grid data, inclusive of transmission and distribution networks, generation, intergrid power flows, and market settlement data
What is an RPA CoE? Session 1 – CoE VisionDianaGray10
In the first session, we will review the organization's vision and how this has an impact on the COE Structure.
Topics covered:
• The role of a steering committee
• How do the organization’s priorities determine CoE Structure?
Speaker:
Chris Bolin, Senior Intelligent Automation Architect Anika Systems
Essentials of Automations: Exploring Attributes & Automation ParametersSafe Software
Building automations in FME Flow can save time, money, and help businesses scale by eliminating data silos and providing data to stakeholders in real-time. One essential component to orchestrating complex automations is the use of attributes & automation parameters (both formerly known as “keys”). In fact, it’s unlikely you’ll ever build an Automation without using these components, but what exactly are they?
Attributes & automation parameters enable the automation author to pass data values from one automation component to the next. During this webinar, our FME Flow Specialists will cover leveraging the three types of these output attributes & parameters in FME Flow: Event, Custom, and Automation. As a bonus, they’ll also be making use of the Split-Merge Block functionality.
You’ll leave this webinar with a better understanding of how to maximize the potential of automations by making use of attributes & automation parameters, with the ultimate goal of setting your enterprise integration workflows up on autopilot.
Discover top-tier mobile app development services, offering innovative solutions for iOS and Android. Enhance your business with custom, user-friendly mobile applications.
"Choosing proper type of scaling", Olena SyrotaFwdays
Imagine an IoT processing system that is already quite mature and production-ready and for which client coverage is growing and scaling and performance aspects are life and death questions. The system has Redis, MongoDB, and stream processing based on ksqldb. In this talk, firstly, we will analyze scaling approaches and then select the proper ones for our system.
zkStudyClub - LatticeFold: A Lattice-based Folding Scheme and its Application...Alex Pruden
Folding is a recent technique for building efficient recursive SNARKs. Several elegant folding protocols have been proposed, such as Nova, Supernova, Hypernova, Protostar, and others. However, all of them rely on an additively homomorphic commitment scheme based on discrete log, and are therefore not post-quantum secure. In this work we present LatticeFold, the first lattice-based folding protocol based on the Module SIS problem. This folding protocol naturally leads to an efficient recursive lattice-based SNARK and an efficient PCD scheme. LatticeFold supports folding low-degree relations, such as R1CS, as well as high-degree relations, such as CCS. The key challenge is to construct a secure folding protocol that works with the Ajtai commitment scheme. The difficulty, is ensuring that extracted witnesses are low norm through many rounds of folding. We present a novel technique using the sumcheck protocol to ensure that extracted witnesses are always low norm no matter how many rounds of folding are used. Our evaluation of the final proof system suggests that it is as performant as Hypernova, while providing post-quantum security.
Paper Link: https://eprint.iacr.org/2024/257
Your One-Stop Shop for Python Success: Top 10 US Python Development Providersakankshawande
Simplify your search for a reliable Python development partner! This list presents the top 10 trusted US providers offering comprehensive Python development services, ensuring your project's success from conception to completion.
Fueling AI with Great Data with Airbyte WebinarZilliz
This talk will focus on how to collect data from a variety of sources, leveraging this data for RAG and other GenAI use cases, and finally charting your course to productionalization.
The Microsoft 365 Migration Tutorial For Beginner.pptxoperationspcvita
This presentation will help you understand the power of Microsoft 365. However, we have mentioned every productivity app included in Office 365. Additionally, we have suggested the migration situation related to Office 365 and how we can help you.
You can also read: https://www.systoolsgroup.com/updates/office-365-tenant-to-tenant-migration-step-by-step-complete-guide/
Taking AI to the Next Level in Manufacturing.pdfssuserfac0301
Read Taking AI to the Next Level in Manufacturing to gain insights on AI adoption in the manufacturing industry, such as:
1. How quickly AI is being implemented in manufacturing.
2. Which barriers stand in the way of AI adoption.
3. How data quality and governance form the backbone of AI.
4. Organizational processes and structures that may inhibit effective AI adoption.
6. Ideas and approaches to help build your organization's AI strategy.