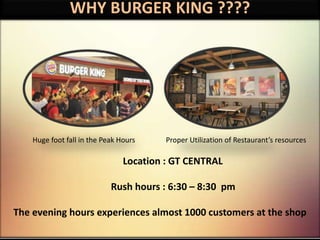
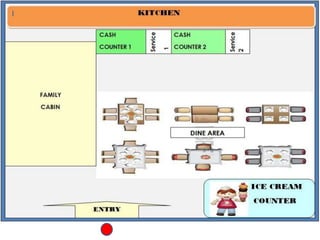
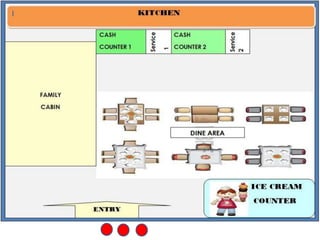
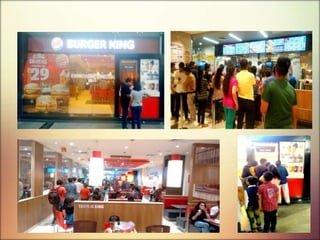
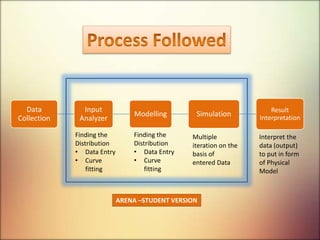
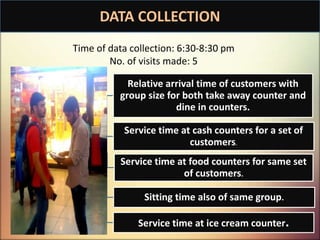
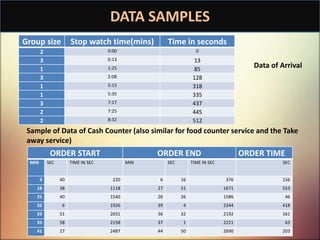
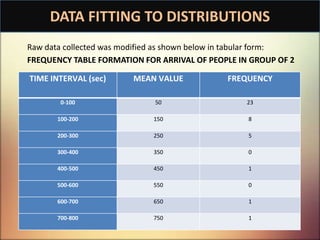
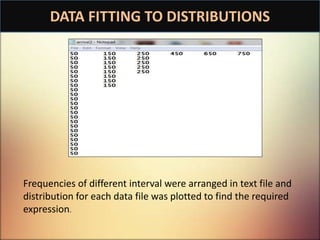
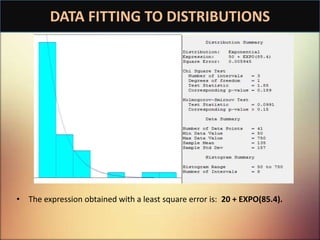
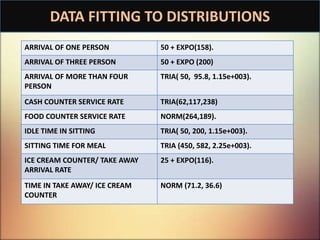
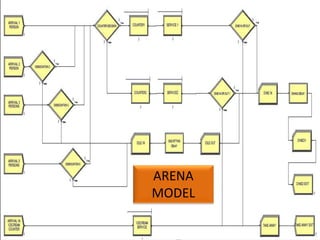
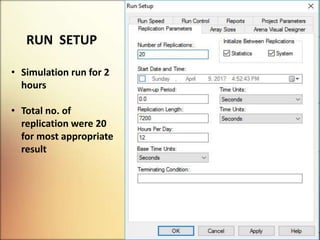
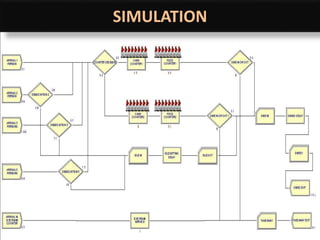
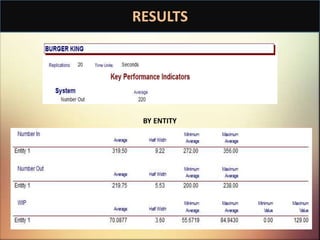
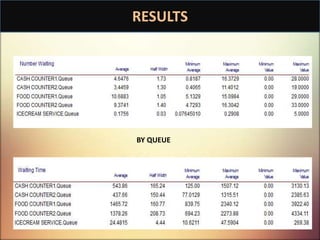
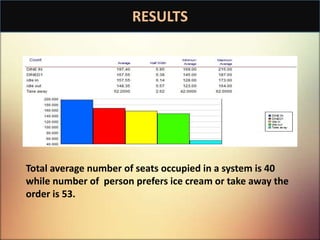
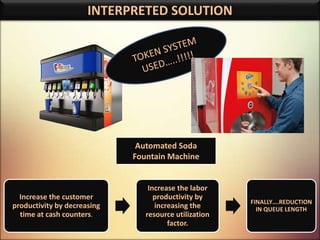
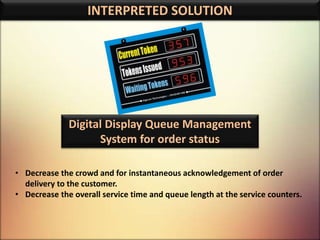
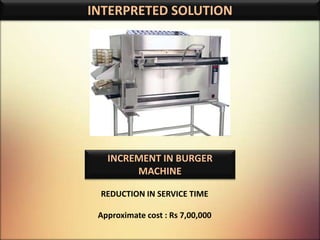
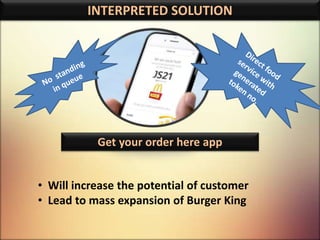
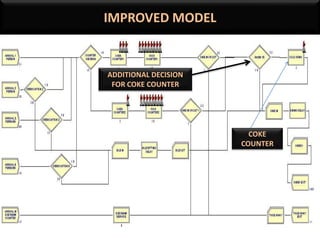
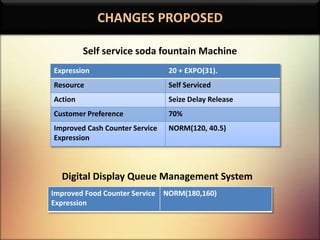
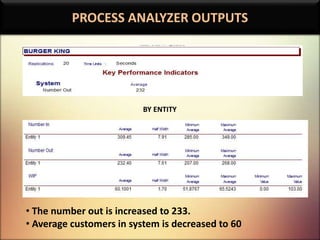
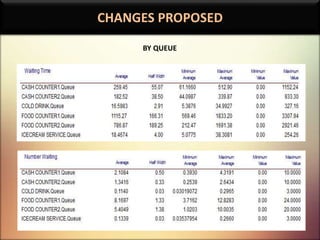
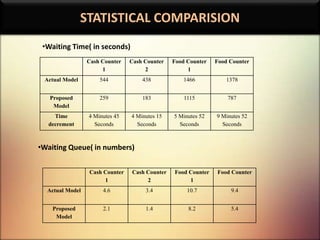
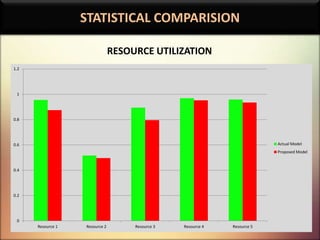
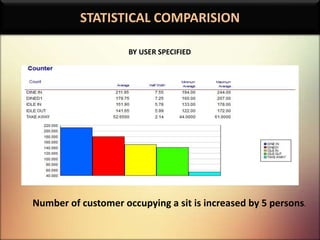
Modeling and Simulation Lab
Queuing Theory for
Presentation by :-
Rajat Goyal(2014UME1504)
Pawan Yadav(2014UME1488)
Sagar Kartik Dharmendra(2014UME1456)
Presented to:
Dr. Gunjan Soni
WHY BURGER KING ????
Huge foot fall in the Peak Hours Proper Utilization of Restaurant’s resources
Location : GT CENTRAL
Rush hours : 6:30 – 8:30 pm
The evening hours experiences almost 1000 customers at the shop
In the rush hours the average waiting time of the customer reaches up to 15 minutes
at the cash counters itself..………!!!!!!!!!!!!
With competition being nearby itself, efficiency must be worked upon
• There are no breaks for the workers during the time when the model is
running. Every counter has a single server.
• Only one customer from each group place an order and even that is only
once. No repetition in order is observed.
• Group of 4 customers or exceeding are averaged as group of five based on
data.
• There is no intermixing in queue of different cash counters and service
counters as observed in minimum cases.
• The time is assumed to be same for both cash counters and also at service
counters.
• The ice cream ordered by a person dining is taken at the ice cream counter
separately.
PROBLEM LAYOUT
Data
Collection
Input
Analyzer
Modelling Simulation
Result
Interpretation
Finding the
Distribution
• Data Entry
• Curve
fitting
Finding the
Distribution
• Data Entry
• Curve
fitting
Multiple
iteration on the
basis of
entered Data
Interpret the
data (output)
to put in form
of Physical
Model
ARENA –STUDENT VERSION
DATA COLLECTION
Time of data collection: 6:30-8:30 pm
No. of visits made: 5
DATACOLLECTION
Relative arrival time of customers with
group size for both take away counter and
dine in counters.
Service time at cash counters for a set of
customers.
Service time at food counters for same set
of customers.
Sitting time also of same group.
Service time at ice cream counter.
DATA SAMPLES
Group size Stop watch time(mins) Time in seconds
2 0:00 0
3 0:13 13
1 1:25 85
3 2:08 128
1 5:15 318
1 5:35 335
3 7:17 437
2 7:25 445
2 8:32 512
ORDER START ORDER END ORDER TIME
MIN SEC TIME IN SEC MIN SEC TIME IN SEC SEC
3 40 220 6 16 376 156
18 38 1118 27 51 1671 553
25 40 1540 26 26 1586 46
32 6 1926 39 4 2344 418
33 51 2031 36 32 2192 161
35 58 2158 37 1 2221 63
41 27 2487 44 50 2690 203
Data of Arrival
Sample of Data of Cash Counter (also similar for food counter service and the Take
away service)
DATA FITTING TO DISTRIBUTIONS
Raw data collected was modified as shown below in tabular form:
FREQUENCY TABLE FORMATION FOR ARRIVAL OF PEOPLE IN GROUP OF 2
TIME INTERVAL (sec) MEAN VALUE FREQUENCY
0-100 50 23
100-200 150 8
200-300 250 5
300-400 350 0
400-500 450 1
500-600 550 0
600-700 650 1
700-800 750 1
DATA FITTING TO DISTRIBUTIONS
Frequencies of different interval were arranged in text file and
distribution for each data file was plotted to find the required
expression.
DATA FITTING TO DISTRIBUTIONS
• The expression obtained with a least square error is: 20 + EXPO(85.4).
ARRIVAL OF ONE PERSON 50 + EXPO(158).
ARRIVAL OF THREE PERSON 50 + EXPO (200)
ARRIVAL OF MORE THAN FOUR
PERSON
TRIA( 50, 95.8, 1.15e+003).
CASH COUNTER SERVICE RATE TRIA(62,117,238)
FOOD COUNTER SERVICE RATE NORM(264,189).
IDLE TIME IN SITTING TRIA( 50, 200, 1.15e+003).
SITTING TIME FOR MEAL TRIA (450, 582, 2.25e+003).
ICE CREAM COUNTER/ TAKE AWAY
ARRIVAL RATE
25 + EXPO(116).
TIME IN TAKE AWAY/ ICE CREAM
COUNTER
NORM (71.2, 36.6)
DATA FITTING TO DISTRIBUTIONS
ARENA
MODEL
RUN SETUP
• Simulation run for 2
hours
• Total no. of
replication were 20
for most appropriate
result
SIMULATION
RESULTS
BY ENTITY
RESULTS
BY QUEUE
ARENA
MODEL
RESULTS
Total average number of seats occupied in a system is 40
while number of person prefers ice cream or take away the
order is 53.
NOW WE PROVIDE THE INTERPRETATION AND
POSSIBLE SOLUTION……….
Increase the customer
productivity by decreasing
time at cash counters.
Increase the labor
productivity by
increasing the
resource utilization
factor.
FINALLY….REDUCTION
IN QUEUE LENGTH
INTERPRETED SOLUTION
Automated Soda
Fountain Machine
INTERPRETED SOLUTION
Digital Display Queue Management
System for order status
• Decrease the crowd and for instantaneous acknowledgement of order
delivery to the customer.
• Decrease the overall service time and queue length at the service counters.
INTERPRETED SOLUTION
INCREMENT IN BURGER
MACHINE
REDUCTION IN SERVICE TIME
Approximate cost : Rs 7,00,000
INTERPRETED SOLUTION
Get your order here app
• Will increase the potential of customer
• Lead to mass expansion of Burger King
IMPROVED MODEL
ADDITIONAL DECISION
FOR COKE COUNTER
COKE
COUNTER
CHANGES PROPOSED
Expression 20 + EXPO(31).
Resource Self Serviced
Action Seize Delay Release
Customer Preference 70%
Improved Cash Counter Service
Expression
NORM(120, 40.5)
Improved Food Counter Service
Expression
NORM(180,160)
Self service soda fountain Machine
Digital Display Queue Management System
PROCESS ANALYZER OUTPUTS
• The number out is increased to 233.
• Average customers in system is decreased to 60
BY ENTITY
CHANGES PROPOSED
BY QUEUE
STATISTICAL COMPARISION
Cash Counter
1
Cash Counter
2
Food Counter
1
Food Counter
Actual Model 544 438 1466 1378
Proposed
Model
259 183 1115 787
Time
decrement
4 Minutes 45
Seconds
4 Minutes 15
Seconds
5 Minutes 52
Seconds
9 Minutes 52
Seconds
Cash Counter
1
Cash Counter
2
Food Counter
1
Food Counter
Actual Model 4.6 3.4 10.7 9.4
Proposed
Model
2.1 1.4 8.2 5.4
•Waiting Time( in seconds)
•Waiting Queue( in numbers)
STATISTICAL COMPARISION
RESOURCE UTILIZATION
0
0.2
0.4
0.6
0.8
1
1.2
Resource 1 Resource 2 Resource 3 Resource 4 Resource 5
Actual Model
Proposed Model
BY USER SPECIFIED
Number of customer occupying a sit is increased by 5 persons.
STATISTICAL COMPARISION
THANK YOU..!!!
QUSETIONS AND ANSWERS

Simulation project on Burger King

  • 1.
    Modeling and SimulationLab Queuing Theory for Presentation by :- Rajat Goyal(2014UME1504) Pawan Yadav(2014UME1488) Sagar Kartik Dharmendra(2014UME1456) Presented to: Dr. Gunjan Soni
  • 2.
    WHY BURGER KING???? Huge foot fall in the Peak Hours Proper Utilization of Restaurant’s resources Location : GT CENTRAL Rush hours : 6:30 – 8:30 pm The evening hours experiences almost 1000 customers at the shop
  • 3.
    In the rushhours the average waiting time of the customer reaches up to 15 minutes at the cash counters itself..………!!!!!!!!!!!! With competition being nearby itself, efficiency must be worked upon
  • 5.
    • There areno breaks for the workers during the time when the model is running. Every counter has a single server. • Only one customer from each group place an order and even that is only once. No repetition in order is observed. • Group of 4 customers or exceeding are averaged as group of five based on data. • There is no intermixing in queue of different cash counters and service counters as observed in minimum cases. • The time is assumed to be same for both cash counters and also at service counters. • The ice cream ordered by a person dining is taken at the ice cream counter separately.
  • 6.
  • 10.
    Data Collection Input Analyzer Modelling Simulation Result Interpretation Finding the Distribution •Data Entry • Curve fitting Finding the Distribution • Data Entry • Curve fitting Multiple iteration on the basis of entered Data Interpret the data (output) to put in form of Physical Model ARENA –STUDENT VERSION
  • 11.
    DATA COLLECTION Time ofdata collection: 6:30-8:30 pm No. of visits made: 5 DATACOLLECTION Relative arrival time of customers with group size for both take away counter and dine in counters. Service time at cash counters for a set of customers. Service time at food counters for same set of customers. Sitting time also of same group. Service time at ice cream counter.
  • 12.
    DATA SAMPLES Group sizeStop watch time(mins) Time in seconds 2 0:00 0 3 0:13 13 1 1:25 85 3 2:08 128 1 5:15 318 1 5:35 335 3 7:17 437 2 7:25 445 2 8:32 512 ORDER START ORDER END ORDER TIME MIN SEC TIME IN SEC MIN SEC TIME IN SEC SEC 3 40 220 6 16 376 156 18 38 1118 27 51 1671 553 25 40 1540 26 26 1586 46 32 6 1926 39 4 2344 418 33 51 2031 36 32 2192 161 35 58 2158 37 1 2221 63 41 27 2487 44 50 2690 203 Data of Arrival Sample of Data of Cash Counter (also similar for food counter service and the Take away service)
  • 13.
    DATA FITTING TODISTRIBUTIONS Raw data collected was modified as shown below in tabular form: FREQUENCY TABLE FORMATION FOR ARRIVAL OF PEOPLE IN GROUP OF 2 TIME INTERVAL (sec) MEAN VALUE FREQUENCY 0-100 50 23 100-200 150 8 200-300 250 5 300-400 350 0 400-500 450 1 500-600 550 0 600-700 650 1 700-800 750 1
  • 14.
    DATA FITTING TODISTRIBUTIONS Frequencies of different interval were arranged in text file and distribution for each data file was plotted to find the required expression.
  • 15.
    DATA FITTING TODISTRIBUTIONS • The expression obtained with a least square error is: 20 + EXPO(85.4).
  • 16.
    ARRIVAL OF ONEPERSON 50 + EXPO(158). ARRIVAL OF THREE PERSON 50 + EXPO (200) ARRIVAL OF MORE THAN FOUR PERSON TRIA( 50, 95.8, 1.15e+003). CASH COUNTER SERVICE RATE TRIA(62,117,238) FOOD COUNTER SERVICE RATE NORM(264,189). IDLE TIME IN SITTING TRIA( 50, 200, 1.15e+003). SITTING TIME FOR MEAL TRIA (450, 582, 2.25e+003). ICE CREAM COUNTER/ TAKE AWAY ARRIVAL RATE 25 + EXPO(116). TIME IN TAKE AWAY/ ICE CREAM COUNTER NORM (71.2, 36.6) DATA FITTING TO DISTRIBUTIONS
  • 17.
  • 18.
    RUN SETUP • Simulationrun for 2 hours • Total no. of replication were 20 for most appropriate result
  • 19.
  • 20.
  • 21.
  • 22.
  • 23.
    RESULTS Total average numberof seats occupied in a system is 40 while number of person prefers ice cream or take away the order is 53.
  • 24.
    NOW WE PROVIDETHE INTERPRETATION AND POSSIBLE SOLUTION……….
  • 25.
    Increase the customer productivityby decreasing time at cash counters. Increase the labor productivity by increasing the resource utilization factor. FINALLY….REDUCTION IN QUEUE LENGTH INTERPRETED SOLUTION Automated Soda Fountain Machine
  • 26.
    INTERPRETED SOLUTION Digital DisplayQueue Management System for order status • Decrease the crowd and for instantaneous acknowledgement of order delivery to the customer. • Decrease the overall service time and queue length at the service counters.
  • 27.
    INTERPRETED SOLUTION INCREMENT INBURGER MACHINE REDUCTION IN SERVICE TIME Approximate cost : Rs 7,00,000
  • 28.
    INTERPRETED SOLUTION Get yourorder here app • Will increase the potential of customer • Lead to mass expansion of Burger King
  • 29.
    IMPROVED MODEL ADDITIONAL DECISION FORCOKE COUNTER COKE COUNTER
  • 30.
    CHANGES PROPOSED Expression 20+ EXPO(31). Resource Self Serviced Action Seize Delay Release Customer Preference 70% Improved Cash Counter Service Expression NORM(120, 40.5) Improved Food Counter Service Expression NORM(180,160) Self service soda fountain Machine Digital Display Queue Management System
  • 31.
    PROCESS ANALYZER OUTPUTS •The number out is increased to 233. • Average customers in system is decreased to 60 BY ENTITY
  • 32.
  • 33.
    STATISTICAL COMPARISION Cash Counter 1 CashCounter 2 Food Counter 1 Food Counter Actual Model 544 438 1466 1378 Proposed Model 259 183 1115 787 Time decrement 4 Minutes 45 Seconds 4 Minutes 15 Seconds 5 Minutes 52 Seconds 9 Minutes 52 Seconds Cash Counter 1 Cash Counter 2 Food Counter 1 Food Counter Actual Model 4.6 3.4 10.7 9.4 Proposed Model 2.1 1.4 8.2 5.4 •Waiting Time( in seconds) •Waiting Queue( in numbers)
  • 34.
    STATISTICAL COMPARISION RESOURCE UTILIZATION 0 0.2 0.4 0.6 0.8 1 1.2 Resource1 Resource 2 Resource 3 Resource 4 Resource 5 Actual Model Proposed Model
  • 35.
    BY USER SPECIFIED Numberof customer occupying a sit is increased by 5 persons. STATISTICAL COMPARISION
  • 36.
  • 37.