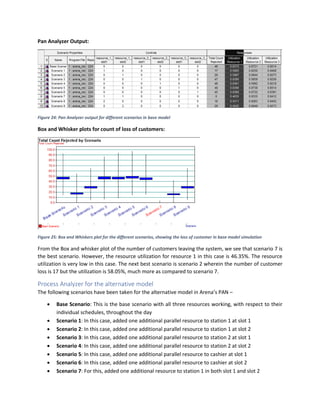
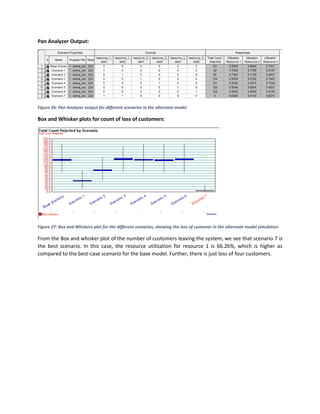
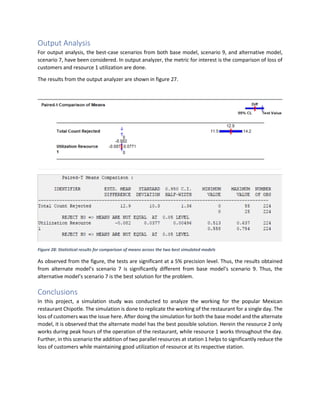
SlideShare a Scribd company logo
Simulation of Mexican
Restaurant Chipotle at the
North side of the university
campus
Submitted by:
Rohit Bhaya
M12420264
Contents
Introduction ..................................................................................................................................................3
Current Process.............................................................................................................................................3
Data Collection..............................................................................................................................................3
Data Fitting....................................................................................................................................................4
Customer Arrival Rate...............................................................................................................................4
Station 1 service time distribution............................................................................................................4
Station 2 service time distribution............................................................................................................5
Cashier service time distribution ..............................................................................................................7
Model Assumptions ......................................................................................................................................8
Base Model Building .....................................................................................................................................9
Modules used in model.............................................................................................................................9
Flowchart of Arena simulation................................................................................................................10
Animation of Arena simulation...............................................................................................................11
Alternative Model Build..............................................................................................................................12
Flowchart of Arena simulation................................................................................................................12
Statistical Analysis.......................................................................................................................................13
Scenario Simulation ....................................................................................................................................15
Process Analyzer for the base model......................................................................................................17
Process Analyzer for the alternative model............................................................................................18
Output Analysis...........................................................................................................................................20
Conclusions .................................................................................................................................................20
Introduction
Chipotle Mexican Grill is a popular Mexican cuisine fast food chain across United States. For the purpose
of the simulation project, the restaurant at North side of the university campus has been selected. It has
been observed that people have to wait frequently at the restaurant to place their order during peak
hours. Seeing the long queue’s, some customers then tend to go to other restaurants. The aim of this
project is thus to reduce the queue time of the customers during peak hours of operation, so that the
restaurant does not loses customers.
Current Process
The processing of a customer’s order at the restaurant takes place in the following way –
1) Customer enters the restaurant and waits in the queue
2) At the end of the queue, a resource greets the customer and asks for the order. For the project, I have
referenced the work station for this resource as Station 1.
3) The customer can choose from a variety of options such as burrito, burrito bowl, taco or salad
4) The customer then chooses the type of rice, bean along with their choice of meat
5) The customer is then attended by another resource, who adds the type of salsa and choice of
vegetables in their order. The work station for this resource is referenced as Station 2.
6) After that, the order is wrapped and packed
7) Thereafter, the customer heads to the cashier, where the customer can choose from side-meals
options
8) Finally, the customer is billed for their order
9) Now the customer has an option to either stay at the place and eat or take away their order
There are in total three resources to prepare the order for a customer.
Data Collection
The data was collected over a duration of a week, at random time intervals. The process time for the
following activities were recorded –
1) Inter-arrival time between two consecutive customers
2) Wait time for a customer before being serviced by a staff at the first station
3) Time taken at station 1
4) Time taken at station 2
5) Time taken at cashier
6) The number of customers sitting in the restaurant
Data Fitting
After the data was collected, the distribution of the data in each of the processes, except the arrival rate,
was determined using the input analyzer in Arena. The following results were obtained –
Customer Arrival Rate
For the restaurant, there would be a different count of customers between peak and off-peak hours. To
account for this difference, I have taken the arrival distribution of customers to be a nonstationary Poisson
process with the data given in table 1.
Table 1: Distribution of customer arrival rate for a single day
Time Interval Average number of customers per hour
11 am to 12 pm 10
12 pm to 2 pm 30
2 pm to 6 pm 20
6 pm to 9 pm 40
9 pm to 10 pm 10
Station 1 service time distribution
At this station, one single resource warms the bread, in case a burrito is ordered and then adds different
filling like type of meat, rice or bean.
Service time to warm the bread, in case the order is for burrito
The distribution of service data for this process is shown in figure 1 below.
Figure 1: Input analyzer result for service time to warm the bread
The fitted distribution is 0.15 + 0.11 * BETA(2.1, 1.8)
Service time to add fillings
The distribution of service data for this process is shown in figure 2 below.
Figure 2: Input analyzer result for service time to add fillings to order
The fitted distribution is TRIA(1, 1.24, 1.47)
Station 2 service time distribution
At this station, the other resource takes the order from the previous resource and completes the order
for the customer.
Service time to add toppings in the meal
The distribution of service data for this process is shown in figure 3 below.
Figure 3: Input analyzer result for service time to add toppings to order
The fitted distribution is TRIA(0.81, 1.03, 1.18)
Service time to wrap the order
The distribution of service data for this process is shown in figure 4 below.
Figure 4: Input analyzer result for service time to wrap the order
The fitted distribution is 0.31 + 0.3 * BETA(1.73, 1.75)
Cashier service time distribution
When the customer arrives at the cashier station, the customer can opt for any side-orders and/or drinks
before the billing takes place. The service time distribution for the processes at this station is shown
below.
Service time for any side-orders
The distribution of service data for this process is shown in figure 5 below.
Figure 5: Input analyzer result for service time for sided-orders
The fitted distribution is TRIA(0.31, 0.562, 0.68)
Service time for payment
The distribution of service data for this process is shown in figure 6 below.
Figure 6: Input analyzer result for service time during payment
The fitted distribution is 0.73 + 0.27 * BETA(1.4, 1.08)
Model Assumptions
The following assumptions were considered to build the model –
i. The model simulates the working of the restaurant for a single day only, having parameters that are
average for data collected over a week.
ii. The number of customers per arrival has been taken one.
iii. Per visit to the restaurant, a customer orders only one meal out of burrito, bowl, taco and salad
iv. The schedule of the resources doesn’t count for any breaks taken during the service period
v. The resources considered in the model are identical in efficiency
vi. It takes different time to prepare either a burrito, bowl, salad or taco. For simplicity, it has been
assumed that the burrito takes the highest time to prepare and thus, the preparation for the same
is taken as the service time for each of the processes. Further, to prepare the other meals, a time
fraction has been assumed that is multiplied to the respective service time of the meal depending
upon the attribute of the incoming customer.
Base Model Building
Modules used in model
The simulation model has a single entity, known as the customer, and three different resources,
Resource_1 for Station 1, Resource_2 for Station 2and Cashier for billing. These three resources would be
seized by the entity during the entire process. The following modules were incorporated into the model:
1) Customer enters: A create module is used that inputs the customer entities into the model. A fixed
number of entities are created basis the arrival schedule mentioned in the previous section.
2) Queue check: If the number of people in the queue to order is more than seven, then the customer
entering into the system leaves. To check for the queue length, a decide module is used.
3) Record lost customers: To count for the loss of customers due to high queue length, a record module
has been used. The record module stores the loss of customer for each hour of the operation of the
restaurant.
Figure 7: Record module setting to count loss of customers
Further, a set has been created to record these values.
Figure 8: Set entry settings for different records being measured
4) Un-serviced customer exit: A dispose module is used to exit this customer
5) Customer attribute design: The attributes for the incoming customer is assigned here. The following
attributes are assigned: type of meal, any side orders, and method of payment, cash or credit card.
The assign module has been used here.
6) Arrival at Station 1: After the queue ends, the customer arrives at Station 1. Here the customer is
serviced by Resource_1. A seize module is used to fix the resource for Station 1.
7) Warming the bread: Resource_1 warms the bread, in case the order is for a burrito. A delay module
has been used to show this process.
8) Add the filling: Resource_1 then adds the filling to the meal. In this case also, a delay module has
been used to show this process.
9) Customer leaves Station 1: The work for Resource_1 is limited to the above two processes only. The
customer now moves to Station 2. To release Resource_1 for other customers, a release module has
been used.
10) Arrival at Station 2: After Station 1, the customer moves to Station 2. Here the customer is serviced
by Resource_2. A seize module is used to fix the resource for Station 2.
11) Add the topping: Resource_2 now adds the toppings to the meal as requested by the customer. A
delay module has been used to show this process.
12) Wrapping the order: Resource_2 now completes the order for the customer. In this case, a delay
module has been used to show this process.
13) Customer leaves Station 2: The work for Resource_2 is limited to these processes only. The customer
now moves to the final station, Cashier. To release Resource_2 for other customers, a release module
has been used.
14) Arrival at Cashier: The customer is now serviced by the cashier for any extra requests by the customer.
A seize module is used to fix the resource for the Cashier.
15) Side-order: If the customer requires any side-order, the cashier will service the request. A delay
module has been used to show this process.
16) Payment for the order: Now the cashier enters the details of the order for the customer into the
system. The customer then pays for the order either using a credit card or cash. The service time
associated with all these things is processed using the delay module.
17) Customer leaves the cashier station: The order for the customer is now complete. He/she might
choose to either take-away the order or eat there itself. To release the cashier for other customers, a
release module has been used.
18) Customer exit: A dispose module is used to exit this customer
19) Statistic Entry: Statistics have been added to aid the measurement of the model performance during
process analyser and output analyser
Figure 9: Expressions for statistics
Flowchart of Arena simulation
The figures below here show the flowchart of the Arena model used to build this model.
Figure 10: Flowchart describing entry of customer and loss of customers due to high queue length
Figure 11: Flowchart to describe the working process
Figure 12: Flowchart to show the exit of serviced customer from the model
Animation of Arena simulation
Figure 12 shows the snapshot of animation of the base model.
Figure 13: Animation of working of the restaurant
Alternative Model Build
In addition to the base model built above, I have also created an alternative model. In this model build, I
have taken only one resource to take care of both station 1 and station 2 during non-peak hours. For peak
hours operations, the process is similar to the above base model. The modules used in this model are
same as the modules used in the base model.
Flowchart of Arena simulation
The figures below here show the flowchart of the Arena model used to build this model.
Figure 14: Flowchart for customer entry and loss of customer due to high queue length for alternate model
Figure 15: Flowchart for station 1 in alternate model
Figure 16: Flowchart for station 2 in alternate model
Figure 17: Flowchart for the cashier station in alternate model
Figure 18: Flowchart for customer exit in alternate model
Statistical Analysis
The main objective of this simulation is to reduce the number of customers exiting the system due to high
queue length as they enter the restaurant. So, the primary metric to measure is the number of customers
being rejected. While doing this, I’ll also compare across the utilization of the resources to get an apt
model.
The base model was initially run for ten replications to get the average number of customer rejected, due
to high queue length, and half-width value to determine the appropriate number of replications. For the
ten replications with a run time of 660 minutes, the average number of customer rejected is 47.2, with a
half-width of 11.15. To have a 5% precision, the required half-width would be 2.36.
For the rest of the statistics, the utilization of all the three resources has been considered. The half-width
for each of them is 0.01, which is already less than 5% precision.
The formula to calculate the number of replications basis decrease in half-width is given by –
𝑛 = 𝑛0 (
ℎ0
2
ℎ2)
where, 𝑛 is the number of replications required
𝑛0is the current number of replications, 𝑛0 = 10
ℎ0is the current half-width, ℎ0 = 11.15
ℎ is the desired half-width, ℎ = 2.36
Basis the value obtained in four replications of the model, the number of required replications to decrease
the half-width is 223.2. Thus, we’ll run the model for 224 replications to achieve the desired precision.
Further, I also measured the hourly loss of customers during the running of the simulation. The results for
the same is in figure 18. As observed, there is a loss of customers mostly during the peak hours of the
operation, both afternoon and evening slots, of the restaurant.
Figure 19: Hourly loss of customer from the system due to high queue length
Scenario Simulation
Using the process analyzer, I try to find out the extra number of resources required for each of the
station’s, which gives a low number of customers quitting the system. The number of resources added
should also be kept under check, so I also included resource utilization and that should also be in a good
range.
Base Model
The resource schedules at the three stations for the base model is defined as –
Schedule for resource 1
Figure 20: Schedule for resource 1
Slot 1 is the schedule for the first six hours of the operation of the restaurant. Slot 2 is the next five hours
of operation till the restaurant closes.
Schedule for resource 2
Figure 21: Schedule for resource 2
Schedule for resource 3, cashier
Figure 22: Schedule for cashier
Alternate Model
The resource schedule for the alternate model is same at the base model, only difference being the
schedule for resource 2.
Schedule for resource 2
Figure 23: Schedule for resource 2 in the alternate model
Process Analyzer for the base model
The following scenario’s have been taken in Arena’s PAN –
• Base Scenario: This is the base scenario with all three resources working, with respect to their
individual schedules, throughout the day
• Scenario 1: In this case, added one additional parallel resource to station 1 at slot 1
• Scenario 2: In this case, added one additional parallel resource to station 1 at slot 2
• Scenario 3: In this case, added one additional parallel resource to station 2 at slot 1
• Scenario 4: In this case, added one additional parallel resource to station 2 at slot 2
• Scenario 5: In this case, added one additional parallel resource to cashier at slot 1
• Scenario 6: In this case, added one additional parallel resource to cashier at slot 2
• Scenario 7: For this, added one additional resource to station 1 in both slot 1 and slot 2
• Scenario 8: For this, added two additional parallel resources at station 1 during slot 1
• Scenario 9: For this, added two additional parallel resources at station 1 during slot 2
Pan Analyzer Output:
Figure 24: Pan Analyzer output for different scenarios in base model
Box and Whisker plots for count of loss of customers:
Figure 25: Box and Whiskers plot for the different scenarios, showing the loss of customer in base model simulation
From the Box and whisker plot of the number of customers leaving the system, we see that scenario 7 is
the best scenario. However, the resource utilization for resource 1 in this case is 46.35%. The resource
utilization is very low in this case. The next best scenario is scenario 2 wherein the number of customer
loss is 17 but the utilization is 58.05%, much more as compared to scenario 7.
Process Analyzer for the alternative model
The following scenarios have been taken for the alternative model in Arena’s PAN –
• Base Scenario: This is the base scenario with all three resources working, with respect to their
individual schedules, throughout the day
• Scenario 1: In this case, added one additional parallel resource to station 1 at slot 1
• Scenario 2: In this case, added one additional parallel resource to station 1 at slot 2
• Scenario 3: In this case, added one additional parallel resource to station 2 at slot 1
• Scenario 4: In this case, added one additional parallel resource to station 2 at slot 2
• Scenario 5: In this case, added one additional parallel resource to cashier at slot 1
• Scenario 6: In this case, added one additional parallel resource to cashier at slot 2
• Scenario 7: For this, added one additional resource to station 1 in both slot 1 and slot 2
Pan Analyzer Output:
Figure 26: Pan Analyzer output for different scenarios in the alternate model
Box and Whisker plots for count of loss of customers:
Figure 27: Box and Whiskers plot for the different scenarios, showing the loss of customer in the alternate model simulation
From the Box and whisker plot of the number of customers leaving the system, we see that scenario 7 is
the best scenario. In this case, the resource utilization for resource 1 is 66.26%, which is higher as
compared to the best-case scenario for the base model. Further, there is just loss of four customers.
Output Analysis
For output analysis, the best-case scenarios from both base model, scenario 9, and alternative model,
scenario 7, have been considered. In output analyzer, the metric for interest is the comparison of loss of
customers and resource 1 utilization are done.
The results from the output analyzer are shown in figure 27.
Figure 28: Statistical results for comparison of means across the two best simulated models
As observed from the figure, the tests are significant at a 5% precision level. Thus, the results obtained
from alternate model’s scenario 7 is significantly different from base model’s scenario 9. Thus, the
alternative model’s scenario 7 is the best solution for the problem.
Conclusions
In this project, a simulation study was conducted to analyze the working for the popular Mexican
restaurant Chipotle. The simulation is done to replicate the working of the restaurant for a single day. The
loss of customers was the issue here. After doing the simulation for both the base model and the alternate
model, it is observed that the alternate model has the best possible solution. Herein the resource 2 only
works during peak hours of the operation of the restaurant, while resource 1 works throughout the day.
Further, in this scenario the addition of two parallel resources at station 1 helps to significantly reduce the
loss of customers while maintaining good utilization of resource at its respective station.

More Related Content

What's hot

A Simulation Model of Starbucks
A Simulation Model of StarbucksA Simulation Model of Starbucks
A Simulation Model of Starbucks
Spandana Pothuri
 
Simulation Project Report
Simulation Project ReportSimulation Project Report
Simulation Project Report
Jasmine Sachdeva
 
Simulation with Arena (Dental Clinic project)
Simulation with Arena (Dental Clinic project)Simulation with Arena (Dental Clinic project)
Simulation with Arena (Dental Clinic project)
Kimseng Sok
 
Chick-fil-A Express outlet Simulation
Chick-fil-A Express outlet SimulationChick-fil-A Express outlet Simulation
Chick-fil-A Express outlet Simulation
Maitrik Sanghavi
 
Gupta ayank project_report
Gupta ayank project_reportGupta ayank project_report
Gupta ayank project_report
Ayank Gupta
 
Shrivastava Shalvi project_report
Shrivastava Shalvi project_reportShrivastava Shalvi project_report
Shrivastava Shalvi project_report
Shalvi Shrivastava
 
Simulation Modeling on Campus Starbucks Coffee Center
Simulation Modeling on Campus Starbucks Coffee CenterSimulation Modeling on Campus Starbucks Coffee Center
Simulation Modeling on Campus Starbucks Coffee Center
Niharika Senecha
 
Computer Simulation Final Project
Computer Simulation Final ProjectComputer Simulation Final Project
Computer Simulation Final Project
PKalico
 
Stadium Queue Simulation
Stadium Queue SimulationStadium Queue Simulation
Stadium Queue Simulation
Aditya Singh
 
Simulation study of Gas Station
Simulation study of Gas StationSimulation study of Gas Station
Simulation study of Gas Station
Akul Mahajan
 
Bakery Production Using Arena Simulation
Bakery Production Using Arena SimulationBakery Production Using Arena Simulation
Bakery Production Using Arena Simulation
Socheat Veng
 
Barber Shop Simulation
Barber Shop SimulationBarber Shop Simulation
Barber Shop Simulation
Ravish Kalra
 
Super 8 gas station model - Arena Simulation
Super 8 gas station model - Arena SimulationSuper 8 gas station model - Arena Simulation
Super 8 gas station model - Arena Simulation
Arunkumar Jagadeesan
 
Simulation with ARENA - SM Paints
Simulation with ARENA - SM PaintsSimulation with ARENA - SM Paints
Simulation with ARENA - SM Paints
hrishik26
 
Simulation of food serving system of EWU canteen using Arena software
Simulation of food serving system of EWU canteen using Arena softwareSimulation of food serving system of EWU canteen using Arena software
Simulation of food serving system of EWU canteen using Arena software
East West University
 
Deone pranilfinalreport
Deone pranilfinalreportDeone pranilfinalreport
Deone pranilfinalreport
Pranil Deone
 
Waiting Line Management
Waiting Line Management Waiting Line Management
Waiting Line Management
Joshua Miranda
 
Queueing theory
Queueing theoryQueueing theory
Queuing theory
Queuing theoryQueuing theory
Queuing theory
Amit Sinha
 
Queuing theory and simulation (MSOR)
Queuing theory and simulation (MSOR)Queuing theory and simulation (MSOR)
Queuing theory and simulation (MSOR)
snket
 

What's hot (20)

A Simulation Model of Starbucks
A Simulation Model of StarbucksA Simulation Model of Starbucks
A Simulation Model of Starbucks
 
Simulation Project Report
Simulation Project ReportSimulation Project Report
Simulation Project Report
 
Simulation with Arena (Dental Clinic project)
Simulation with Arena (Dental Clinic project)Simulation with Arena (Dental Clinic project)
Simulation with Arena (Dental Clinic project)
 
Chick-fil-A Express outlet Simulation
Chick-fil-A Express outlet SimulationChick-fil-A Express outlet Simulation
Chick-fil-A Express outlet Simulation
 
Gupta ayank project_report
Gupta ayank project_reportGupta ayank project_report
Gupta ayank project_report
 
Shrivastava Shalvi project_report
Shrivastava Shalvi project_reportShrivastava Shalvi project_report
Shrivastava Shalvi project_report
 
Simulation Modeling on Campus Starbucks Coffee Center
Simulation Modeling on Campus Starbucks Coffee CenterSimulation Modeling on Campus Starbucks Coffee Center
Simulation Modeling on Campus Starbucks Coffee Center
 
Computer Simulation Final Project
Computer Simulation Final ProjectComputer Simulation Final Project
Computer Simulation Final Project
 
Stadium Queue Simulation
Stadium Queue SimulationStadium Queue Simulation
Stadium Queue Simulation
 
Simulation study of Gas Station
Simulation study of Gas StationSimulation study of Gas Station
Simulation study of Gas Station
 
Bakery Production Using Arena Simulation
Bakery Production Using Arena SimulationBakery Production Using Arena Simulation
Bakery Production Using Arena Simulation
 
Barber Shop Simulation
Barber Shop SimulationBarber Shop Simulation
Barber Shop Simulation
 
Super 8 gas station model - Arena Simulation
Super 8 gas station model - Arena SimulationSuper 8 gas station model - Arena Simulation
Super 8 gas station model - Arena Simulation
 
Simulation with ARENA - SM Paints
Simulation with ARENA - SM PaintsSimulation with ARENA - SM Paints
Simulation with ARENA - SM Paints
 
Simulation of food serving system of EWU canteen using Arena software
Simulation of food serving system of EWU canteen using Arena softwareSimulation of food serving system of EWU canteen using Arena software
Simulation of food serving system of EWU canteen using Arena software
 
Deone pranilfinalreport
Deone pranilfinalreportDeone pranilfinalreport
Deone pranilfinalreport
 
Waiting Line Management
Waiting Line Management Waiting Line Management
Waiting Line Management
 
Queueing theory
Queueing theoryQueueing theory
Queueing theory
 
Queuing theory
Queuing theoryQueuing theory
Queuing theory
 
Queuing theory and simulation (MSOR)
Queuing theory and simulation (MSOR)Queuing theory and simulation (MSOR)
Queuing theory and simulation (MSOR)
 

Similar to Arena Simulation of Chipotle Restaurant

Project report subway - Arena (simulation)
Project report subway - Arena (simulation)Project report subway - Arena (simulation)
Project report subway - Arena (simulation)
Poorvi Deshpande
 
Provino's System Report
Provino's System ReportProvino's System Report
Provino's System Report
Ryan Kembel
 
Process simulation study of order processing at Starbucks, University of Cinc...
Process simulation study of order processing at Starbucks, University of Cinc...Process simulation study of order processing at Starbucks, University of Cinc...
Process simulation study of order processing at Starbucks, University of Cinc...
Piyush Verma
 
Lean and Process Improvement Implementation at Subway Restaurant
Lean and Process Improvement Implementation at Subway RestaurantLean and Process Improvement Implementation at Subway Restaurant
Lean and Process Improvement Implementation at Subway Restaurant
SIDHARTH JAYANTH KINI , CLSSGB
 
Case Study using Simulation
Case Study using Simulation Case Study using Simulation
Case Study using Simulation
Sanjay Santhakumar
 
Tunga restaurant documentation
Tunga restaurant documentationTunga restaurant documentation
Tunga restaurant documentation
arrissa_david
 
Super Take-out SystemProblem DescriptionTraditional take-out i.docx
Super Take-out SystemProblem DescriptionTraditional take-out i.docxSuper Take-out SystemProblem DescriptionTraditional take-out i.docx
Super Take-out SystemProblem DescriptionTraditional take-out i.docx
picklesvalery
 
Rubric For Essay Writing In High Schools
Rubric For Essay Writing In High SchoolsRubric For Essay Writing In High Schools
Rubric For Essay Writing In High Schools
Lori Flasch
 
Analyzing and Monitoring Processes through Time Value Mapping
Analyzing and Monitoring Processes through Time Value MappingAnalyzing and Monitoring Processes through Time Value Mapping
Analyzing and Monitoring Processes through Time Value Mapping
CIToolkit
 
Team L - Six Sigma Project (The Sloopy's) - Revised.2
Team L - Six Sigma Project (The Sloopy's) - Revised.2Team L - Six Sigma Project (The Sloopy's) - Revised.2
Team L - Six Sigma Project (The Sloopy's) - Revised.2
Baozheng (Michael) Ge
 
simulation
simulationsimulation
Process analysis
Process analysisProcess analysis
Process analysis
LokeshVijayvargyJaip
 
Ms access Main project report 2 semester
Ms access Main project report 2 semesterMs access Main project report 2 semester
Ms access Main project report 2 semester
Hamza Zulfiqar
 
Software Engineering Course Project Restaurant Automation .docx
Software Engineering Course Project Restaurant Automation .docxSoftware Engineering Course Project Restaurant Automation .docx
Software Engineering Course Project Restaurant Automation .docx
lillie234567
 
Queueing model of bank
Queueing model of bankQueueing model of bank
Queueing model of bank
Pravin Kumar
 
OM Week 1.pptx
OM Week 1.pptxOM Week 1.pptx
OM Week 1.pptx
NamanAgarwal323573
 
Online food ordering system project report.pdf
Online food ordering system project report.pdfOnline food ordering system project report.pdf
Online food ordering system project report.pdf
Kamal Acharya
 
Keepcon integration tutorial_en (abril 2013)
Keepcon integration tutorial_en (abril 2013)Keepcon integration tutorial_en (abril 2013)
Keepcon integration tutorial_en (abril 2013)
keepcon-slides
 
Cse national conf 2013 (paper)
Cse national conf 2013 (paper)Cse national conf 2013 (paper)
Cse national conf 2013 (paper)
Arpit Gupte
 
Tik punya keke
Tik punya kekeTik punya keke
Tik punya keke
nuke putri
 

Similar to Arena Simulation of Chipotle Restaurant (20)

Project report subway - Arena (simulation)
Project report subway - Arena (simulation)Project report subway - Arena (simulation)
Project report subway - Arena (simulation)
 
Provino's System Report
Provino's System ReportProvino's System Report
Provino's System Report
 
Process simulation study of order processing at Starbucks, University of Cinc...
Process simulation study of order processing at Starbucks, University of Cinc...Process simulation study of order processing at Starbucks, University of Cinc...
Process simulation study of order processing at Starbucks, University of Cinc...
 
Lean and Process Improvement Implementation at Subway Restaurant
Lean and Process Improvement Implementation at Subway RestaurantLean and Process Improvement Implementation at Subway Restaurant
Lean and Process Improvement Implementation at Subway Restaurant
 
Case Study using Simulation
Case Study using Simulation Case Study using Simulation
Case Study using Simulation
 
Tunga restaurant documentation
Tunga restaurant documentationTunga restaurant documentation
Tunga restaurant documentation
 
Super Take-out SystemProblem DescriptionTraditional take-out i.docx
Super Take-out SystemProblem DescriptionTraditional take-out i.docxSuper Take-out SystemProblem DescriptionTraditional take-out i.docx
Super Take-out SystemProblem DescriptionTraditional take-out i.docx
 
Rubric For Essay Writing In High Schools
Rubric For Essay Writing In High SchoolsRubric For Essay Writing In High Schools
Rubric For Essay Writing In High Schools
 
Analyzing and Monitoring Processes through Time Value Mapping
Analyzing and Monitoring Processes through Time Value MappingAnalyzing and Monitoring Processes through Time Value Mapping
Analyzing and Monitoring Processes through Time Value Mapping
 
Team L - Six Sigma Project (The Sloopy's) - Revised.2
Team L - Six Sigma Project (The Sloopy's) - Revised.2Team L - Six Sigma Project (The Sloopy's) - Revised.2
Team L - Six Sigma Project (The Sloopy's) - Revised.2
 
simulation
simulationsimulation
simulation
 
Process analysis
Process analysisProcess analysis
Process analysis
 
Ms access Main project report 2 semester
Ms access Main project report 2 semesterMs access Main project report 2 semester
Ms access Main project report 2 semester
 
Software Engineering Course Project Restaurant Automation .docx
Software Engineering Course Project Restaurant Automation .docxSoftware Engineering Course Project Restaurant Automation .docx
Software Engineering Course Project Restaurant Automation .docx
 
Queueing model of bank
Queueing model of bankQueueing model of bank
Queueing model of bank
 
OM Week 1.pptx
OM Week 1.pptxOM Week 1.pptx
OM Week 1.pptx
 
Online food ordering system project report.pdf
Online food ordering system project report.pdfOnline food ordering system project report.pdf
Online food ordering system project report.pdf
 
Keepcon integration tutorial_en (abril 2013)
Keepcon integration tutorial_en (abril 2013)Keepcon integration tutorial_en (abril 2013)
Keepcon integration tutorial_en (abril 2013)
 
Cse national conf 2013 (paper)
Cse national conf 2013 (paper)Cse national conf 2013 (paper)
Cse national conf 2013 (paper)
 
Tik punya keke
Tik punya kekeTik punya keke
Tik punya keke
 

Recently uploaded

原版一比一多伦多大学毕业证(UofT毕业证书)如何办理
原版一比一多伦多大学毕业证(UofT毕业证书)如何办理原版一比一多伦多大学毕业证(UofT毕业证书)如何办理
原版一比一多伦多大学毕业证(UofT毕业证书)如何办理
mkkikqvo
 
06-12-2024-BudapestDataForum-BuildingReal-timePipelineswithFLaNK AIM
06-12-2024-BudapestDataForum-BuildingReal-timePipelineswithFLaNK AIM06-12-2024-BudapestDataForum-BuildingReal-timePipelineswithFLaNK AIM
06-12-2024-BudapestDataForum-BuildingReal-timePipelineswithFLaNK AIM
Timothy Spann
 
Open Source Contributions to Postgres: The Basics POSETTE 2024
Open Source Contributions to Postgres: The Basics POSETTE 2024Open Source Contributions to Postgres: The Basics POSETTE 2024
Open Source Contributions to Postgres: The Basics POSETTE 2024
ElizabethGarrettChri
 
一比一原版兰加拉学院毕业证(Langara毕业证书)学历如何办理
一比一原版兰加拉学院毕业证(Langara毕业证书)学历如何办理一比一原版兰加拉学院毕业证(Langara毕业证书)学历如何办理
一比一原版兰加拉学院毕业证(Langara毕业证书)学历如何办理
hyfjgavov
 
Orchestrating the Future: Navigating Today's Data Workflow Challenges with Ai...
Orchestrating the Future: Navigating Today's Data Workflow Challenges with Ai...Orchestrating the Future: Navigating Today's Data Workflow Challenges with Ai...
Orchestrating the Future: Navigating Today's Data Workflow Challenges with Ai...
Kaxil Naik
 
办(uts毕业证书)悉尼科技大学毕业证学历证书原版一模一样
办(uts毕业证书)悉尼科技大学毕业证学历证书原版一模一样办(uts毕业证书)悉尼科技大学毕业证学历证书原版一模一样
办(uts毕业证书)悉尼科技大学毕业证学历证书原版一模一样
apvysm8
 
Global Situational Awareness of A.I. and where its headed
Global Situational Awareness of A.I. and where its headedGlobal Situational Awareness of A.I. and where its headed
Global Situational Awareness of A.I. and where its headed
vikram sood
 
Population Growth in Bataan: The effects of population growth around rural pl...
Population Growth in Bataan: The effects of population growth around rural pl...Population Growth in Bataan: The effects of population growth around rural pl...
Population Growth in Bataan: The effects of population growth around rural pl...
Bill641377
 
Palo Alto Cortex XDR presentation .......
Palo Alto Cortex XDR presentation .......Palo Alto Cortex XDR presentation .......
Palo Alto Cortex XDR presentation .......
Sachin Paul
 
一比一原版(Unimelb毕业证书)墨尔本大学毕业证如何办理
一比一原版(Unimelb毕业证书)墨尔本大学毕业证如何办理一比一原版(Unimelb毕业证书)墨尔本大学毕业证如何办理
一比一原版(Unimelb毕业证书)墨尔本大学毕业证如何办理
xclpvhuk
 
原版一比一弗林德斯大学毕业证(Flinders毕业证书)如何办理
原版一比一弗林德斯大学毕业证(Flinders毕业证书)如何办理原版一比一弗林德斯大学毕业证(Flinders毕业证书)如何办理
原版一比一弗林德斯大学毕业证(Flinders毕业证书)如何办理
a9qfiubqu
 
一比一原版(harvard毕业证书)哈佛大学毕业证如何办理
一比一原版(harvard毕业证书)哈佛大学毕业证如何办理一比一原版(harvard毕业证书)哈佛大学毕业证如何办理
一比一原版(harvard毕业证书)哈佛大学毕业证如何办理
taqyea
 
Learn SQL from basic queries to Advance queries
Learn SQL from basic queries to Advance queriesLearn SQL from basic queries to Advance queries
Learn SQL from basic queries to Advance queries
manishkhaire30
 
Analysis insight about a Flyball dog competition team's performance
Analysis insight about a Flyball dog competition team's performanceAnalysis insight about a Flyball dog competition team's performance
Analysis insight about a Flyball dog competition team's performance
roli9797
 
一比一原版巴斯大学毕业证(Bath毕业证书)学历如何办理
一比一原版巴斯大学毕业证(Bath毕业证书)学历如何办理一比一原版巴斯大学毕业证(Bath毕业证书)学历如何办理
一比一原版巴斯大学毕业证(Bath毕业证书)学历如何办理
y3i0qsdzb
 
writing report business partner b1+ .pdf
writing report business partner b1+ .pdfwriting report business partner b1+ .pdf
writing report business partner b1+ .pdf
VyNguyen709676
 
End-to-end pipeline agility - Berlin Buzzwords 2024
End-to-end pipeline agility - Berlin Buzzwords 2024End-to-end pipeline agility - Berlin Buzzwords 2024
End-to-end pipeline agility - Berlin Buzzwords 2024
Lars Albertsson
 
Build applications with generative AI on Google Cloud
Build applications with generative AI on Google CloudBuild applications with generative AI on Google Cloud
Build applications with generative AI on Google Cloud
Márton Kodok
 
"Financial Odyssey: Navigating Past Performance Through Diverse Analytical Lens"
"Financial Odyssey: Navigating Past Performance Through Diverse Analytical Lens""Financial Odyssey: Navigating Past Performance Through Diverse Analytical Lens"
"Financial Odyssey: Navigating Past Performance Through Diverse Analytical Lens"
sameer shah
 
Udemy_2024_Global_Learning_Skills_Trends_Report (1).pdf
Udemy_2024_Global_Learning_Skills_Trends_Report (1).pdfUdemy_2024_Global_Learning_Skills_Trends_Report (1).pdf
Udemy_2024_Global_Learning_Skills_Trends_Report (1).pdf
Fernanda Palhano
 

Recently uploaded (20)

原版一比一多伦多大学毕业证(UofT毕业证书)如何办理
原版一比一多伦多大学毕业证(UofT毕业证书)如何办理原版一比一多伦多大学毕业证(UofT毕业证书)如何办理
原版一比一多伦多大学毕业证(UofT毕业证书)如何办理
 
06-12-2024-BudapestDataForum-BuildingReal-timePipelineswithFLaNK AIM
06-12-2024-BudapestDataForum-BuildingReal-timePipelineswithFLaNK AIM06-12-2024-BudapestDataForum-BuildingReal-timePipelineswithFLaNK AIM
06-12-2024-BudapestDataForum-BuildingReal-timePipelineswithFLaNK AIM
 
Open Source Contributions to Postgres: The Basics POSETTE 2024
Open Source Contributions to Postgres: The Basics POSETTE 2024Open Source Contributions to Postgres: The Basics POSETTE 2024
Open Source Contributions to Postgres: The Basics POSETTE 2024
 
一比一原版兰加拉学院毕业证(Langara毕业证书)学历如何办理
一比一原版兰加拉学院毕业证(Langara毕业证书)学历如何办理一比一原版兰加拉学院毕业证(Langara毕业证书)学历如何办理
一比一原版兰加拉学院毕业证(Langara毕业证书)学历如何办理
 
Orchestrating the Future: Navigating Today's Data Workflow Challenges with Ai...
Orchestrating the Future: Navigating Today's Data Workflow Challenges with Ai...Orchestrating the Future: Navigating Today's Data Workflow Challenges with Ai...
Orchestrating the Future: Navigating Today's Data Workflow Challenges with Ai...
 
办(uts毕业证书)悉尼科技大学毕业证学历证书原版一模一样
办(uts毕业证书)悉尼科技大学毕业证学历证书原版一模一样办(uts毕业证书)悉尼科技大学毕业证学历证书原版一模一样
办(uts毕业证书)悉尼科技大学毕业证学历证书原版一模一样
 
Global Situational Awareness of A.I. and where its headed
Global Situational Awareness of A.I. and where its headedGlobal Situational Awareness of A.I. and where its headed
Global Situational Awareness of A.I. and where its headed
 
Population Growth in Bataan: The effects of population growth around rural pl...
Population Growth in Bataan: The effects of population growth around rural pl...Population Growth in Bataan: The effects of population growth around rural pl...
Population Growth in Bataan: The effects of population growth around rural pl...
 
Palo Alto Cortex XDR presentation .......
Palo Alto Cortex XDR presentation .......Palo Alto Cortex XDR presentation .......
Palo Alto Cortex XDR presentation .......
 
一比一原版(Unimelb毕业证书)墨尔本大学毕业证如何办理
一比一原版(Unimelb毕业证书)墨尔本大学毕业证如何办理一比一原版(Unimelb毕业证书)墨尔本大学毕业证如何办理
一比一原版(Unimelb毕业证书)墨尔本大学毕业证如何办理
 
原版一比一弗林德斯大学毕业证(Flinders毕业证书)如何办理
原版一比一弗林德斯大学毕业证(Flinders毕业证书)如何办理原版一比一弗林德斯大学毕业证(Flinders毕业证书)如何办理
原版一比一弗林德斯大学毕业证(Flinders毕业证书)如何办理
 
一比一原版(harvard毕业证书)哈佛大学毕业证如何办理
一比一原版(harvard毕业证书)哈佛大学毕业证如何办理一比一原版(harvard毕业证书)哈佛大学毕业证如何办理
一比一原版(harvard毕业证书)哈佛大学毕业证如何办理
 
Learn SQL from basic queries to Advance queries
Learn SQL from basic queries to Advance queriesLearn SQL from basic queries to Advance queries
Learn SQL from basic queries to Advance queries
 
Analysis insight about a Flyball dog competition team's performance
Analysis insight about a Flyball dog competition team's performanceAnalysis insight about a Flyball dog competition team's performance
Analysis insight about a Flyball dog competition team's performance
 
一比一原版巴斯大学毕业证(Bath毕业证书)学历如何办理
一比一原版巴斯大学毕业证(Bath毕业证书)学历如何办理一比一原版巴斯大学毕业证(Bath毕业证书)学历如何办理
一比一原版巴斯大学毕业证(Bath毕业证书)学历如何办理
 
writing report business partner b1+ .pdf
writing report business partner b1+ .pdfwriting report business partner b1+ .pdf
writing report business partner b1+ .pdf
 
End-to-end pipeline agility - Berlin Buzzwords 2024
End-to-end pipeline agility - Berlin Buzzwords 2024End-to-end pipeline agility - Berlin Buzzwords 2024
End-to-end pipeline agility - Berlin Buzzwords 2024
 
Build applications with generative AI on Google Cloud
Build applications with generative AI on Google CloudBuild applications with generative AI on Google Cloud
Build applications with generative AI on Google Cloud
 
"Financial Odyssey: Navigating Past Performance Through Diverse Analytical Lens"
"Financial Odyssey: Navigating Past Performance Through Diverse Analytical Lens""Financial Odyssey: Navigating Past Performance Through Diverse Analytical Lens"
"Financial Odyssey: Navigating Past Performance Through Diverse Analytical Lens"
 
Udemy_2024_Global_Learning_Skills_Trends_Report (1).pdf
Udemy_2024_Global_Learning_Skills_Trends_Report (1).pdfUdemy_2024_Global_Learning_Skills_Trends_Report (1).pdf
Udemy_2024_Global_Learning_Skills_Trends_Report (1).pdf
 

Arena Simulation of Chipotle Restaurant

  • 1. Simulation of Mexican Restaurant Chipotle at the North side of the university campus Submitted by: Rohit Bhaya M12420264
  • 2. Contents Introduction ..................................................................................................................................................3 Current Process.............................................................................................................................................3 Data Collection..............................................................................................................................................3 Data Fitting....................................................................................................................................................4 Customer Arrival Rate...............................................................................................................................4 Station 1 service time distribution............................................................................................................4 Station 2 service time distribution............................................................................................................5 Cashier service time distribution ..............................................................................................................7 Model Assumptions ......................................................................................................................................8 Base Model Building .....................................................................................................................................9 Modules used in model.............................................................................................................................9 Flowchart of Arena simulation................................................................................................................10 Animation of Arena simulation...............................................................................................................11 Alternative Model Build..............................................................................................................................12 Flowchart of Arena simulation................................................................................................................12 Statistical Analysis.......................................................................................................................................13 Scenario Simulation ....................................................................................................................................15 Process Analyzer for the base model......................................................................................................17 Process Analyzer for the alternative model............................................................................................18 Output Analysis...........................................................................................................................................20 Conclusions .................................................................................................................................................20
  • 3. Introduction Chipotle Mexican Grill is a popular Mexican cuisine fast food chain across United States. For the purpose of the simulation project, the restaurant at North side of the university campus has been selected. It has been observed that people have to wait frequently at the restaurant to place their order during peak hours. Seeing the long queue’s, some customers then tend to go to other restaurants. The aim of this project is thus to reduce the queue time of the customers during peak hours of operation, so that the restaurant does not loses customers. Current Process The processing of a customer’s order at the restaurant takes place in the following way – 1) Customer enters the restaurant and waits in the queue 2) At the end of the queue, a resource greets the customer and asks for the order. For the project, I have referenced the work station for this resource as Station 1. 3) The customer can choose from a variety of options such as burrito, burrito bowl, taco or salad 4) The customer then chooses the type of rice, bean along with their choice of meat 5) The customer is then attended by another resource, who adds the type of salsa and choice of vegetables in their order. The work station for this resource is referenced as Station 2. 6) After that, the order is wrapped and packed 7) Thereafter, the customer heads to the cashier, where the customer can choose from side-meals options 8) Finally, the customer is billed for their order 9) Now the customer has an option to either stay at the place and eat or take away their order There are in total three resources to prepare the order for a customer. Data Collection The data was collected over a duration of a week, at random time intervals. The process time for the following activities were recorded – 1) Inter-arrival time between two consecutive customers 2) Wait time for a customer before being serviced by a staff at the first station 3) Time taken at station 1 4) Time taken at station 2 5) Time taken at cashier 6) The number of customers sitting in the restaurant
  • 4. Data Fitting After the data was collected, the distribution of the data in each of the processes, except the arrival rate, was determined using the input analyzer in Arena. The following results were obtained – Customer Arrival Rate For the restaurant, there would be a different count of customers between peak and off-peak hours. To account for this difference, I have taken the arrival distribution of customers to be a nonstationary Poisson process with the data given in table 1. Table 1: Distribution of customer arrival rate for a single day Time Interval Average number of customers per hour 11 am to 12 pm 10 12 pm to 2 pm 30 2 pm to 6 pm 20 6 pm to 9 pm 40 9 pm to 10 pm 10 Station 1 service time distribution At this station, one single resource warms the bread, in case a burrito is ordered and then adds different filling like type of meat, rice or bean. Service time to warm the bread, in case the order is for burrito The distribution of service data for this process is shown in figure 1 below. Figure 1: Input analyzer result for service time to warm the bread The fitted distribution is 0.15 + 0.11 * BETA(2.1, 1.8)
  • 5. Service time to add fillings The distribution of service data for this process is shown in figure 2 below. Figure 2: Input analyzer result for service time to add fillings to order The fitted distribution is TRIA(1, 1.24, 1.47) Station 2 service time distribution At this station, the other resource takes the order from the previous resource and completes the order for the customer.
  • 6. Service time to add toppings in the meal The distribution of service data for this process is shown in figure 3 below. Figure 3: Input analyzer result for service time to add toppings to order The fitted distribution is TRIA(0.81, 1.03, 1.18) Service time to wrap the order The distribution of service data for this process is shown in figure 4 below. Figure 4: Input analyzer result for service time to wrap the order The fitted distribution is 0.31 + 0.3 * BETA(1.73, 1.75)
  • 7. Cashier service time distribution When the customer arrives at the cashier station, the customer can opt for any side-orders and/or drinks before the billing takes place. The service time distribution for the processes at this station is shown below. Service time for any side-orders The distribution of service data for this process is shown in figure 5 below. Figure 5: Input analyzer result for service time for sided-orders The fitted distribution is TRIA(0.31, 0.562, 0.68)
  • 8. Service time for payment The distribution of service data for this process is shown in figure 6 below. Figure 6: Input analyzer result for service time during payment The fitted distribution is 0.73 + 0.27 * BETA(1.4, 1.08) Model Assumptions The following assumptions were considered to build the model – i. The model simulates the working of the restaurant for a single day only, having parameters that are average for data collected over a week. ii. The number of customers per arrival has been taken one. iii. Per visit to the restaurant, a customer orders only one meal out of burrito, bowl, taco and salad iv. The schedule of the resources doesn’t count for any breaks taken during the service period v. The resources considered in the model are identical in efficiency vi. It takes different time to prepare either a burrito, bowl, salad or taco. For simplicity, it has been assumed that the burrito takes the highest time to prepare and thus, the preparation for the same is taken as the service time for each of the processes. Further, to prepare the other meals, a time fraction has been assumed that is multiplied to the respective service time of the meal depending upon the attribute of the incoming customer.
  • 9. Base Model Building Modules used in model The simulation model has a single entity, known as the customer, and three different resources, Resource_1 for Station 1, Resource_2 for Station 2and Cashier for billing. These three resources would be seized by the entity during the entire process. The following modules were incorporated into the model: 1) Customer enters: A create module is used that inputs the customer entities into the model. A fixed number of entities are created basis the arrival schedule mentioned in the previous section. 2) Queue check: If the number of people in the queue to order is more than seven, then the customer entering into the system leaves. To check for the queue length, a decide module is used. 3) Record lost customers: To count for the loss of customers due to high queue length, a record module has been used. The record module stores the loss of customer for each hour of the operation of the restaurant. Figure 7: Record module setting to count loss of customers Further, a set has been created to record these values. Figure 8: Set entry settings for different records being measured 4) Un-serviced customer exit: A dispose module is used to exit this customer 5) Customer attribute design: The attributes for the incoming customer is assigned here. The following attributes are assigned: type of meal, any side orders, and method of payment, cash or credit card. The assign module has been used here. 6) Arrival at Station 1: After the queue ends, the customer arrives at Station 1. Here the customer is serviced by Resource_1. A seize module is used to fix the resource for Station 1. 7) Warming the bread: Resource_1 warms the bread, in case the order is for a burrito. A delay module has been used to show this process. 8) Add the filling: Resource_1 then adds the filling to the meal. In this case also, a delay module has been used to show this process. 9) Customer leaves Station 1: The work for Resource_1 is limited to the above two processes only. The customer now moves to Station 2. To release Resource_1 for other customers, a release module has been used.
  • 10. 10) Arrival at Station 2: After Station 1, the customer moves to Station 2. Here the customer is serviced by Resource_2. A seize module is used to fix the resource for Station 2. 11) Add the topping: Resource_2 now adds the toppings to the meal as requested by the customer. A delay module has been used to show this process. 12) Wrapping the order: Resource_2 now completes the order for the customer. In this case, a delay module has been used to show this process. 13) Customer leaves Station 2: The work for Resource_2 is limited to these processes only. The customer now moves to the final station, Cashier. To release Resource_2 for other customers, a release module has been used. 14) Arrival at Cashier: The customer is now serviced by the cashier for any extra requests by the customer. A seize module is used to fix the resource for the Cashier. 15) Side-order: If the customer requires any side-order, the cashier will service the request. A delay module has been used to show this process. 16) Payment for the order: Now the cashier enters the details of the order for the customer into the system. The customer then pays for the order either using a credit card or cash. The service time associated with all these things is processed using the delay module. 17) Customer leaves the cashier station: The order for the customer is now complete. He/she might choose to either take-away the order or eat there itself. To release the cashier for other customers, a release module has been used. 18) Customer exit: A dispose module is used to exit this customer 19) Statistic Entry: Statistics have been added to aid the measurement of the model performance during process analyser and output analyser Figure 9: Expressions for statistics Flowchart of Arena simulation The figures below here show the flowchart of the Arena model used to build this model. Figure 10: Flowchart describing entry of customer and loss of customers due to high queue length
  • 11. Figure 11: Flowchart to describe the working process Figure 12: Flowchart to show the exit of serviced customer from the model Animation of Arena simulation Figure 12 shows the snapshot of animation of the base model. Figure 13: Animation of working of the restaurant
  • 12. Alternative Model Build In addition to the base model built above, I have also created an alternative model. In this model build, I have taken only one resource to take care of both station 1 and station 2 during non-peak hours. For peak hours operations, the process is similar to the above base model. The modules used in this model are same as the modules used in the base model. Flowchart of Arena simulation The figures below here show the flowchart of the Arena model used to build this model. Figure 14: Flowchart for customer entry and loss of customer due to high queue length for alternate model Figure 15: Flowchart for station 1 in alternate model Figure 16: Flowchart for station 2 in alternate model
  • 13. Figure 17: Flowchart for the cashier station in alternate model Figure 18: Flowchart for customer exit in alternate model Statistical Analysis The main objective of this simulation is to reduce the number of customers exiting the system due to high queue length as they enter the restaurant. So, the primary metric to measure is the number of customers being rejected. While doing this, I’ll also compare across the utilization of the resources to get an apt model. The base model was initially run for ten replications to get the average number of customer rejected, due to high queue length, and half-width value to determine the appropriate number of replications. For the ten replications with a run time of 660 minutes, the average number of customer rejected is 47.2, with a half-width of 11.15. To have a 5% precision, the required half-width would be 2.36. For the rest of the statistics, the utilization of all the three resources has been considered. The half-width for each of them is 0.01, which is already less than 5% precision. The formula to calculate the number of replications basis decrease in half-width is given by – 𝑛 = 𝑛0 ( ℎ0 2 ℎ2) where, 𝑛 is the number of replications required 𝑛0is the current number of replications, 𝑛0 = 10 ℎ0is the current half-width, ℎ0 = 11.15 ℎ is the desired half-width, ℎ = 2.36
  • 14. Basis the value obtained in four replications of the model, the number of required replications to decrease the half-width is 223.2. Thus, we’ll run the model for 224 replications to achieve the desired precision. Further, I also measured the hourly loss of customers during the running of the simulation. The results for the same is in figure 18. As observed, there is a loss of customers mostly during the peak hours of the operation, both afternoon and evening slots, of the restaurant. Figure 19: Hourly loss of customer from the system due to high queue length
  • 15. Scenario Simulation Using the process analyzer, I try to find out the extra number of resources required for each of the station’s, which gives a low number of customers quitting the system. The number of resources added should also be kept under check, so I also included resource utilization and that should also be in a good range. Base Model The resource schedules at the three stations for the base model is defined as – Schedule for resource 1 Figure 20: Schedule for resource 1 Slot 1 is the schedule for the first six hours of the operation of the restaurant. Slot 2 is the next five hours of operation till the restaurant closes.
  • 16. Schedule for resource 2 Figure 21: Schedule for resource 2 Schedule for resource 3, cashier Figure 22: Schedule for cashier
  • 17. Alternate Model The resource schedule for the alternate model is same at the base model, only difference being the schedule for resource 2. Schedule for resource 2 Figure 23: Schedule for resource 2 in the alternate model Process Analyzer for the base model The following scenario’s have been taken in Arena’s PAN – • Base Scenario: This is the base scenario with all three resources working, with respect to their individual schedules, throughout the day • Scenario 1: In this case, added one additional parallel resource to station 1 at slot 1 • Scenario 2: In this case, added one additional parallel resource to station 1 at slot 2 • Scenario 3: In this case, added one additional parallel resource to station 2 at slot 1 • Scenario 4: In this case, added one additional parallel resource to station 2 at slot 2 • Scenario 5: In this case, added one additional parallel resource to cashier at slot 1 • Scenario 6: In this case, added one additional parallel resource to cashier at slot 2 • Scenario 7: For this, added one additional resource to station 1 in both slot 1 and slot 2 • Scenario 8: For this, added two additional parallel resources at station 1 during slot 1 • Scenario 9: For this, added two additional parallel resources at station 1 during slot 2
  • 18. Pan Analyzer Output: Figure 24: Pan Analyzer output for different scenarios in base model Box and Whisker plots for count of loss of customers: Figure 25: Box and Whiskers plot for the different scenarios, showing the loss of customer in base model simulation From the Box and whisker plot of the number of customers leaving the system, we see that scenario 7 is the best scenario. However, the resource utilization for resource 1 in this case is 46.35%. The resource utilization is very low in this case. The next best scenario is scenario 2 wherein the number of customer loss is 17 but the utilization is 58.05%, much more as compared to scenario 7. Process Analyzer for the alternative model The following scenarios have been taken for the alternative model in Arena’s PAN – • Base Scenario: This is the base scenario with all three resources working, with respect to their individual schedules, throughout the day • Scenario 1: In this case, added one additional parallel resource to station 1 at slot 1 • Scenario 2: In this case, added one additional parallel resource to station 1 at slot 2 • Scenario 3: In this case, added one additional parallel resource to station 2 at slot 1 • Scenario 4: In this case, added one additional parallel resource to station 2 at slot 2 • Scenario 5: In this case, added one additional parallel resource to cashier at slot 1 • Scenario 6: In this case, added one additional parallel resource to cashier at slot 2 • Scenario 7: For this, added one additional resource to station 1 in both slot 1 and slot 2
  • 19. Pan Analyzer Output: Figure 26: Pan Analyzer output for different scenarios in the alternate model Box and Whisker plots for count of loss of customers: Figure 27: Box and Whiskers plot for the different scenarios, showing the loss of customer in the alternate model simulation From the Box and whisker plot of the number of customers leaving the system, we see that scenario 7 is the best scenario. In this case, the resource utilization for resource 1 is 66.26%, which is higher as compared to the best-case scenario for the base model. Further, there is just loss of four customers.
  • 20. Output Analysis For output analysis, the best-case scenarios from both base model, scenario 9, and alternative model, scenario 7, have been considered. In output analyzer, the metric for interest is the comparison of loss of customers and resource 1 utilization are done. The results from the output analyzer are shown in figure 27. Figure 28: Statistical results for comparison of means across the two best simulated models As observed from the figure, the tests are significant at a 5% precision level. Thus, the results obtained from alternate model’s scenario 7 is significantly different from base model’s scenario 9. Thus, the alternative model’s scenario 7 is the best solution for the problem. Conclusions In this project, a simulation study was conducted to analyze the working for the popular Mexican restaurant Chipotle. The simulation is done to replicate the working of the restaurant for a single day. The loss of customers was the issue here. After doing the simulation for both the base model and the alternate model, it is observed that the alternate model has the best possible solution. Herein the resource 2 only works during peak hours of the operation of the restaurant, while resource 1 works throughout the day. Further, in this scenario the addition of two parallel resources at station 1 helps to significantly reduce the loss of customers while maintaining good utilization of resource at its respective station.