Downloaded 381 times
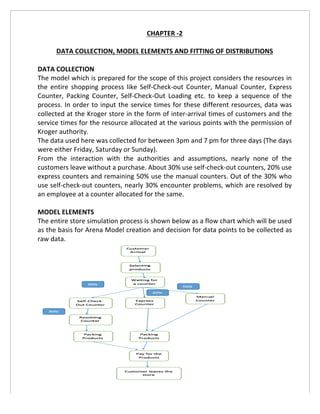
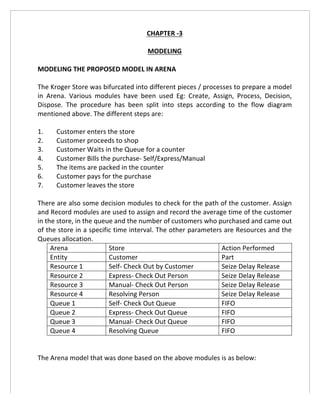
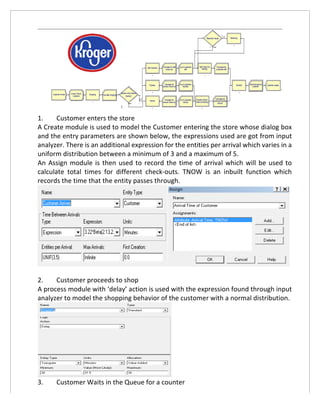
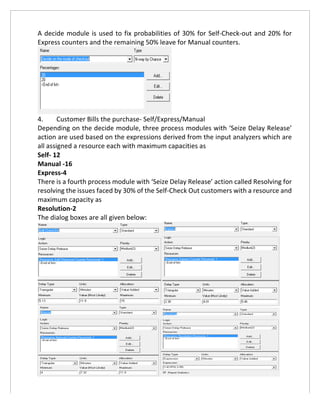
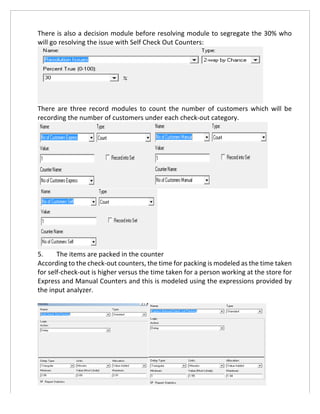
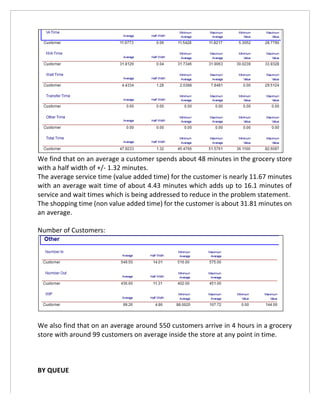
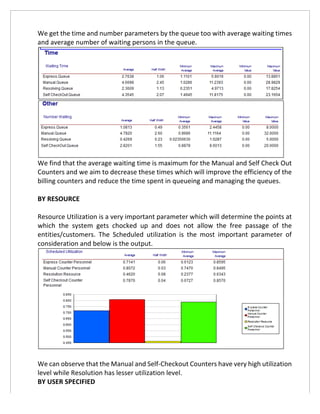
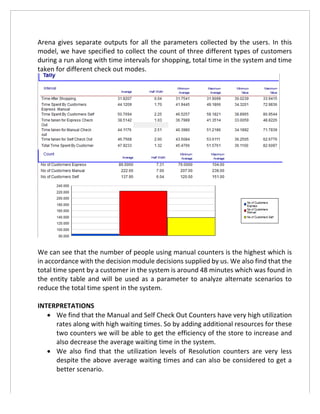
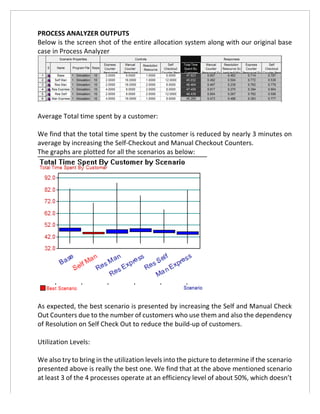
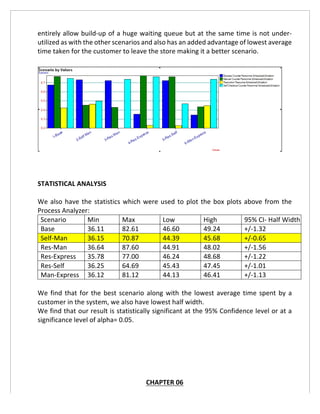

This document outlines a simulation project conducted using Arena software to improve efficiency at Kroger's store on Kenard Avenue through data analysis on customer flow, service times, and queue management. The project identifies high waiting times primarily at manual and self-checkout counters and suggests various resource allocation scenarios to enhance overall customer experience. Results indicate that increasing the capacity of checkout counters can significantly reduce customer waiting times and improve store efficiency.


![[DSC Europe 25] Josip Saban - Career building for data professionals.pptx](https://cdn.slidesharecdn.com/ss_thumbnails/zroflcttkm1vmli0txea-josip-saban-career-building-for-data-professionals-260123083019-587cdb8c-thumbnail.jpg?width=640&height=640&fit=bounds)


